

Abstract
The effects of bone morphogenetic protein (BMP) signaling on enteric neuron development were examined in transgenic mice over expressing either the BMP inhibitor, noggin, or BMP4 under control of the neuron specific enolase (NSE) promoter. Noggin antagonism of BMP signaling increased total numbers of enteric neurons and those of subpopulations derived from precursors that exit the cell cycle early in neurogenesis (serotonin, calretinin, calbindin). In contrast, noggin overexpression decreased numbers of neurons derived from precursors that exit the cell cycle late (γ-aminobutyric acid, tyrosine hydroxylase [TH], dopamine transporter, calcitonin gene related peptide, TrkC). Numbers of TH- and TrkC-expressing neurons were increased by overexpression of BMP4. These observations are consistent with the idea that phenotypic expression in the enteric nervous system (ENS) is determined, in part, by the number of proliferative divisions neuronal precursors undergo before their terminal mitosis. BMP signaling may thus regulate enteric neuronal phenotypic diversity by promoting the exit of precursors from the cell cycle. BMP2 increased the numbers of TH- and TrkC-expressing neurons developing in vitro from immunoselected enteric crest-derived precursors; BMP signaling may thus also specify or promote the development of dopaminergic TrkC/NT-3-dependent neurons. The developmental defects in the ENS of noggin overexpressing mice caused a relatively mild disturbance of motility (irregular rapid transit and increased stool frequency, weight, and water content). Although the function of the gut thus displays a remarkable tolerance for ENS defects, subtle functional abnormalities in motility or secretion may arise when ENS defects short of aganglionosis occur during development.
Keywords: development, noggin, neurotransmitters, enteric nervous system, gastrointestinal motility, autonomic nervous system
Introduction
The enteric nervous system (ENS) originates from neural crest-derived cells that emigrate to the bowel from vagal, rostral truncal, and sacral levels of the neuraxis (Burns and Le Douarin, 2001; Durbec et al., 1996; Kapur, 2000; Le Douarin and Teillet, 1973; 1974; Pomeranz et al., 1991; Serbedzija et al., 1991; Yntema and Hammond, 1954). These crest-derived precursor cells migrate (Anderson et al., 2006; Burns and Le Douarin, 2001; Druckenbrod and Epstein, 2005; Kapur, 2000; Young et al., 2004) and proliferate (Chalazonitis et al., 1998b; Hearn et al., 1998) extensively within the fetal gut. Vagal cells migrate rostro-caudally to colonize the entire gut; sacral cells arrive after their vagal counterparts and restrict themselves to the post-umbilical bowel (Anderson et al., 2006; Burns and Le Douarin, 2001; Druckenbrod and Epstein, 2005; Kapur, 2000; Young et al., 2004). The ENS matures in a rostro-caudal gradient (Young et al., 1998), ultimately forming an outer myenteric and an inner submucosal plexus. In mammals, crest-derived cells initially migrate within the outer gut; however, a subset of these cells secondarily follow a gradient of mucosally secreted netrin and migrate inwardly to form the submucosal plexus (Jiang et al., 2003).
Regulatory molecules, which include the bone morphogenetic proteins (BMPs), play critical roles in the formation and regionalization of the gut prior to its colonization by crest-derived cells (Roberts et al., 1995; Roberts et al., 1998). After these cells have colonized the bowel and neurons begin to appear, BMP2 and 4 (but not BMP7) continue to be expressed in the fetal gut and regulate the specification, migration, differentiation and aggregation of enteric neurons (Chalazonitis et al., 2004; Faure et al., 2007; Fu et al., 2006; Goldstein et al., 2005; Pisano et al., 2000). When BMP signaling is inhibited at a late stage in the developing gut by the transgenic (Chalazonitis et al., 2004) or retrovirally mediated (Goldstein et al., 2005) overexpression of noggin (a BMP antagonist), the number of enteric neurons in the small intestine increases, but at the same time, the proportion of neurons in each plexus that express the neurotrophin-3 (NT-3) receptor, TrkC, is reduced (Chalazonitis et al., 2004). BMP2 and 4 thus regulate the size of the neuronal population of the ENS and the acquisition of NT-3-dependence by the TrkC-expressing subset of enteric neurons (Chalazonitis et al., 2004).
The ENS is the most phenotypically diverse region of the PNS (Furness, 2006; Gershon, 2005); nevertheless, relatively little is known about how the phenotypic diversity of the ENS is generated. BMP signaling is known to promote neuronal differentiation at the expense of continued proliferation of stem cells (Varga and Wrana, 2005). This effect, and BMP promotion of TrkC expression, suggest that BMP signaling during the period of enteric neurogenesis may alter, not just the number of neurons that populate the ENS, but also the proportional distribution of various subtypes. Because enteric neurons of different phenotypes are born at different times during development (Pham et al., 1991), it is possible that the susceptibility of specific subsets of neuron to altered BMP signaling varies as a function of neuronal birthdates. We have therefore tested the hypotheses that interference with BMP signaling by the transgenic overexpression of noggin or BMP4 alters phenotypic expression as well as neuron number in developing mice, that the subtypes of neurons affected reflect the dates at which they are born, and that noggin-induced changes in neuronal phenotype affects the ability of the ENS to control gastrointestinal motility. Confirmatory in vitro studies were also carried out with BMP2 and/or BMP4, ligands that stimulate the same BMP receptors.
Part of this work has previously been summarized in abstract form (Chalazonitis et al., 2005)
Materials & Methods
Animals
Fetal rat bowel was obtained from timed pregnant Sprague Dawley dams (Charles River laboratories, Waltham MA). Fetal mouse gut was obtained from timed pregnant CD-1 (Charles River Laboratories, Waltham, MA) and transgenic dams. Both male and female animals were analyzed. Mice that overexpress noggin (Guha et al., 2004) or BMP4 (Gomes et al., 2003), each under the control of the NSE promoter, were generated as previously described. The polymerase chain reaction was used to amplify cDNA encoding noggin from E19 mouse brain. This cDNA was then subcloned into a bicistronic vector containing enhanced green fluorescent protein (EGFP) behind an internal ribosomal entry site (IRES). The noggin sequence was verified and the noggin-IRES-EGFP construct was further subcloned into a pNSE-Ex4 plasmid (Do Thi et al., 2007), which contains 4 kb of rat NSE gene DNA with 2.8 kb of 5' flanking DNA, 50 bp of the non-translated exon I, 1.2 kb of intron I and 6 bp of exon II (with no AUG). The noggin-IRES-EGFP fragment was inserted downstream of the NSE promoter and upstream of an SV40 polyadenylation signal, at the SalI site of the pNSE-Ex4 plasmid. The NSE-promoter construct thus contained the initial non-coding exon and the first intron of the rat Nse gene. The NSE-BMP4 construct was similar, except that a 1246 bp fragment containing the full cDNA coding sequence of mouse BMP4 (obtained from Genetics Institute, Inc. Cambridge, MA), rather than noggin-IRES-EGFP, was inserted downstream of the NSE promoter and upstream of the SV40 polyadenylation signal, at the HindII site of the pNSE-Ex4 plasmid.
The NSE-noggin mice were derived from a founder of the FVB inbred mouse strain; littermates were bred and transgene expression, which was stable was monitored by Southern blotting according to a standard protocol in each experiment (Guha et al., 2004). NSE-BMP4 mice were derived from CB6F1 mouse embryos, and founder animals were identified by Southern blot analysis. Three stable lines were obtained, and these were maintained by successive backcrosses to CB6F1 (Gomes et al., 2003). Again, transgene expression was monitored in each experiment by Southern blotting. Transgene expression in the NSE-noggin mice is detectable by E16 (see results) and persists into the adult (Guha et al. 2004). In the NSE-BMP4 mice increased expression of BMP-4 is first detected in immunoblots at E16 (Gomes et al. 2003).
Occurrence of a vaginal plug was counted as gestational day 0. Pregnant animals were euthanized by CO2 inhalation and thoracotomy. Rat and mouse fetuses were removed and gut was collected under aseptic conditions. The Animal Care and Use Committees of Columbia and Northwestern Universities approved these procedures.
PCR
Pairs of oligonucleotide primers for amplification of cDNA encoding β-actin, NSE (2γ) were designed from published mouse cDNA sequences. The primer sequences and the programs employed for PCR amplification with each primer pair are listed in Table 1. The identities of all PCR products were confirmed by sequence analysis. For this purpose, PCR products were subcloned into pGEM-T Easy vectors (Promega, Madison, WI) by using the TA-cloning kit (Invitrogen Corporation, Carlsbad, CA). Inserts in two individual clones were sequenced by the dideoxynucleotide-chain termination method in the DNA Facility of Columbia University. The sequences of the PCR products obtained from brain and gut with the indicated primers were found to be identical to those of the appropriate regions of the GenBank sequences of the amplified cDNAs.
Table 1.
PCR primers, conditions used for amplification, and expected sizes of PCR products
| Protein Genebank# | Sense (5′−3′)/Nucleotides | Antisense (5′−3′)/Nucleotides | Cycles (n) | Anneal. Temp (°C) | Product (bp) |
|---|---|---|---|---|---|
| MouseNSE | ATTTTGCTAG | CATCTCCGTGG | |||
| 40 | 57 | 234 | |||
| (eno2γ) | CATGGGAA | CTTTGAAAT | |||
|
NM 013509 |
2058−2075 |
2289−2270 |
|
|
|
| Mouse β- | TGTTTGAGAC | CAGTAATCTCC | |||
| 40 | 57 | 588 | |||
| Actin1 | CTTCAACACC | TTCTGCATCC | |||
| NM 007393 | 448−467 | 1035−1015 |
Real time PCR
Real time PCR was used to quantify transcripts encoding NSE in the fetal and adult mouse gut. The expression of NSE was normalized to that of β-actin. Transcripts encoding β-actin were first quantified by real time PCR with the SYBR Green Jumpstart Taq ReadyMix (Sigma, St. Louis, MO) using a LightCycler™ instrument (Roche Diagnostics Corporation, Indianapolis, IN). Measurements were obtained by referring to standard curves that were prepared by serially diluting plasmid DNA encoding NSE and β-actin. The dilutions of β-actin and NSE plasmid DNA ranged from 1 pg to 10 ng in 5 series, each of which covered a 10-fold range.
Amplifications were carried out in a final volume of 20 μl of a commercial reaction mixture (Sigma) that contained Taq DNA polymerase, reaction buffer, dNTPs in which dTTP is replaced by dUTP, SYBR Green I dye, and MgCl2. The final concentrations of primers used for the amplification of cDNA encoding β-actin was 0.3 μM and those for NSE was 12.0 nM. The final concentration of MgCl2 was 4.0 mM. To this mixture were added 2 μl of either the serially diluted plasmid DNA (standards) or the cDNA prepared from tissue. The standards and the cDNA from tissues were simultaneously subjected to real time PCR analysis in parallel capillary tubes. The PCR reactions were carried out according to the programs in Table 1. The appearance of double stranded DNA was quantified by measuring the fluorescence of SYBR Green after each step of elongation. A melting point analysis was finally carried out to prove that a single moiety was amplified; samples were incubated at 95°C for 0 sec, at 67°C for 15 sec, and then from 67°C to 95°C with a transition rate of 0.2°C/sec. Data were analyzed with computer assistance employing the LightCycler™ software.
Antibody Characterization
Antibodies are listed in Table 2. Affinity purified polyclonal antibodies to p75NTR were raised in rabbits (#9651, donated by Dr. Moses Chao, Skirball Institute, New York University, NY, NY). The immunogen was a peptide fragment corresponding to amino acids 43−161 (SGECCKACNLGEGVAQPCGANQTVCEPCLDSVTFSDVVSATEPCKPCTECLGLQ SMSAPCVEADDAVCRCSYGYYQDEETGRCEACSVCGVGSGLFFSCQDKQNTVC EECPEGTYSDE), which encompasses the 4 cysteine-rich repeats of the extracellular domain of the mouse p75NTR receptor (Lee et al., 1992). This antibody has previously been used to locate sites of p75NTR immunoreactivity in mouse tissues (Huber and Chao, 1995). The antibody recognizes rat p75NTR; the sequence of amino acids 41−158 of rat p75NTR is identical to that of mouse p75NTR. The antibodies have been found to block the binding of 125I-NGF, BDNF and NT-3 to rat or mouse p75 NTR (Huber and Chao, 1995) and to inhibit substance P up-regulation in response to NGF in rats (Skoff and Adler, 2006). We have tested the antibodies to p75NTR by applying them to frozen sections of adult gut dissected from mice with targeted mutations of the gene encoding p75NTR (donated by Drs. Barbara Hempstead and Pouneh Kermani, Weill- Cornell Medical College; also available at Jackson laboratory [Bar Harbor, ME; strain # B6.129S4-Ngfrtm1Jae/J]). Immunoreactivity in the gut of these animals was compared to that in their WT littermates. As expected, neurons and glia in both the myenteric and submucosal plexuses of the wild-type mice exhibited strong p75NTR immunoreactivity; however, no immunoreactivity could be detected anywhere in the bowel wall of mice lacking p75NTR (Supplemental Fig1).
Table 2.
Antibodies used to identify subsets of enteric neurons
| Antigen/Species | Host | Dilution |
|---|---|---|
| 5- HT | Rabbit polyclonal | 1:1000 |
| Calretinin/rat | Rabbit polyclonal | 1:3000 |
| Calbindin/rat | Rabbit polyclonal | 1:1000 |
| NOS-1/rat | Rabbit polyclonal | 1:2000 |
| NOS-1/human | Rabbit polyclonal | 1:2000 |
| TrkC/kinase domain rat | Rabbit polyclonal | 1:200 |
| TrkC/C-terminal /rat | Rabbit polyclonal | 1:200 |
| TrkC/Intracellular domain/rat | Rabbit polyclonal | 1:200 |
| TH/rat | Sheep polyclonal | 1:750 |
| TH/rat (in vitro experiments) | Rabbit polyclonal | 1:200 |
| DAT/rat | Rabbit polyclonal | 1:400 |
| GABA | Rabbit polyclonal | 1:2500 |
| Guinea Pig polyclonal | 1:1000 | |
| CGRP/rat | Rabbit polyclonal | 1:2000 |
| 5-HT1A/sequence common to human, rat, and mouse | Rabbit polyclonal | 1:2300 |
| p75NTR mouse | Rabbit polyclonal | 1:1000 |
| MAP1b/MAP5/rat | Mouse monoclonal | 1:200 |
| BrdU | Rat monoclonal | 1:1000 |
Three affinity-purified antibodies raised in rabbits against three different domains of TrkC were used. One antibody (donated by Dr. Barbara Hempstead) was raised against a peptide with the sequence of amino acids 639−653 (ILVDGQPRQAKGE) of rat TrkC encompassing the kinase domain. This antibody reacts with isoforms of TrkC that contain an active kinase but not with TrkB or TrkA (Donovan et al., 1996) (Chalazonitis et al., 2001). A second antibody (anti-TrkCin2; (donated by Dr. David Kaplan, Sick Kids Hospital, Toronto, Canada) was generated against a peptide corresponding to the sequence of amino acids 88−108 (WRGLHTLNAVDMELYTGLQKL) of rat TrkC. This sequence is included in an intracellular domain of rat TrkC. This peptide sequence is conserved in mouse TrkC. In immunoblots, TrkCin2 yields a single band corresponding to TrkC, and does not react with TrkA or TrkB (Belliveau et al., 1997). The third antibody, purchased from Santa Cruz Biotechnologies (SC-117) was raised in rabbit against a peptide with the sequence corresponding to amino acids 798−812 (QQRLNIKEIYKILHA) located within the C-terminal domain of porcine TrkC (#P24786); this sequence is identical to that of the corresponding domain of mouse TrkC (#Q6VNS1). Prior studies demonstrated that immunostaining with SC-117 was abolished by preabsorption with the immunogen peptide (SC-117P) (Chalazonitis et al., 2004). Immunoblots carried out by the manufacturer reveal no cross-immunoreactivity with TrkA or TrkB. Similar patterns of immunostaining were obtained with each of the three antibodies to TrkC.
Two rabbit polyclonal antibodies to NOS-1 were used. One (SC-648) was raised against a peptide sequence corresponding to amino acids 1400−1419 (MTQQQKLSEEDAGVFISRLR), which is located within the C-terminal domain of rat NOS-1. This sequence is conserved in mouse NOS-1. The second antibody (SC-1025) was raised against a peptide sequence corresponding to amino acids 38−57 (KPPVIISDLIRGGAAEQSGL), which is located within the N-terminal domain of NOS-1 and is conserved in mouse and human NOS-1. Both antibodies were tested in transgenic mice lacking NOS-1 (Huang et al., 1993) and their wild-type littermates (Jackson Laboratory, strain B6;129S4-Nos1 tm1plh). Strongly NOS-immunoreactive neurons were found in wild-type, but not in the knockout animals with both primary antibodies (data not illustrated).
A rabbit polyclonal antibody to the rat 5-HT1A receptor was used (Catalogue number, 25404; ImmunoStar Inc. Hudson, WI). It was raised against a peptide sequence corresponding to amino acids 294−312 (EVHRVGNSKEHLPLPSESG). This sequence is common in the rat, mouse, and human 5-HT1A receptor. A single band of approximately 45 kD has been found in Western blots of brain and the antibody has been found to provide strong immunostaining of brain regions known to be rich in 5-HT1A receptors and found by in situ hybridization and Northern blotting to be rich in transcripts that encode 5-HT1A (Kia et al., 1996; Konings et al., 1995). The distribution of 5-HT1A immunoreactivity found in the ENS in the present study was similar that previously reported (Kirchgessner et al., 1993; Kirchgessner et al., 1996). Immunostaining is prevented by absorption with the immunogen.
An affinity-purified antibody to tyrosine hydroxylase (TH) was raised in sheep from native TH purified from a rat pheochromocytoma A (P60101; Pel-Freez,Rogers, Arkansas). The sequence of TH in rat is 97.5% identical to that of mouse. These antibodies yield single bands in immunoblots from a variety of tissues, selectively enhance TH activity, and have been used previously in many studies to locate TH in mammalian tissue (Haycock and Waymire, 1982; Renfroe et al., 1984). Additional polyclonal antibodies to rat TH were raised in rabbits (Protos Biotech Corp; formerly Eugene Tech International, Inc. Ridgefield NJ). These antibodies have been employed by many investigators to study the ENS. Specifically, cutting the sympathetic nerves to ablate the extrinsic sympathetic innervation of the bowel abolishes the immunostaining of the varicose sympathetic axons, but leaves intact the dopaminergic neurons of the submucosal plexus; dopamine, dopamine transporter (DAT), and TH are all co-expressed in these neurons (Li et al., 2004). No other neurons are immunostained by these antibodies in the bowel.
Polyclonal rabbit antibodies to 5-HT (NT-102; Protos Biotech Corporation, New York, NY) were raised against a formaldehyde 5-HT-hemocyanin conjugate. Immunostaining is abolished by absorption with the immunogen. The antibody demonstrates the 5-HT-rich enterochromaffin cells of the gut, murine mast cells, known serotonergic neurons of the brainstem, and does not non-specifically immunostain other types of neuron. The antibody fails to demonstrate enterochromaffin cells in the gut of transgenic mice lacking the 5-HT biosynthetic enzyme, tryptophan hydroxylase-1 (data not illustrated).
Polyclonal rabbit antibodies to the rat dopamine transporter (DAT; (Chemicon/Millipore) were raised against a keyhole limpet hemocyanine conjugate of a 19-amino acid peptide (42−59; LTNSTLINPPQTPVEAGE), the sequence of which is located near the N-terminus of DAT. This sequence is conserved in mouse. The antibody recognizes a 75−80 kDa band in rat striatum, which is rich in dopaminergic terminals, but not in the DAT-poor cerebellum (Hastrup et al., 2001).
Two polyclonal rabbit antibodies to calretinin, one raised against guinea pig calretinin (AB149; Chemicon) and one against a recombinant rat calretinin (AB5054; Millipore), were used. The sequence of the protein is conserved in mouse. In immunoblots, both antibodies react specifically with calcium bound and unbound conformations of calretinin. Similar localization was found with both antibodies. The location of thalamic neurons immunostained (AB149) to demonstrate calretinin has been shown to correspond to those shown by in situ hybridization to contain transcripts encoding calretinin (Winsky et al., 1992).
Polyclonal rabbit antibodies to calbindin (AB1778) were raised against recombinant mouse calbindin D. The antibodies have been affinity purified and absorbed against calretinin. One 28kDa band is found on immunoblots of mouse brain or small intestinal lysates. Localization of calbindin-immunoreactive neurons was found to be similar to that reported previously in mouse gut (Sang and Young, 1998).
Polyclonal antibodies to protein conjugates of γ-aminobutyric acid (GABA) were used. One was raised in guinea pigs against a glutaraldehyde-mediated keyhole limpet hemocyanin-GABA conjugate (AB175), the other (A2052) was raised in rabbits against a bovine serum albumin-GABA conjugate. Both antibodies react with the immunogens in dot blots and immunoreactivity can be removed by preabsorption with the antigens. Immunostaining of GABA in neurons by antibodies A2052 was almost eliminated in neurons from mice lacking glutamic acid decarboxylase (GAD)–67, in which GABA levels are low due to the absence of one of the GABA biosynthetic enzymes (Ji and Obata, 1999). There is no GABA immunoreactivity at all in the cerebellum of double knockout mice lacking GAD65 and GAD67 (Ji et al., 1999).
Rabbit polyclonal antibodies to rat α-calcitonin gene related peptide (CGRP; C8198, Sigma, Saint Louis, MO) were used. The sequence of CGRP is conserved between rat and mouse. The commercial product is a delipidized whole antiserum. In dot blots there is negligible cross-immunoreactivity with calcitonin, somatostatin, and amylin. CGRP immunostaining is abolished in the dorsal root ganglia and dorsal spinal cord of mice lacking α-CGRP (Zhang et al., 2001).
Mouse monoclonal antibodies to microtubule–associated proteins MAP1b/MAP5 (clone AA6, isotype IgG1; Sigma St Louis, MO, catalogue number M4528) were used. These antibodies were raised by immunizing mice against MAP1 proteins purified from twice recycled rat brain microtubules (Huber and Matus, 1984). Hybridoma media were screened against dots of microtubule protein and then, if positive, against SDS gel blots to identify the antigen that was recognized. The resulting clone AA6 antibodies to MAP1b have been demonstrated to decorate brain microtubules when examined by immunocytochemistry and not to cross-react with other microtubule-associated proteins or with tubulins (Riederer et al., 1986). These antibodies, moreover, label cortical neurons transfected with constructs of a fragment of the MAP1b sequence between amino acids 127−1367 (Uchida, 2003).
Rat antibodies to bromodeoxyuridine (BrdU; clone BU1/75, purified IgG2a, catalogue number MCA2060T; Serotec, Oxford, UK) were employed. This preparation is an IgG purified by ion exchange chromatography. It has been shown to react with BrdU incorporated into single stranded DNA, BrdU attached to a protein carrier, and free BrdU. The antibodies do not react with thymidine but do cross-immunoreact weakly with chlorodeoxyuridine (which was not employed in the current investigation). When DNA is denatured, immunolocalization of incorporated BrdU is comparable to the radioautographic localization of incorporated tritiated thymidine.
Immunoselection
Crest-derived cells were immunoselected from the fetal rat gut with antibodies to the common neurotrophin receptor p75NTR at E14 as described previously (Chalazonitis et al., 2004; Chalazonitis et al., 2001; Chalazonitis et al., 1998a; Chalazonitis et al., 1998b; Pomeranz et al., 1993). The fetal gut was dissociated with collagenase to yield a single cell suspension. The cells were exposed, sequentially, to antibodies to p75NTR and to goat anti-rabbit secondary antibodies coupled to magnetic beads (Miltenyi Biotec, Auburn CA). The cell suspension was then passed through a column in a magnetic field (Miltenyi Biotec, Auburn CA). Crest-derived cells, which in the fetal gut are all p75NTR-immunoreactive become decorated by beads and are retained in the magnetic field, while the non-crest-derived cells pass through. Removal of the magnetic field thus allows the subsequent elution of a purified population of crest-derived cells.
Tissue culture
Immunoselected crest-derived cells were exposed to vehicle (0.5% bovine serum albumin), human recombinant BMP2 or 4 (Wyeth, Cambridge MA) and/or NT-3 (Regeneron Pharmaceuticals, Tarrytown NY) in basic Brazeau medium (BBM) (Ziller et al., 1983). The medium was initially supplemented with 20% horse serum (JRH Biosciences, Lenexa, KS) for 18 hrs to permit cells to adhere maximally to their substrate, but cultures were subsequently maintained in serum-free BBM (Chalazonitis et al., 2004). Parameters of enteric neuronal development were analyzed after 4 days of treatment.
Immunocytochemistry
Procedures used for the immunocytochemical detection of antigens in cultured cells were similar to those described previously (Chalazonitis et al., 2004). Briefly, cultures were fixed for 1 hr with 4% formaldehyde (from paraformaldehyde), processed, and examined intact. Double label immunocytochemistry was employed to identify tyrosine hydroxylase (TH)-expressing neurons. Mouse monoclonal antibodies to rat MAP1b/MAP5 (see above) were used as a neuronal marker and TH immunoreactivity was demonstrated with rabbit polyclonal antibodies (diluted 1:200). Secondary antibodies were goat anti-mouse coupled to Alexa 488 and goat anti-rabbit coupled to Alexa 594 (Molecular Probes, Eugene OR). No fluorescence was observed when either primary antibody was omitted. Immunostained cultures were analyzed with a Leica DMRXA2 microscope equipped with dichroic mirror/filter assemblies that permitted no cross-detection.
The intestines were removed from 4-week-old mice, fixed with 4% formaldehyde (freshly prepared from paraformaldehyde) and dissected to obtain laminar preparations of gut wall. Layers containing the submucosal and myenteric plexuses were obtained and separately analyzed. Subsets of enteric neurons were identified by the immunocytochemical detection of markers, including 5-hydroxytryptamine (5-HT), calretinin, calbindin, neuronal nitric oxide synthase (NOS1), TrkC, TH, DAT, gamma aminobutyric acid (GABA), and CGRP. Primary antibodies were applied overnight at room temperature. When secondary antibodies labeled with horseradish peroxidase (HRP) were employed, endogenous peroxidase activity was first blocked with 0.3% H2O2 in PBS. Subsequent procedures were similar to those described previously (Chalazonitis et al., 2004; Pham et al., 1991). Peroxidase activity was visualized with H2O2 and DAB with or without nickel intensification. Total numbers of neurons were counted in laminar preparations of colon from 1 month-old mice. Neurons were selectively stained with cuprolinic blue (0.5% in 0.05mM Na acetate buffer pH5.6, containing 1.0 M MgCl2 for 1 hr at 37° C) (Heinicke et al., 1987; Karaosmanoglu et al., 1996; Phillips et al., 2004).
Exit of enteric neurons from the cell cycle
The timing of the terminal mitoses of subsets of enteric neurons was determined by demonstrating the uptake of 5-bromo-2’-deoxyuridine (BrdU) or tritiated thymidine (3H-TdR). BrdU (10mg/ml; #280879; Roche Applied Sciences, Indianapolis, IN) was dissolved in 0.9% NaCl at 42 °C and filtered. Single intraperitoneal injections of BrdU (150 μg/g) were administered to gravid mice (at 12, 14, or 16 days of gestation) or to neonatal animals (P1). Single intraperitoneal injections of 3H-TdR (Pham et al., 1991) were administered to gravid mice (E8−18 days of gestation) or to neonatal animals (P1-P21). BrdU and 3H-TdR labeling of enteric neurons were analyzed at P28. Laminar preparations of fixed duodenum and jejunum were obtained as described above, to allow the myenteric and submucosal plexus to be examined in whole mounts (Pham et al., 1991). Neurons were identified by immunocytochemically demonstrating markers with primary antibodies (see Table 2), which were visualized with species-specific affinity purified secondary antibodies coupled to Alexa 488. Following the application of secondary antibodies, tissue was washed and treated with 2N HCl at room temperature for 75 min to denature the DNA for BrdU detection. Tissues were then washed (30 min), incubated for 16 hrs at 4 °C with a rat monoclonal antibody to BrdU (see above) and exposed for 4 hrs (room temperature) to a donkey anti-rat antibodies coupled to Alexa 594. Immunolabeled tissue was mounted with Vectashield (Vector Laboratories, Inc. Burlingame, CA) and viewed by fluorescence microscopy as described above. 3H-TdR (Perkin-Elmer, [formerly New England Nuclear] Waltham, MA) was employed to determine the birthdates of enteric dopaminergic neurons, which were identified by their TH-immunoreactivity. 3H-TdR was injected at 4−8 hr intervals for a 24 hr period to obtain a continuous blood level of 3H-TdR (Pham et al. 1991). 3H-TdR incorporation was detected by radioautography in conjunction with immunocytochemistry of neurons labeled with TH antibodies (Table 2). Immunostained whole mounts, which had been defatted by incubation with 80% ethanol were flattened on slides that had been pretreated with chromium-alum gelatin, air dried, and then coated with Ilford L4 photographic emulsion (diluted 1:1 with distilled H2O; Polysciences Inc., Warrington, PA) by dipping. Slides were exposed in a dry lightproof box at 4°C. The radioautographs were developed with Kodak D19 developer for 5−10 minutes, fixed, washed, dehydrated, cleared in Histoclear (National Diagnostic), and coverslipped with Permount. Vertical darkfield illumination was also employed so that the light was reflected from the radioautographic silver grains in the emulsion overlying the tissue. As a result, the silver grains appeared white on a dark background and could easily be distinguished from the reaction product indicative of immunoreactivity. The proportion of each set of neurons with BrdU- or 3H-TdR-labeled nuclei was determined at each age injected.
Quantitation of defined enteric neuronal subsets
In culture
The effect of BMP2 on the expression of TH in developing enteric neurons was assessed in culture. The number of TH-immunoreactive neurons developing in each dish ± BMP2 was determined and expressed as a percent of those developing in replicate cultures exposed to vehicle. Because BMP2 alters the total number of cells developing in vitro (Chalazonitis et al., 2004), the number of TH-immunoreactive neurons was also expressed as a proportion of the total number of neurons present in order to determine whether BMP2 selectively affects the TH-immunoreactive neuronal population.
In transgenic animals over expressing noggin or BMP4
Nerve cell bodies (stained either with cuprolinic blue to estimate total numbers of neurons or immunostained to assess individual subsets) were counted 6−10 times in 10 contiguous non-overlapping rectangular fields covering 1.254 mm2 (Chalazonitis et al., 2004). The fields were random and unbiased with regard to ganglia; preparations were scanned, without regard to type of preparation, in perpendicular axes across the width and length of each tissue. Neurons were quantified in the small intestine (derived from counts obtained separately in 3−4 replicate samples of duodenum, jejunum, and ileum) and the colon. Data were expressed as a density (neurons/mm2) of each subset of neuron of myenteric or submucosal plexus and as the density in transgenic noggin- or BMP4-overexpressing animals normalized to that in wild-type littermates (% wild-type). Because the noggin antagonism of the effects of BMPs in transgenic mice affects the total numbers of neurons, the densities of individual subtype of enteric neuron were also normalized in each region of the intestine to the mean total number of neurons in the corresponding region (total neuron densities were previously determined for each plexus, Chalazonitis et al. 2004) and in each type of animal (% total neurons). Twenty-five wild-type (WT), 38 Nog/+, and 20 Nog/Nog mice were analyzed at P24−34. Four WT and 4 BMP4/+ mice were analyzed at P24−25.
Determination of the frequency, weight, and water content of stool
Estimates were obtained from 6 noggin overexpressing and 5 wild-type littermates at P35−38. Each animal was provided unlimited access to water and food and was allowed to adapt to isolation in a cage for one dark/light cycle (12 hr/12hr). During the course of a one hr observation period, stools were collected immediately upon defecation and sealed in pre-weighed tubes. The frequency of defecation, as well as the wet and dry weights of collected stool pellets, were measured. The difference between wet and dry weight of stool was used to compute the stool water content.
Estimate of gastrointestinal transit time (GTT)
GTT was evaluated in the same animals that were used to determine stool frequency and water content. Bacillus stearothermophillus spores (BSS; 2 × 10⁷ in 0.2 ml) were administered by gavage (Bellier et al., 2005; Li et al., 2006). These spores pass through the gastrointestinal tract and germinate at 65° C, a temperature that kills normal intestinal flora. Fecal pellets were collected after 3, 6, 9, 12, 24, 36, 48, 72 and 96 h, dried, and weighed. The dry stool was pulverized, re-suspended in 1.25 times its weight in water, re-diluted so as to obtain 30−300 colonies per plate and 0.1 ml was smeared on trypticase soy agar plates. Plates were incubated for 12−16 h at 65°C and colonies of bacteria were counted. The mean transit time (MTT, in hours) for each mouse was estimated as ∑(miti)/ ∑mi where mi is the number of BSS present in the feces passed at time interval ti (h) after the gavage. The method to estimate the MTT makes no assumptions about the kinetics of gut transit. Maximum velocity and acceleration of the spores transit were also estimated. These parameters were obtained with the Microsoft Excel program. Means ± sem were calculated and analyzed by Student t- test or ANOVA (Tukey or Bonferrroni-Dunn post hoc comparisons) when appropriate.
Photomicrographs were captured with a digital CCD camera Retiga™ Exi mounted on a Leica DMRXA2 microscope using the Improvision (Openlab versions 3.0 and 5.0) software. The photomicrographs were processed with Adobe Photoshop (version 8.0 and CS3) software. Images were adjusted for brightness and contrast, sized, saved as tiff files, and added to composites. When photomicrographs were depicted together with line drawings, tiff images were pasted into composite pictures in Adobe Illustrator or Macromedia Freehand MX (version 11. 0) and converted to tiff files.
Results
Enteric NSE and transgene expression
The neuron specific enolase (NSE) promoter was utilized to overexpress either noggin or BMP4 in the gut of transgenic animals in order to study, respectively, the effects of BMP antagonism and excess on enteric nervous system development (Chalazonitis et al., 2004; Gomes et al., 2003; Guha et al., 2004). The noggin transgene includes an IRES-GFP sequence. Demonstrating the native fluorescence or immunoreactivity of GFP thus enables transgene expression to be monitored. No expression of GFP was detected in the gut of transgenic mice at E13, although GFP fluorescence was seen in a subset of cells outside the bowel in the periaortic mesenchyme where prevertebral sympathetic ganglia and chromaffin bodies eventually form (Supplemental Fig. 2). GFP was abundantly expressed in the gut by E16, not only in the layer of the primordial ENS, but also in scattered epithelial cells (Supplemental Fig. 2). By P0, GFP fluorescence was exhibited by many cells in the subepithelial mesenchyme. Fetal enteric expression of the noggin transgene thus occurs more widely than would be expected if expression were entirely eutopic with NSE; however, distribution of cells expressing the transgene would enable transgenic noggin to affect development of neurons in both enteric plexuses. Enteric neurons were previously reported to be GFP-fluorescent at P11 and immunoblots also demonstrated increased noggin in the bowel at that age (Chalazonitis et al., 2004). These observations suggest that transgenic expression of noggin in the gut is likely to begin between E13 and E16 and to persist throughout later development. These observations are consistent with the demonstration in the present study that NSE expression increases abundantly and progressively in the developing bowel beginning at E14, peaks at about E16, and is maintained at lower levels thereafter (Fig. 1). Because the NSE-BMP4 construct did not have an IRES-EGFP sequence, it was not possible to use EGFP fluorescence to monitor expression of the transgene; however, because immunoblots at E16 reveal a higher than normal level of BMP4 (Gomes et al., 2003), it is likely that the time of expression of the NSE-BMP4 transgene is similar to that of NSE-noggin.
Figure 1.
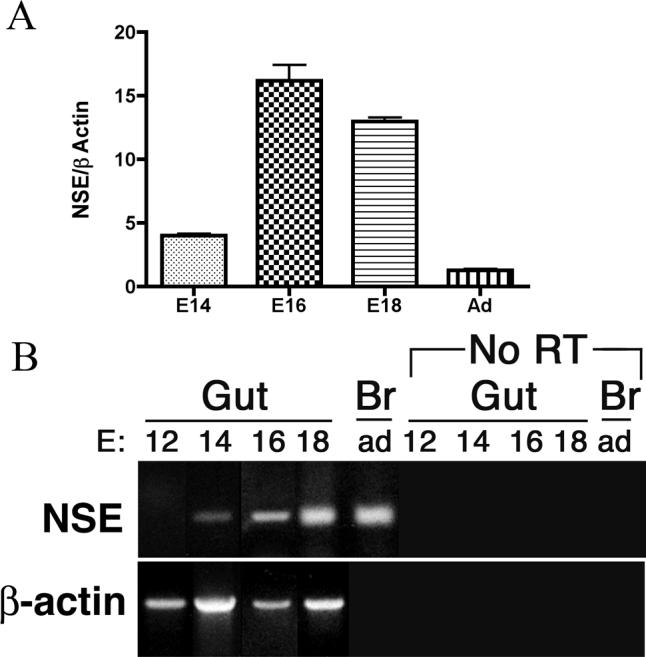
Transcription of NSE is developmentally regulated in developing mouse gut. A. Real-time PCR was used to quantify NSE transcripts in fetal mouse gut. NSE transcripts were detectable at E14 and increased significantly at E16−18 (p < 0.001). The relative abundance of NSE transcripts was lower in adult than fetal gut (p < 0.001). B. Semiquantitative RT-PCR. Transcripts encoding NSE were not detected at E12, but were present in the fetal bowel at E14, 16, and 18. The brain (Br) was investigated as a positive control. DNA contamination was minimal because no PCR product was obtained in the absence of RT.
Transgenic noggin overexpression increases the total number of neurons in the colon
The transgenic overexpression of noggin has previously been shown to increase the total number of neurons in the myenteric and submucosal plexuses of the small intestine (Chalazonitis et al., 2004). To determine whether this phenomenon also occurs in the colon, laminar preparations containing the colonic myenteric plexus were stained with cuprolinic blue and the density of neurons was determined (Fig. 2). The density of colonic neurons increased significantly in both Nog/+ and Nog/Nog mice, although the two groups of transgenic animals did not differ significantly from one another. These data, and those obtained previously in duodenum, jejunum, and ileum (Chalazonitis et al., 2004), were subsequently used to normalize the neuronal densities of individual subsets of neurons to those of all neurons in each region of the bowel in WT, Nog/+, and Nog/Nog mice.
Figure 2.
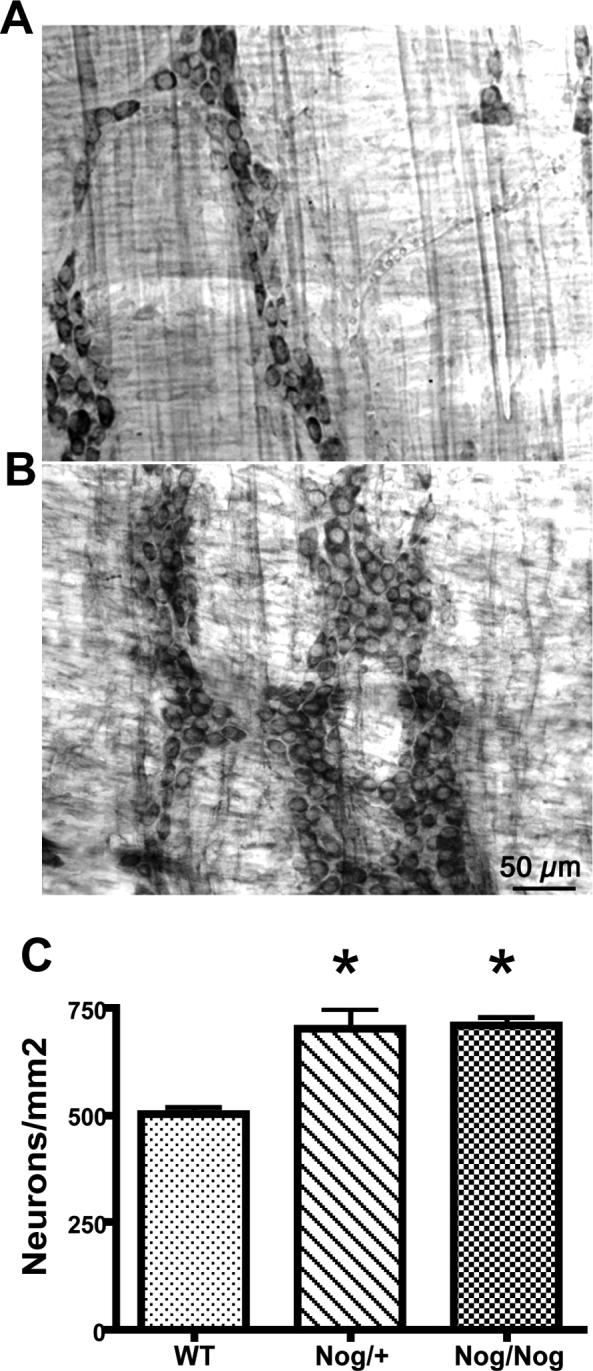
The total number of neurons is increased in the myenteric plexus of the colons of transgenic mice that overexpress noggin. Cuprolinic blue was used to visualize neurons. A. Wild-type. B. Nog/Nog. Bar = 50μm. C. The density of neurons is significantly increased in both Nog/+ and Nog/Nog mice (p < 0.001; n = 20 × 10 contiguous non-overlapping rectangular fields).
Effects of noggin over-expression on subpopulations of myenteric and submucosal neurons
The intestines of the NSE-noggin transgenic animals were examined to determine whether decreasing BMP signaling in the developing ENS affects the differentiation of specific subsets of enteric neuron. The densities in both myenteric (Table 3) and submucosal (Table 4) plexuses of different chemically identified subpopulations were determined and compared. Because the majority of enteric neurons are cholinergic, markers such as choline acetyltransferase and the vesicular acetylcholine transporter do not by themselves define subsets of enteric neurons and thus were not used for neuronal identification. Of the subsets examined, in WT mice, NOS- and calretinin-expressing neurons were most numerous in the myenteric plexus (Table 3), while those containing calretinin and CGRP were most numerous in the submucosal plexus (Table 4). Enteric serotonergic neurons were relatively uncommon in the WT myenteric plexus of the colon and jejunum (Table 3) and were not found in submucosal ganglia. In contrast to serotonergic neurons, enteric dopaminergic neurons, defined by their content of TH and DAT, were limited to the submucosal plexus (Table 4).
Table 3.
Density of chemically identified myenteric neuronal subtypes
|
Subset Marker |
Wild-Type |
Nog/+ |
Nog/Nog |
|---|---|---|---|
| Neurons/mm2 ± SE† | |||
| 5-HT | 0.5 ± 0.1 (16) | 2.0 ± 0.2 (60)* | 1.0 ± 0.2 (24)* |
| Calretinin | 47.3 ± 0.6 (15) | 79.0 ± 6.4 (21)* | 86.0 ± 5.0 (20)* |
| Calbindin | 13.6 ± 0.4 (90) | 18.1 ± 1.0 (60)* | 18.0 ± 0.9 (60)* |
| NOS | 63.6 ± 1.5 (60) | 69.7 ± 1.8 (40)* | 65.6 ± 1.8 (40) |
| GABA | 24.3 ± 2.3 (31) | 14.7 ± 1.3 (38)* | 23.0 ± 2.5 (13) |
| CGRP | 30.0 ± 1.2 (69) | 20.5 ± 1.0 (69)* | 18.9 ± 1.4 (50)* |
Differ significantly from wild-type (p < 0.05)
(number of fields × 10)
Table 4.
Density of chemically identified submucosal neuronal subtypes
|
Subset Marker |
Wild-Type |
Nog/+ |
Nog/Nog |
|---|---|---|---|
| Neurons/mm2 ± SE† | |||
| Calretinin | 60.3 ± 8.1 (15) | 82.8 ± 3.7 (20)* | 93.6 ± 5.9 (20)* |
| Calbindin | 3.3 ± 0.5 (31) | 6.6 ± 1.0 (20)* | 7.5 ± 0.5 (20)* |
| NOS | 4.0 ± 0.5 (50) | 2.7 ± 0.4 (40)* | 3.6 ± 0.3 (50)* |
| GABA | 28.1 ± 1.9 (39) | 21 ± 1.4 (40)* | 15.5 ± 1.4 (13)* |
| CGRP | 40 ± 1.0 (70) | 27.6 ± 1.3 (63)* | 23.8 ± 1.3 (50)* |
| TH | 18.6 ± 0.4 (81) | 15.2 ± 0.7 (70)* | 13.9 ± 0.6 (53)* |
| DAT | 21.5 ± 0.7 (40) | 14.0 ± 0.8 (10)* | 18.2 ± 0.7 (20)* |
Differ significantly from wild-type (p < 0.05)
(number of fields × 10)
Striking differences were observed in the effects of transgenic overexpression of noggin on the various subtypes of enteric neuron. In keeping with the overall increase in enteric neurons known to occur in Nog/+ and Nog/Nog mice, significant increases were found in the raw densities of 5-HT neurons in the myenteric plexus (Table 3; Fig. 3A, B) and calretinin (Tables 3, 4; Fig. 3 C, D, M, N), and calbindin neurons in both plexuses (Tables 3, 4). A small but significant increase was observed in the density of myenteric NOS neurons in Nog/+ mice (Table 3; Fig. 3E, F) but the density of NOS neurons decreased in the submucosal plexus in both Nog/+ and Nog/Nog animals (Table 4; Fig. 3O, P). In contrast, significant decreases were seen in the densities of GABA (Tables 3, 4; Fig. 3G, H, Q, R) and CGRP neurons (Tables 3, 4; Fig. 3I, J, S, T) in both plexuses and in the densities of TH and DAT neurons in the submucosal plexus (Table 4; Fig. 3K, L). The differences in the density of neurons in the myenteric and submucosal plexuses between WT, Nog/+, and Nog/Nog were normalized as % WT (Figs. 4A, B) to facilitate comparisons among groups and to allow the density of individual subsets of neurons in WT animals to serve as a control for the same subset in transgenic mice. In addition, because the overexpression of noggin significantly increases the overall density of neurons in the small intestine (Chalazonitis et al., 2004) and colon (Fig. 2), the data were also normalized to the total number of neurons in each plexus (Fig. 5A, B).
Figure 3.

Immunoreactivities identifying neuronal subsets in enteric plexuses that are found to be increased or decreased in noggin-over expressing mice compared to WT. Neurons marked by the immunoreactivities of 5-HT (A, B), calretinin (C, D; M, N), NOS (E, F; O, P), GABA (G, H; Q, R), CGRP (I, J; S, T), and TH (K, L) were visualized and counted in myenteric (A-J) and submucosal plexuses (K-T) of WT and noggin-overexpressing mice. 5-HT-immunoreactive neurons were found only in the myenteric plexus and TH-immunoreactive neurons were sufficiently abundant to count only in the submucosal plexus. The bars = 50 μm.
Figure 4.

Transgenic overexpression of noggin alters the relative densities of different phenotypes of enteric neuron. The density of each type of neuron, as a % of the density of the same type of neuron in WT mice, was determined in Nog/+ and Nog/Nog mice (see Tables 3 and 4). Densities of myenteric neurons identified by the immunoreactivities of 5-HT (A), calretinin (B), and calbindin (C) and NOS (D) neurons increased significantly (*), while GABA (E) [in Nog/+] and CGRP (F) neurons decreased significantly (†) in transgenic animals. Densities of submucosal neurons identified by the immunoreactivities of calretinin (G) and calbindin (H) increased significantly (*; p < 0.05), NOS (I) did not change significantly, while CGRP (J), GABA (K), TH (L), and DAT (M) neurons all decreased significantly (†; p < 0.05) in transgenic animals.
Figure 5.

Transgenic overexpression of noggin alters the relative proportions of different phenotypes of enteric neuron. The proportions, as a % of total neurons of different types of enteric neuron were compared, in each region of the bowel, in WT and noggin-overexpressing mice (Nog/+ and Nog/Nog); effects of the transgene were again phenotype-dependent. The proportion of myenteric neurons identified by the immunoreactivities of 5-HT (A) increased significantly (*; p < 0.05 Nog/+ only), calretinin (B), and calbindin (C) were now unchanged, while NOS (D) neurons (Nog/Nog only), GABA (E) and CGRP (F) neurons decreased significantly (†; p < 0.05) in transgenic animals. The proportion of submucosal neurons identified by the immunoreactivities of calretinin (G) did not change, calbindin (H) increased significantly (*; p < 0.05), while NOS (I), CGRP (J), GABA (K), TH (L), and DAT (M) neurons all decreased significantly (†; p < 0.05) in transgenic animals.
Myenteric Plexus
When plotted as a % of WT (Fig. 4A-D), four subtypes of neuron were seen to increase significantly as a result of the transgenic overexpression of noggin. These were neurons containing 5-HT, calretinin, calbindin, and NOS. Further normalization of the densities of these neurons to the total number of neurons in the myenteric plexus (Fig. 5A), obscured the increases of all except serotonergic neurons, the proportion of which in Nog/+ animals was still significantly higher than that of WT mice. These data suggest that the increment in calretinin- calbindin- or NOS-containing myenteric neurons is proportional to the general increase in total neurons induced by BMP antagonism. In contrast, the increase in serotonergic development in Nog/+ animals occurs to a greater extent than the overall enhancement of neuronal development, suggesting that the serotonergic phenotype is particularly sensitive to the antagonism of BMP signaling by the NSE-noggin transgene.
Although neurons containing NOS increased significantly in Nog/+ mice, there was not a corresponding increase in Nog/Nog animals (Fig. 4D). Interestingly, because the total number of neurons was increased by the transgenic overexpression of noggin, the proportion of myenteric neurons expressing NOS actually decreased significantly in Nog/Nog mice (Fig. 5D). In a more extreme manner, the development of myenteric neurons containing GABA or CGRP significantly decreased in transgenic mice, measured either as a % of WT (Fig. 4E, F) or, especially, as a proportion of total neurons (Fig. 5E, F). These observations for GABA and CGRP neurons are similar to those found previously for myenteric neurons expressing TrkC, which also decrease as % WT and % total neurons in Nog/+ and Nog/Nog mice (Chalazonitis et al., 2004).
Submucosal Plexus
As in the case of the myenteric plexus, the effects of the transgenic overexpression of noggin on the development of submucosal neurons were subset-specific. As a % of WT, the development of calretinin- and calbindin-containing neurons was increased in transgenic mice (Fig. 4G, H). When normalized to total neurons, however, the proportion of neurons expressing calretinin (Fig. 5G), did not change, suggesting that the increase in this subset reflected the overall noggin-induced increment in neuronal numbers. The proportion of total neurons containing calbindin, however, was increased in noggin-overexpressing animals, suggesting that the noggin-induced increase in this subset exceeded the overall enhancement of neuronal development (Fig. 5H). In contrast to neurons expressing calretinin or calbindin, both the numbers, as % WT (Fig. 4), and the proportions (Fig. 5) of submucosal neurons expressing NOS, GABA, CGRP, TH or DAT, were all decreased in mice that overexpressed noggin. Again, these observations for NOS, GABA, CGRP, TH and DAT neurons are similar to those found previously for submucosal neurons expressing TrkC, which also decrease as % WT and % total neurons in Nog/+ and Nog/Nog mice (Chalazonitis et al., 2004).
Timing of cell cycle exit of developing enteric neurons is related to their phenotype
Enteric serotonergic neuronal precursors are among the first and those of CGRP-containing neurons are among the last to exit the cell cycle in the developing ENS (Pham et al., 1991). Terminal mitoses of the precursors of serotonergic neurons can be detected as early as E8.5, peak at E10, and end at E14. Peak exit of CGRP-containing neurons from the cell cycle, in contrast, occurs at E17 and continues late into postnatal life. The transgenic overexpression of noggin strongly affected both the serotonergic and CGRP-containing neuronal subsets, but in opposite directions. Both the percent of WT and the proportion of 5-HT-immunoreactive neurons increased while those of CGRP-immunoreactive neurons decreased (see above Figs. 4; 5). These observations suggested that the type of effect that the transgenic antagonism of BMP signaling exerts might be influenced by the timing of the terminal mitoses of the crest-derived precursors that give rise to each subset of enteric neuron. To examine this hypothesis, cell cycle exit times were determined for myenteric and submucosal neurons expressing calretinin, NOS, GABA, TH, and TrkC immunoreactivities, none of which had previously been determined. Neurons labeled by BrdU during the final mitosis of their precursors were identified simultaneously with that of the neuronal markers. Cell cycle exit dates at each gestational age examined were plotted as histograms showing the % of each type of neuron labeled with BrdU (Fig. 6). For each of these chemically-defined subsets, myenteric neurons exited from the cell cycle significantly earlier than did their counterparts in the submucosal plexus (compare Fig. 6A-G with 6B-H). In the myenteric plexus (Fig. 6A), terminal mitoses of precursors that give rise to calretinin, NOS, and GABA-immunoreactive neurons occurred as early as E12.5 and peaked at E14.5, while in the submucosal plexus (Fig. 6B), very few of these types of neuron exited from the cell cycle as early as E12.5 and the peaks occurred at E17.5. Calretinin-immunoreactive neurons exited from the cell cycle earlier than did those expressing GABA or TrkC immunoreactivity. Significantly more calretinin than GABA or TrkC neurons exited the cell cycle prior to the peak timing of their terminal mitoses in both the myenteric (p < 0.01) (Fig. 6A) and submucosal (p < 0.04) plexuses (Fig. 6B).
Figure 6.

Timing of the exit from the cell cycle of precursors that give rise to neurons identified by the immunoreactivities of calbindin, NOS, GABA, and TrkC as determined by injecting BrdU into dated-pregnant mice. Neurons labeled by BrdU during the final mitosis of their precursors were identified by simultaneously demonstrating BrdU immunoreactivity with that of the neuronal markers. One measurement of the proportion of BrdU-labeled neurons was determined as the sum of BrdU-labeled neurons divided by the total number of neurons of a specific phenotype found in 10 scanned fields. Each measurement was then repeated 5−24 times. The numbers found in each measurement were then totaled and divided by the number of measurements to calculate the mean. Cell cycle exit dates are shown at the left and for each age a histogram is plotted showing the % of each type of neuron labeled with BrdU. A. E12.5 Myenteric plexus. B. E12.5 Submucosal plexus. C. E14.5 Myenteric plexus. D. E14.5 Submucosal plexus. E. E17.5 Myenteric plexus. F. E17.5 Submucosal plexus. G. P1 Myenteric plexus. H. P1 Submucosal plexus. I-L. BrdU labeling (magenta) of GABA-immunoreactive neurons (green) in the myenteric (MyP) and submucosal (SmP) plexuses: I. E17.5, myenteric plexus; J. E17.5, submucosal plexus; K. P1, myenteric plexus; L. P1, submucosal plexus . Arrows indicate doubly labeled cells. The bar = 50 μm.
Cell cycle exit times of the precursors of TH-immunoreactive neurons (data not illustrated), which continued through P3, were similar to those of neurons expressing GABA. These data are compatible with the idea that the transgenic antagonism of BMP signaling increases the numbers of neurons that exit early from the cell cycle but inhibits the generation of neurons that exit late. Terminal mitoses of enteric serotonergic neurons occur earlier than those of neurons expressing calretinin, NOS, GABA, CGRP, TH, or TrkC and thus increase more than the overall increment in myenteric neurons. In contrast, calretinin increases, but not proportionally more than the overall increment in neurons, while the late-exiting GABA, TH, CGRP, and TrkC neurons decrease.
Expression of 5-HT1A immunoreactivity was investigated simultaneously with that of GABA in myenteric and submucosal neurons because development of GABA-expressing neurons has been reported to be influenced by 5-HT through this receptor subtype (Allain et al., 2005). Such an effect could possibly occur in ENS development because 5-HT-expressing neurons develop early and GABA-expressing neurons develop late. 5-HT1A receptor immunoreactivity was found on 37.6 ± 7.8% of submucosal neurons and 27.4 ± 5.7% of those that were GABA-immunoreactive. No myenteric neurons were 5-HT1A-immunoreactive, although presynaptic 5-HT1A immunoreactivity was found on a substantial number of myenteric terminal axons.
Overexpression of BMP4 selectively increases the densities of TrkC- and TH-immunoreactive neurons
BMP4 was expressed in transgenic mice under the control of the NSE promoter in order to compare the effects of excess BMP4 on enteric neurogenesis to those of BMP antagonism by noggin. Neurons were stained with cuprolinic blue to determine their total density in both plexuses in the small intestine. The total density of neurons in mice overexpressing BMP4 did not differ significantly from that of their wild-type littermates in either the submucosal (Fig. 7A) or myenteric plexus (Fig. 7B). In contrast, the subset of neurons expressing TH increased significantly in the submucosal plexus (Fig. 7C-E; p < 0.03) and that expressing TrkC increased in both the submucosal (Fig. 7F-H; p < 0.05) and myenteric (Fig. 7I-K; p < 0.001) plexuses. 5-HT-immunoreactive neurons were examined in the myenteric plexus of the stomach and duodenum. The density of 5-HT immunoreactive neurons decreased significantly in both regions (from 9.5 ± 1.2 to 4.5 ± 0.5 neurons/mm2 in the duodenum [p < 0.005; n = 10] and from 5.1 ± 0.4 to 1.7 ± 0.3 neurons/mm2 in the stomach p < 0.001; n = 10]). These data suggest that the production of BMP4 in the wild-type gut (Chalazonitis et al., 2004; Roberts, 2000; Roberts et al., 1995; Roberts et al., 1998) exerts a maximal effect on enteric neurogenesis; however, BMP4 effects on phenotypic expression are not saturated in wild-type mice and can be altered by overexpressing BMP4 in transgenic mice. The effects of BMP4 overexpression tend to be the opposite of overexpression of noggin, at least for TH-, TrkC- and 5-HT-expressing neurons.
Figure 7.

Overexpression of BMP4 under the control of the NSE promoter increases the proportion of enteric neurons that express TH and TrkC. A. The overall density of neurons in the submucosal plexus in WT and BMP4-overexpressing mice is not significantly different. B. The overall density of neurons in the myenteric plexus in WT and BMP4-overexpressing mice is not significantly different. C. The proportion of submucosal neurons that expresses TH is significantly (* p < 0.03) greater in BMP4-overexpressing (n = 36) than WT mice (n = 32). D. TH immunoreactivity in the submucosal plexus of a WT mouse. E. TH immunoreactivity in the submucosal plexus of a BMP4-overexpressing mouse. F. TrkC immunoreactivity in the submucosal plexus of a WT mouse. G. TrkC immunoreactivity in the submucosal plexus of a BMP4-overexpressing mouse. H. The proportion of submucosal neurons that expresses TrkC is significantly (* p < 0.05) greater in BMP4-overexpressing than in WT mice. I. TrkC immunoreactivity in the myenteric plexus of a WT mouse. J. TrkC immunoreactivity in the myenteric plexus of a BMP4-overexpressing mouse. K. The proportion of myenteric neurons that expresses TrkC is significantly (** p < 0.01) greater in BMP4-overexpressing than in WT mice. The bars = 60 μm.
BMPs and NT-3 promote TH expression in vitro
The increase in TH-expressing neurons induced by the transgenic overexpression of BMP4 is consistent with the hypothesis that BMPs promote expression of the dopaminergic subset of enteric neurons. This hypothesis was tested in vitro by immunoselecting crest-derived precursors from the fetal gut and exposing them to BMP2, which stimulates the same receptors and exerts the same effects on enteric neurons as BMP4 (Chalazonitis et al., 2004). Because BMP2 and 4 also promote neuronal expression of TrkC and NT-3-dependence in vitro, the ability of NT-3 to affect development/survival of dopaminergic neurons was also investigated. Crest-derived cells were immunoselected from the bowel at E14. Exposure to BMP2 concentration-dependently increased the development/survival of cultured neurons expressing TH immunoreactivity (Fig 8). This effect was significantly greater at 20 ng/ml than at 2.0 ng/ml (p < 0.02; p < 0.01 vs. vehicle). Exposure to NT-3 (40 ng/ml) increased the development/survival of cultured neurons expressing TH (p < 0.05); however, the combination of NT-3 with 20 ng/ml BMP2 did not increase the development/survival of TH-expressing neurons beyond that produced by BMP2 alone. These data thus support the hypotheses that BMPs promote development/survival of enteric dopaminergic neurons and suggest that these neurons also respond to NT-3.
Figure 8.

BMP2 and NT-3 promote the in vitro development of TH-expressing (dopaminergic) enteric neurons. Crest-derived precursors were immunoselected from the fetal rat gut at E14 and cultured for 4 days. TH was immunostained simultaneously with MAP1b, which was employed as a neuronal marker. A-E. TH-immunoreactive neurons developing in cultures exposed only to vehicle; A. TH (magenta); B. MAP1b (green); C. Merge (coincident expression is white). B-F. TH-immunoreactive neurons developing in cultures exposed to BMP2 (20 ng/ml) + NT-3 (40 ng/ml). B. TH (magenta); D. MAP1b (green); F. Merge. G. BMP2 increases in a concentration-dependent manner the number of developing enteric neurons that express TH (* p < 0.05). NT-3 increases the number of developing enteric neurons that express TH (* p < 0.05); however, the combination of BMP2 + NT-3 does not promote more TH-immunoreactive neurons than that induced by BMP2 (20 ng/ml) alone. There were 4−7 cultures in each group.
Gastrointestinal motility is abnormal in noggin-overexpressing mice
Studies were carried out to examine functional consequences of the abnormal numbers and proportions of enteric neurons induced by noggin-antagonism of BMP signaling in transgenic mice. The body weights of noggin-overexpressing (22.7 ± 1.7g; n = 6) and WT animals (25.6 ± 1.4g; n = 5) did not differ significantly; nevertheless, stool frequency (Fig. 9A), wet weight (Fig. 9B), and water content (Fig. 9C) were all significantly higher in the noggin-overexpressing than in WT mice (Fig 9A). Total gastrointestinal transit time was measured by using bacillus stearothermophillus spores as a marker. Although the mean transit time was not significantly different from WT (10.2 ± 0.5 h) in the noggin-overexpressing animals (9.9 ± 1.0 h), the coefficient of variation of transit in noggin-overexpressing mice was more than twice (24.2%) that of WT controls (10.3%). The expulsion of spores in the remaining animal was highly irregular. Bacillus stearothermophillus spores initially passed through the GI tract of noggin-overexpressing animals very rapidly after gavage, but the remainder of the spores was then sometimes retained for long periods of time. The mean % of spores recovered at 3 hrs in the noggin-overexpressing group was 10.2 ± 6.9, while that in wild-type mice was 0.6 ± 0.4. These observations suggest that gastrointestinal transit tends to be faster than normal and irregular in noggin-expressing mice. The faster transit is consistent with the observation that stool water is increased; the decreased time available for water absorption would be expected to lead to more water in stool.
Figure 9.

The stool frequency, weight, and water content are all increased in mice that overexpress noggin under control of the NSE promoter. A. Stool frequency was determined by counting the number of fecal pellets passed during a 1-hr period of observation. Pellets collected from individual animals are illustrated above the bar graph in which the results are quantified (WT at the left; NSE-noggin mice at the right). B. Stool weight (obtained wet) for the pooled fecal pellets illustrated above. C. The stool water content was estimated from the difference between the wet and dry weights of stool. (** p < 0.01; * p < 0.05; WT n = 5; NSE-Nog n = 6).
Discussion
Noggin and BMP4 overexpression in transgenic mice were used to test the hypothesis that BMP signaling regulates both the ultimate size and the phenotypic diversity of the developing enteric nervous system. Because of the early effects of BMPs on development of the neural crest and the primordial gut, the NSE promoter was employed so that transgene expression would be delayed until after the onset of enteric neurogenesis. The NSE-noggin transgene was previously shown to increase the total number of neurons while decreasing TrkC expression in the ENS (Chalazonitis et al., 2004). Because the increased density of enteric neurons in mice that express the NSE-noggin transgene is accompanied by a decrease of about 25% in the density of enteric glia, it appears that the gain in neurogenesis occurs, at least to some extent, at the expense of glia (Chalazonitis et al., 2007). Here we show that overexpression of noggin enhances development of neuronal populations that normally exit the cell cycle early during enteric neurogenesis but decreases numbers of neurons that exit cell cycle later in development. Endogenous BMP signaling (Chalazonitis et al., 2004; Roberts, 2000; Roberts et al., 1995; Roberts et al., 1998) thus is essential both for limiting the size of the ENS and for promoting the generation of diverse neuronal phenotypes. Overexpression, however, of BMP4 did not alter the overall number of enteric neurons but selectively increased numbers of TrkC/NT-3-dependent neurons while reducing those that express 5-HT. This suggests that levels of endogenous BMP4 in the wild-type gut are sufficient to exert a maximal effect on limiting enteric neurogenesis, but that BMP4 effects on phenotypic expression are not saturated and can be altered by transgenic overexpression of BMP4.
The subtypes of enteric neuron that increased in noggin-overexpressing mice included those marked by immunoreactivities for 5-HT, calbindin, calretinin, and NOS (myenteric). The enhancement of serotonergic development in the myenteric and calbindin neurons in the submucosal plexus exceeded the overall increase in enteric neurons induced by noggin overexpression; thus, myenteric 5-HT and submucosal calbindin neurons increased both in number and proportion. In contrast, both the number and proportion of GABA, CGRP, and TrkC neurons decreased in both plexuses, and TH and DAT neurons decreased in the submucosal plexus. These observations demonstrate that endogenous BMP signaling regulates the relative proportions of different neuronal subpopulations in the ENS.
Because the precursors of different subtypes of enteric neurons leave the cell cycle at different gestational ages, and 5-HT neurons do so uniquely early (Blaugrund et al., 1996; Pham et al., 1991), we postulated that the variation in BMP effects on the development of different subtypes of enteric neuron might be related to the timing of their exit from the cell cycle. The cell cycle exit times were therefore determined for developing enteric calretinin, NOS, GABA, TH, and TrkC neurons, which had not previously been ascertained. Calretinin neurons were found to exit from the cell cycle early, although not quite as early as serotonergic neurons (E8 to E15) (Blaugrund et al., 1996; Pham et al., 1991), while GABA, TH, and TrkC neurons exited late. CGRP neurons, subsets of which are TrkC/NT-3-dependent (Chalazonitis et al., 2001), exited the cell cycle even later (Blaugrund et al., 1996; Pham et al., 1991). NOS neurons are known to be heterogeneous; some arise very early in development (Branchek and Gershon, 1989), while others, in which vasoactive intestinal peptide is colocalized with NOS (Sang and Young, 1996), appear late (Pham et al., 1991). These data are consistent with the idea that antagonizing BMP signaling by overexpressing noggin during the period of maximally intense enteric neurogenesis interferes with the development of those subtypes of enteric neuron (GABA, CGRP, TH/DAT, TrkC) that exit from the cell cycle late but enhances development of populations (5-HT, calretinin, and some myenteric NOS neurons) that normally exit early. The TrkC-expressing neurons do not represent a separate non-overlapping group. Some of the late-developing sets of enteric neuron, including those that express CGRP (Chalazonitis et al., 2001) and TH (unpublished data) are significantly reduced in mice that lack TrkC; however, early-born sets of enteric neuron arise prior to the onset of TrkC expression (Chalazonitis et al., 2004; Pham et al., 1991) and neurons in this category, such as serotonergic neurons (Blaugrund et al., 1996) are independent of TrkC and NT-3.
Enteric serotonergic neurons largely complete neurogenesis before E14 (Pham et al., 1991). The noggin transgene is not expressed in the E13 bowel although it is present by E16. NSE-directed noggin overexpression thus can overlap only with the tail end of the period of serotonergic neuronal birth. Still, the absolute numbers of serotonergic and total enteric neurons increase in noggin-overexpressing animals. Precursors of enteric serotonergic neurons probably thus do not totally escape the effects of noggin overexpression. The increased serotonergic development could be explained if BMP signaling in WT normally induces uncommitted precursors to develop as a non-serotonergic type of neuron; more serotonergic neurons would then arise when BMP signaling is antagonized. Alternatively, BMP signaling may be important in terminating the proliferation of the set of precursors from which serotonergic neurons arise; BMP antagonism would thus increase the ultimate number of serotonergic neurons by delaying exit of their progenitors from the cell cycle. Conversely, the decrease in serotonergic neurons that occurs in BMP4 over-expressing mice may reflect their premature exit from the cell cycle. Since BMP signaling is known to regulate both cell cycle exit and phenotypic expression in both central and peripheral nervous system progenitor cells (Guha et al., 2004; Mabie et al., 1997), these two alternatives need not be mutually exclusive and both types of BMP regulation may occur.
Although antagonism of BMP signaling increased the overall number of neurons, several neuronal populations (GABA, CGRP, TH/DAT, TrkC) were decreased in size. This indicates that the development and/or the specification of these neurons require exposure to an adequate level of BMP2 or 4. Since the neuronal subtypes that decrease are those that normally exit the cell cycle late, it is possible that the precursors of these neurons normally undergo a greater number of divisions than the precursors of earlier born neurons. It is conceivable that the generation of the ordered sequence of enteric neuronal progeny (Pham et al., 1991) occurs because the choice of neuronal phenotype depends on precursors undergoing an obligatory number of divisions prior to differentiation. In Drosophila, for example, two such distinct timers regulate neuroblast gene expression, one involved in the generation of early-born neurons, which requires cytokinesis, and another, involving the generation of late-born neurons, which is cell cycle independent (Grosskortenhaus et al., 2005; Harris, 2003; Pearson and Doe, 2003). BMPs regulate proliferation and exit from the cell cycle (Guha et al., 2004; Mabie et al., 1997); therefore, by affecting the number of divisions that enteric precursors undergo before exiting the cell cycle, BMPs could regulate the proportions of different types of neuron as well as neuron numbers. It is conceivable, therefore, that the alteration by noggin overexpression of the phenotypes of the terminally differentiated neurons produced in the ENS is, in part, the result of a change in the number of cycles that precede terminal differentiation.
The increase in the number of 5-HT, calbindin, calretinin, and myenteric NOS neurons is insufficient to account for the increase in the overall number of enteric neurons. It follows that the numbers of one or more still-to-be-identified classes of enteric neuron must also increase in noggin-overexpressing mice. These neurons are likely to be found in the heterogeneous class of cholinergic neurons that were not investigated in the current study. The majority of murine enteric neurons are cholinergic (Sang and Young, 1998); however, because acetylcholine is co-stored with other molecules in different enteric neurons, cholinergic markers do not define neuronal subtypes. Cholinergic neurons thus exit the cell cycle over a range of ages from early to late (Pham et al., 1991); nevertheless, the current observations predict that subsets of cholinergic neuron that exit early from the cell cycle will increase, while those that exit late will decrease in noggin overexpressing mice.
Overexpression of BMP4 selectively increased numbers of TrkC/NT-3-dependent neurons. Further, when applied in vitro to enteric neuronal precursors, BMPs2 and 4 specifically promote the development of TrkC-expressing neurons and, consequently, the dependence of neurons on NT-3 (Chalazonitis et al., 2004). These observations suggest that BMP signaling can regulate neuronal phenotypic expression independent of its effects on cell cycle regulation. We found in this study that the TrkC-expressing/NT-3-dependent group of neurons includes the dopaminergic neurons of the submucosal plexus, which express TH. Both BMP2 and NT-3 promote the in vitro development of these cells, and the number of TrkC, TH, and DAT neurons is reduced in the noggin-overexpressing mice. BMP signaling may thus specify the dopaminergic neuronal phenotype or at least promote its differentiation.
Neurons that develop early may also influence development of neurons that arise later. 5-HT, for example, is a growth factor for enteric neurons and affects development through the 5-HT2B (Fiorica-Howells et al., 2000) and 5-HT1A receptors (Azmitia, 2001a; b; Djavadian et al., 2005; Greaves et al., 2005). Development of GABA-expressing spinal cord neurons is delayed by the 5-HT1A-mediated effects of descending serotonergic inputs (Allain et al., 2005). This is of interest for the developing ENS because about a third of all submucosal neurons and about a quarter of those that express GABA are 5-HT1A-immunoreactive. The increase in proportion of enteric serotonergic neurons in noggin-overexpressing mice could thus amplify 5-HT-mediated effects on the development of the late-born submucosal population of enteric neurons.
It is striking that the alterations in gastrointestinal motility in the noggin transgenic mice were relatively minor despite the overproduction of enteric neurons and large changes in the proportions of different neuronal subsets. Stool frequency, weight, and water content were increased. In the noggin-overexpressing mice, the transit of spores from stomach to anus was initially rapid, but the ability of the transgenic gut to clear itself of the whole population spores was, in some of the animals slow, and in all highly irregular. The ENS abnormalities thus affect motility, although these effects do not prevent unstressed animals from surviving and gaining weight. Motility could also be affected by direct or indirect effects of interference with BMP signaling on non-neuronal cells. BMPs, for example, increase numbers of smooth muscle cells in both longitudinal and circular layers in the NSE-noggin mice (Chalazonitis et al. 2004). It is questionable, however, whether the abnormal ENS of noggin-overexpressing mice can adapt to perturbations, such as infection or inflammation, which occur during life in the wild. The current data, however, do reveal that the ENS exhibits an unexpected reserve or tolerance for a substantial degree of abnormal development. Conceivably, ENS defects, which do not give rise to an aganglionosis, occur during human development and contribute to subtle impairments in GI function.
Supplementary Material
Supplemental Fig. 1. Antibodies to p75NTR selectively demonstrate elements of the ENS in wild-type gut but do not react with any structures in the bowel of mice lacking p75NTR. A. Wild-type (WT) adult gut. M = mucosa; smp = submucosal plexus; mp = myenteric plexus. Note the immunoreactivity of all structures in the ENS, which obscures the distinction between neurons and glia. Nerve fibers in the circular muscle and mucosa are also p75NTR-immunoreactive. The marker = 40 μm. B. Gut of a transgenic mouse lacking p75NTR. There is no immunoreactivity. The marker = 40 μm.
Supplemental Fig. 2. Expression of the noggin-IRES-EGFP transgene in mice at E13, E16, and P0. A. E13. There is no EGFP fluorescence in the gut (g) . EGFP fluorescence can be detected in a subset of cells (arrows) in the mesenchyme near the dorsal aorta (da) in the region where prevertebral ganglia and chromaffin bodies ultimately form. The marker = 20 μm. B. E16. EGFP fluorescence is now abundant in the layer of the bowel that contains the developing ENS. Scattered cells, which might be enteroendocrine, are also seen in the epithelium. The marker = 10 μm. C. P0. EGFP fluorescence is seen in many cells that pack the subepithelial mesenchyme. The marker = 10 μm.
Other acknowledgements
We thank Valerie Boone and Wanda Sedlik for technical assistance. Critical reagents were supplied by Dr. Moses Chao, Skirball Institute, New York University, NY, NY (p75NTR antibodies), Drs. Barbara Hempstead and Pouneh Kermani, Weill-Cornell Medical College (TrkC antibodies and transgenic mice lacking the p75NTR extracellular domain), Dr. David Kaplan, Sick Kids Hospital, Toronto, Canada (TrkCin2 antibodies), Wyeth, Cambridge MA (human recombinant BMP2 or 4) and (Regeneron Pharmaceuticals, Tarrytown NY (human recombinant NT-3).
Support: This work was supported by National Institutes of Health grants DK58056 (AC), NS15547 (MDG) and NS 20013 and NS 20778 (JAK).
References
- Allain AE, Meyrand P, Branchereau P. Ontogenic changes of the spinal GABAergic cell population are controlled by the serotonin (5-HT) system: implication of 5-HT1 receptor family. J Neurosci. 2005;25(38):8714–8724. doi: 10.1523/JNEUROSCI.2398-05.2005. [DOI] [PMC free article] [PubMed] [Google Scholar]
- Anderson RB, Stewart AL, Young HM. Phenotypes of neural-crest-derived cells in vagal and sacral pathways. Cell Tissue Res. 2006;323(1):11–25. doi: 10.1007/s00441-005-0047-6. [DOI] [PubMed] [Google Scholar]
- Azmitia EC. Modern views on an ancient chemical: serotonin effects on cell proliferation, maturation, and apoptosis. Brain Res Bull. 2001a;56(5):413–424. doi: 10.1016/s0361-9230(01)00614-1. [DOI] [PubMed] [Google Scholar]
- Azmitia EC. Neuronal instability: implications for Rett's syndrome. Brain Dev. 2001b;23(Suppl 1):S1–S10. doi: 10.1016/s0387-7604(01)00368-0. [DOI] [PubMed] [Google Scholar]
- Bellier S, Da Silva NR, Aubin-Houzelstein G, Elbaz C, Vanderwinden JM, Panthier JJ. Accelerated intestinal transit in inbred mice with an increased number of interstitial cells of Cajal. Am J Physiol Gastrointest Liver Physiol. 2005;288(1):G151–158. doi: 10.1152/ajpgi.00048.2004. [DOI] [PubMed] [Google Scholar]
- Belliveau DJ, Krivko I, Kohn J, Lachance C, Pozniak C, Rusakov D, Kaplan D, Miller FD. NGF and neurotrophin-3 both activate TrkA on sympathetic neurons but differentially regulate survival and neuritogenesis. J Cell Biol. 1997;136(2):375–388. doi: 10.1083/jcb.136.2.375. [DOI] [PMC free article] [PubMed] [Google Scholar]
- Blaugrund E, Pham TD, Tennyson VM, Lo L, Sommer L, Anderson DJ, Gershon MD. Distinct subpopulations of enteric neuronal progenitors defined by time of development, sympathoadrenal lineage markers, and Mash-1-dependence. Development. 1996;122:309–320. doi: 10.1242/dev.122.1.309. [DOI] [PubMed] [Google Scholar]
- Branchek TA, Gershon MD. Time course of expression of neuropeptide Y, calcitonin gene related peptide, and NADPH diaphorase activity in neurons of the developing murine bowel and the appearance of 5-hydroxytryptamine in mucosal enterochromaffin cells. J Comp Neurol. 1989;285:262–273. doi: 10.1002/cne.902850208. [DOI] [PubMed] [Google Scholar]
- Burns AJ, Le Douarin NM. Enteric nervous system development: analysis of the selective developmental potentialities of vagal and sacral neural crest cells using quail-chick chimeras. Anat Rec. 2001;262(1):16–28. doi: 10.1002/1097-0185(20010101)262:1<16::AID-AR1007>3.0.CO;2-O. [DOI] [PubMed] [Google Scholar]
- Chalazonitis A, D'Autreaux F, Guha U, Pham TD, Faure C, Chen JJ, Roman D, Kan L, Rothman TP, Kessler JA, Gershon MD. Bone morphogenetic protein-2 and -4 limit the number of enteric neurons but promote development of a TrkC-expressing neurotrophin-3-dependent subset. J Neurosci. 2004;24(17):4266–4282. doi: 10.1523/JNEUROSCI.3688-03.2004. [DOI] [PMC free article] [PubMed] [Google Scholar]
- Chalazonitis A, d'Autréaux F, Roman D, Pham T, Guha U, Kessler JA, Gershon MD. Neuregulin1/GGF2 and BMP2 and 4 regulate gliogenesis in the enteric nervous system (ENS) Society for Neuroscience; San Diego, CA: 2007. p www.sfn.org.Program #546.541. [Google Scholar]
- Chalazonitis A, Pham T, Li ZS, Roman D, Guha U, Kessler JA, Gershon MD. Transgenic inhibition of bone morphogenetic protein (BMP) signaling interferes with development of specific subsets of enteric neurons. Society for Neuroscience; Washington, DC: 2005. online. www.sfn.org. p Program #830.818. [Google Scholar]
- Chalazonitis A, Pham TD, Rothman TP, DiStefano PS, Bothwell M, Blair-Flynn J, Tessarollo L, Gershon MD. Neurotrophin-3 is required for the survival-differentiation of subsets of developing enteric neurons. J Neurosci. 2001;21(15):5620–5636. doi: 10.1523/JNEUROSCI.21-15-05620.2001. [DOI] [PMC free article] [PubMed] [Google Scholar]
- Chalazonitis A, Rothman TP, Chen J, Vinson EN, MacLennan AJ, Gershon MD. Promotion of the development of enteric neurons and glia by neuropoietic cytokines: interactions with neurotrophin-3. Dev Biol. 1998a;198(2):343–365. [PubMed] [Google Scholar]
- Chalazonitis A, Rothman TP, Chen J-X, Gershon MD. Age-dependent differences in the effects of GDNF and NT-3 on the development of neurons and glia from neural crest-derived precursors immunoselected from the fetal rat gut: expression of GFRα−1 in vitro and in vivo. Dev Biol. 1998b;204:385–406. doi: 10.1006/dbio.1998.9090. [DOI] [PubMed] [Google Scholar]
- Djavadian RL, Wielkopolska E, Turlejski K. Postnatal treatment with NAN-190 but not with 5-HT1A receptor agonists retards growth of the rat brain. Int J Dev Neurosci. 2005;23(5):485–493. doi: 10.1016/j.ijdevneu.2005.02.001. [DOI] [PubMed] [Google Scholar]
- Do Thi NA, Saillour P, Ferrero L, Paunio T, Mallet J. Does neuronal expression of GDNF effectively protect dopaminergic neurons in a rat model of Parkinson's disease? Gene Ther. 2007;14(5):441–450. doi: 10.1038/sj.gt.3302844. [DOI] [PubMed] [Google Scholar]
- Donovan MJ, Hahn R, Tessarollo L, Hempstead BL. Identification of an essential non-neuronal function of neurotrophin-3 in mammalian cardiac development. Nature Genetics. 1996;14:210–213. doi: 10.1038/ng1096-210. [DOI] [PubMed] [Google Scholar]
- Druckenbrod NR, Epstein ML. The pattern of neural crest advance in the cecum and colon. Dev Biol. 2005;287(1):125–133. doi: 10.1016/j.ydbio.2005.08.040. [DOI] [PubMed] [Google Scholar]
- Durbec PL, Larsson-Blomberg LB, Schuchardt A, Costantini F, Pachnis V. Common origin and developmental dependence on c-ret of subsets of enteric and sympathetic neuroblasts. Development. 1996;122:349–358. doi: 10.1242/dev.122.1.349. [DOI] [PubMed] [Google Scholar]
- Faure C, Chalazonitis A, Rheaume C, Bouchard G, Sampathkumar SG, Yarema KJ, Gershon MD. Gangliogenesis in the enteric nervous system: roles of the polysialylation of the neural cell adhesion molecule and its regulation by bone morphogenetic protein-4. Dev Dyn. 2007;236(1):44–59. doi: 10.1002/dvdy.20943. [DOI] [PubMed] [Google Scholar]
- Fiorica-Howells E, Maroteaux L, Gershon MD. Serotonin and the 5-HT2B receptor in the development of enteric neurons. J Neurosci. 2000;20(1):294–305. doi: 10.1523/JNEUROSCI.20-01-00294.2000. [DOI] [PMC free article] [PubMed] [Google Scholar]
- Fu M, Vohra BP, Wind D, Heuckeroth RO. BMP signaling regulates murine enteric nervous system precursor migration, neurite fasciculation, and patterning via altered Ncam1 polysialic acid addition. Dev Biol. 2006;299(1):137–150. doi: 10.1016/j.ydbio.2006.07.016. [DOI] [PMC free article] [PubMed] [Google Scholar]
- Furness J. The Enteric Nervous System. Blackwell Publishing; Malden, MA: 2006. p. 288. [Google Scholar]
- Gershon MD. Nerves, reflexes, and the enteric nervous system: pathogenesis of the irritable bowel syndrome. J Clin Gastroenterol. 2005;39(5 Suppl):S184–193. doi: 10.1097/01.mcg.0000156403.37240.30. [DOI] [PubMed] [Google Scholar]
- Goldstein AM, Brewer KC, Doyle AM, Nagy N, Roberts DJ. BMP signaling is necessary for neural crest cell migration and ganglion formation in the enteric nervous system. Mech Dev. 2005;122(6):821–833. doi: 10.1016/j.mod.2005.03.003. [DOI] [PubMed] [Google Scholar]
- Gomes WA, Mehler MF, Kessler JA. Transgenic overexpression of BMP4 increases astroglial and decreases oligodendroglial lineage commitment. Dev Biol. 2003;255(1):164–177. doi: 10.1016/s0012-1606(02)00037-4. [DOI] [PubMed] [Google Scholar]
- Greaves JM, Russo SS, Azmitia EC. Gender-specific 5-HT1A receptor changes in BrdU nuclear labeling patterns in neonatal dentate gyrus. Brain Res Dev Brain Res. 2005;157(1):65–73. doi: 10.1016/j.devbrainres.2005.03.003. [DOI] [PubMed] [Google Scholar]
- Grosskortenhaus R, Pearson BJ, Marusich A, Doe CQ. Regulation of temporal identity transitions in Drosophila neuroblasts. Dev Cell. 2005;8(2):193–202. doi: 10.1016/j.devcel.2004.11.019. [DOI] [PubMed] [Google Scholar]
- Guha U, Mecklenburg L, Cowin P, Kan L, O'Guin WM, D'Vizio D, Pestell RG, Paus R, Kessler JA. Bone morphogenetic protein signaling regulates postnatal hair follicle differentiation and cycling. Am J Pathol. 2004;165(3):729–740. doi: 10.1016/S0002-9440(10)63336-6. [DOI] [PMC free article] [PubMed] [Google Scholar]
- Harris WA. Developmental biology: clocking the birth of neurons. Nature. 2003;425(6958):568–569. doi: 10.1038/425568a. [DOI] [PubMed] [Google Scholar]
- Hastrup H, Karlin A, Javitch JA. Symmetrical dimer of the human dopamine transporter revealed by cross-linking Cys-306 at the extracellular end of the sixth transmembrane segment. Proc Natl Acad Sci U S A. 2001;98(18):10055–10060. doi: 10.1073/pnas.181344298. [DOI] [PMC free article] [PubMed] [Google Scholar]
- Haycock JW, Waymire JC. Activating antibodies to tyrosine hydroxylase. J Biol Chem. 1982;257(16):9416–9423. [PubMed] [Google Scholar]
- Hearn CJ, Murphy M, Newgreen D. GDNF and ET-3 differentially modulate the numbers of avian enteric neural crest cells and enteric neurons in vitro. Dev Biol. 1998;197:93–105. doi: 10.1006/dbio.1998.8876. [DOI] [PubMed] [Google Scholar]
- Heinicke EA, Kiernan JA, Wijsman J. Specific, selective, and complete staining of neurons of the myenteric plexus, using Cuprolinic blue. J Neurosci Meth. 1987;21:45–54. doi: 10.1016/0165-0270(87)90101-4. [DOI] [PubMed] [Google Scholar]
- Huang PL, Dawson TM, Bredt DS, Snyder SH, Fishman MC. Targeted disruption of the neuronal nitric oxide synthase gene. Cell. 1993;75(7):1273–1286. doi: 10.1016/0092-8674(93)90615-w. [DOI] [PubMed] [Google Scholar]
- Huber G, Matus A. Immunocytochemical localization of microtubule-associated protein 1 in rat cerebellum using monoclonal antibodies. J Cell Biol. 1984;98(2):777–781. doi: 10.1083/jcb.98.2.777. [DOI] [PMC free article] [PubMed] [Google Scholar]
- Huber LJ, Chao MV. Mesenchymal and neuronal cell expression of the p75 neurotrophin gene occur by different mechanisms. Dev Biol. 1995;167:237–238. doi: 10.1006/dbio.1995.1019. [DOI] [PubMed] [Google Scholar]
- Ji F, Kanbara N, Obata K. GABA and histogenesis in fetal and neonatal mouse brain lacking both the isoforms of glutamic acid decarboxylase. Neurosci Res. 1999;33(3):187–194. doi: 10.1016/s0168-0102(99)00011-5. [DOI] [PubMed] [Google Scholar]
- Ji F, Obata K. Development of the GABA system in organotypic culture of hippocampal and cerebellar slices from a 67-kDa isoform of glutamic acid decarboxylase (GAD67)-deficient mice. Neurosci Res. 1999;33(3):233–237. doi: 10.1016/s0168-0102(99)00005-x. [DOI] [PubMed] [Google Scholar]
- Jiang Y, Liu M, Gershon MD. Netrins and DCC in the guidance of migrating neural crest-derived cells in the developing bowel and pancreas. Dev Biol. 2003;258(2):364–384. doi: 10.1016/s0012-1606(03)00136-2. [DOI] [PubMed] [Google Scholar]
- Kapur RP. Colonization of the murine hindgut by sacral crest-derived neural precursors: experimental support for an evolutionarily conserved model. Dev Biol. 2000;227(1):146–155. doi: 10.1006/dbio.2000.9886. [DOI] [PubMed] [Google Scholar]
- Karaosmanoglu T, Aygun B, Wade PR, Gershon MD. Regional differences in the number of neurons in the myenteric plexus of the guinea pig small intestine and colon: an evaluation of markers used to count neurons. Anat Rec. 1996;244:470–480. doi: 10.1002/(SICI)1097-0185(199604)244:4<470::AID-AR5>3.0.CO;2-Z. [DOI] [PubMed] [Google Scholar]
- Kia HK, Miquel MC, Brisorgueil MJ, Daval G, Riad M, El Mestikawy S, Hamon M, Verge D. Immunocytochemical localization of serotonin1A receptors in the rat central nervous system. J Comp Neurol. 1996;365(2):289–305. doi: 10.1002/(SICI)1096-9861(19960205)365:2<289::AID-CNE7>3.0.CO;2-1. [DOI] [PubMed] [Google Scholar]
- Kirchgessner AL, Liu M-T, Howard MJ, Gershon MD. Detection of the 5-HT1A receptor and 5-HT1A receptor mRNA in the rat bowel and pancreas: comparison with 5-HT1P receptors. J Comp Neurol. 1993;327:233–250. doi: 10.1002/cne.903270206. [DOI] [PubMed] [Google Scholar]
- Kirchgessner AL, Liu M-T, Raymond JR, Gershon MD. Identification of cells that express 5-HT1A receptors in the nervous systems of the bowel and pancreas. J Comp Neurol. 1996;364:439–455. doi: 10.1002/(SICI)1096-9861(19960115)364:3<439::AID-CNE5>3.0.CO;2-5. [DOI] [PubMed] [Google Scholar]
- Konings PN, Shahid M, van Alebeek C, Makkink WK, Stam NJ, Ruigt GS, Vanderheyden PM. Combined in situ hybridisation, northern blot analysis, and receptor binding studies in clones expressing different levels of the human 5-HT1A receptor. J Recept Signal Transduct Res. 1995;15(1−4):443–455. doi: 10.3109/10799899509045232. [DOI] [PubMed] [Google Scholar]
- Le Douarin NM, Teillet MA. The migration of neural crest cells to the wall of the digestive tract in avian embryo. J Embryol Exp Morphol. 1973;30:31–48. [PubMed] [Google Scholar]
- Le Douarin NM, Teillet MA. Experimental analysis of the migration and differentiation of neuroblasts of the autonomic nervous system and of neurectodermal mesenchymal derivatives, using a biological cell marking technique. Dev Biol. 1974;41:162–184. doi: 10.1016/0012-1606(74)90291-7. [DOI] [PubMed] [Google Scholar]
- Lee KF, Li E, Huber LJ, Landis SC, Sharpe AH, Chao MV, Jaenisch R. Targeted mutation of the gene encoding the low affinity NGF receptor p75 leads to deficits in the peripheral sensory nervous system. Cell. 1992;69(5):737–749. doi: 10.1016/0092-8674(92)90286-l. [DOI] [PubMed] [Google Scholar]
- Li ZS, Pham TD, Tamir H, Chen JJ, Gershon MD. Enteric dopaminergic neurons: definition, developmental lineage, and effects of extrinsic denervation. J Neurosci. 2004;24(6):1330–1339. doi: 10.1523/JNEUROSCI.3982-03.2004. [DOI] [PMC free article] [PubMed] [Google Scholar]
- Li ZS, Schmauss C, Cuenca A, Ratcliffe E, Gershon MD. Physiological modulation of intestinal motility by enteric dopaminergic neurons and the D2 receptor: analysis of dopamine receptor expression, location, development, and function in wild-type and knock-out mice. J Neurosci. 2006;26(10):2798–2807. doi: 10.1523/JNEUROSCI.4720-05.2006. [DOI] [PMC free article] [PubMed] [Google Scholar]
- Mabie PC, Mehler MF, Marmur R, Papavasiliou A, Song Q, Kessler JA. Bone morphogenetic proteins induce astroglial differentiation of oligodendroglial-astroglial progenitor cells. J Neurosci. 1997;17(11):4112–4120. doi: 10.1523/JNEUROSCI.17-11-04112.1997. [DOI] [PMC free article] [PubMed] [Google Scholar]
- Pearson BJ, Doe CQ. Regulation of neuroblast competence in Drosophila. Nature. 2003;425(6958):624–628. doi: 10.1038/nature01910. [DOI] [PubMed] [Google Scholar]
- Pham TD, Gershon MD, Rothman TP. Time of origin of neurons in the murine enteric nervous system. J Comp Neurol. 1991;314:789–798. doi: 10.1002/cne.903140411. [DOI] [PubMed] [Google Scholar]
- Phillips RJ, Hargrave SL, Rhodes BS, Zopf DA, Powley TL. Quantification of neurons in the myenteric plexus: an evaluation of putative pan-neuronal markers. J Neurosci Methods. 2004;133(1−2):99–107. doi: 10.1016/j.jneumeth.2003.10.004. [DOI] [PubMed] [Google Scholar]
- Pisano JM, Colon-Hastings F, Birren SJ. Postmigratory enteric and sympathetic neural precursors share common, developmentally regulated, responses to BMP2. Dev Biol. 2000;227(1):1–11. doi: 10.1006/dbio.2000.9876. [DOI] [PubMed] [Google Scholar]
- Pomeranz HD, Rothman TP, Chalazonitis A, Tennyson VM, Gershon MD. Neural crest-derived cells isolated from the gut by immunoselection develop neuronal and glial phenotypes when cultured on laminin. Dev Biol. 1993;156:341–361. doi: 10.1006/dbio.1993.1082. [DOI] [PubMed] [Google Scholar]
- Pomeranz HD, Rothman TP, Gershon MD. Colonization of the post-umbilical bowel by cells derived from the sacral neural crest: direct tracing of cell migration using an intercalating probe and a replication-deficient retrovirus. Development. 1991;111:647–655. doi: 10.1242/dev.111.3.647. [DOI] [PubMed] [Google Scholar]
- Renfroe JB, Chronister RB, Haycock JW, Waymire JC. The localization of tyrosine hydroxylase-like immunoreactivity in the central nervous system: methodological considerations. Brain Res Bull. 1984;13(1):109–126. doi: 10.1016/0361-9230(84)90013-3. [DOI] [PubMed] [Google Scholar]
- Riederer B, Cohen R, Matus A. MAP5: a novel brain microtubule-associated protein under strong developmental regulation. J Neurocytol. 1986;15(6):763–775. doi: 10.1007/BF01625193. [DOI] [PubMed] [Google Scholar]
- Roberts DJ. Molecular mechanisms of development of the gastrointestinal tract. Dev Dyn. 2000;219(2):109–120. doi: 10.1002/1097-0177(2000)9999:9999<::aid-dvdy1047>3.3.co;2-y. [DOI] [PubMed] [Google Scholar]
- Roberts DJ, Johnson RL, Burke AC, Nelson CE, Morgan BA, Tabin C. Sonic hedgehog is an endodermal signal inducing Bmp-4 and Hox genes during induction and regionalization of the chick hindgut. Development. 1995;121:3163–3174. doi: 10.1242/dev.121.10.3163. [DOI] [PubMed] [Google Scholar]
- Roberts DJ, Smith DM, Goff DJ, Tabin CJ. Epithelial-mesenchymal signaling during the regionalization of the chick gut. Development. 1998;125(15):2791–2801. doi: 10.1242/dev.125.15.2791. [DOI] [PubMed] [Google Scholar]
- Sang Q, Young H. Chemical coding of neurons in the myenteric plexus and external muscle of the small and large intestine of the mouse. Cell Tiss Res. 1996;284:39–53. doi: 10.1007/s004410050565. [DOI] [PubMed] [Google Scholar]
- Sang Q, Young HM. The identification and chemical coding of cholinergic neurons in the small and large intestine of the mouse. Anat Rec. 1998;251(2):185–199. doi: 10.1002/(SICI)1097-0185(199806)251:2<185::AID-AR6>3.0.CO;2-Y. [DOI] [PubMed] [Google Scholar]
- Serbedzija GN, Burgan S, Fraser SE, Bronner-Fraser M. Vital dye labeling demonstrates a sacral neural crest contribution to the enteric nervous system of chick and mouse embryos. Development. 1991;111:857–866. doi: 10.1242/dev.111.4.857. [DOI] [PubMed] [Google Scholar]
- Skoff AM, Adler JE. Nerve growth factor regulates substance P in adult sensory neurons through both TrkA and p75 receptors. Exp Neurol. 2006;197(2):430–436. doi: 10.1016/j.expneurol.2005.10.006. [DOI] [PubMed] [Google Scholar]
- Uchida Y. Overexpression of full-length but not N-terminal truncated isoform of microtubule-associated protein (MAP) 1B accelerates apoptosis of cultured cortical neurons. J Biol Chem. 2003;278(1):366–371. doi: 10.1074/jbc.M210091200. [DOI] [PubMed] [Google Scholar]
- Varga AC, Wrana JL. The disparate role of BMP in stem cell biology. Oncogene. 2005;24(37):5713–5721. doi: 10.1038/sj.onc.1208919. [DOI] [PubMed] [Google Scholar]
- Winsky L, Montpied P, Arai R, Martin BM, Jacobowitz DM. Calretinin distribution in the thalamus of the rat: immunohistochemical and in situ hybridization histochemical analyses. Neuroscience. 1992;50(1):181–196. doi: 10.1016/0306-4522(92)90391-e. [DOI] [PubMed] [Google Scholar]
- Yntema CL, Hammond WS. The origin of intrinsic ganglia of trunk viscera from vagal neural crest in the chick embryo. J Comp Neurol. 1954;101:515–542. doi: 10.1002/cne.901010212. [DOI] [PubMed] [Google Scholar]
- Young H, Hearn CJ, Ciampoli D, Southwell BR, Brunet JF, Newgreen DF. A single rostrocaudal colonization of the rodent intestine by enteric neuron precursors is revealed by the expression of Phox2B, Ret, and p75 and by explants grown under the kidney capsule or in organ culture. Dev Biol. 1998;202:67–84. doi: 10.1006/dbio.1998.8987. [DOI] [PubMed] [Google Scholar]
- Young HM, Bergner AJ, Anderson RB, Enomoto H, Milbrandt J, Newgreen DF, Whitington PM. Dynamics of neural crest-derived cell migration in the embryonic mouse gut. Dev Biol. 2004;270(2):455–473. doi: 10.1016/j.ydbio.2004.03.015. [DOI] [PubMed] [Google Scholar]
- Zhang L, Hoff AO, Wimalawansa SJ, Cote GJ, Gagel RF, Westlund KN. Arthritic calcitonin/alpha calcitonin gene-related peptide knockout mice have reduced nociceptive hypersensitivity. Pain. 2001;89(2−3):265–273. doi: 10.1016/s0304-3959(00)00378-x. [DOI] [PubMed] [Google Scholar]
- Ziller C, Dupin E, Brazeau P, Paulin D, Le Douarin NM. Early segregation of a neuronal precursor cell line in the neural crest as revealed by culture in a chemically defined medium. Cell. 1983;32:627–638. doi: 10.1016/0092-8674(83)90482-8. [DOI] [PubMed] [Google Scholar]
Associated Data
This section collects any data citations, data availability statements, or supplementary materials included in this article.
Supplementary Materials
Supplemental Fig. 1. Antibodies to p75NTR selectively demonstrate elements of the ENS in wild-type gut but do not react with any structures in the bowel of mice lacking p75NTR. A. Wild-type (WT) adult gut. M = mucosa; smp = submucosal plexus; mp = myenteric plexus. Note the immunoreactivity of all structures in the ENS, which obscures the distinction between neurons and glia. Nerve fibers in the circular muscle and mucosa are also p75NTR-immunoreactive. The marker = 40 μm. B. Gut of a transgenic mouse lacking p75NTR. There is no immunoreactivity. The marker = 40 μm.
Supplemental Fig. 2. Expression of the noggin-IRES-EGFP transgene in mice at E13, E16, and P0. A. E13. There is no EGFP fluorescence in the gut (g) . EGFP fluorescence can be detected in a subset of cells (arrows) in the mesenchyme near the dorsal aorta (da) in the region where prevertebral ganglia and chromaffin bodies ultimately form. The marker = 20 μm. B. E16. EGFP fluorescence is now abundant in the layer of the bowel that contains the developing ENS. Scattered cells, which might be enteroendocrine, are also seen in the epithelium. The marker = 10 μm. C. P0. EGFP fluorescence is seen in many cells that pack the subepithelial mesenchyme. The marker = 10 μm.