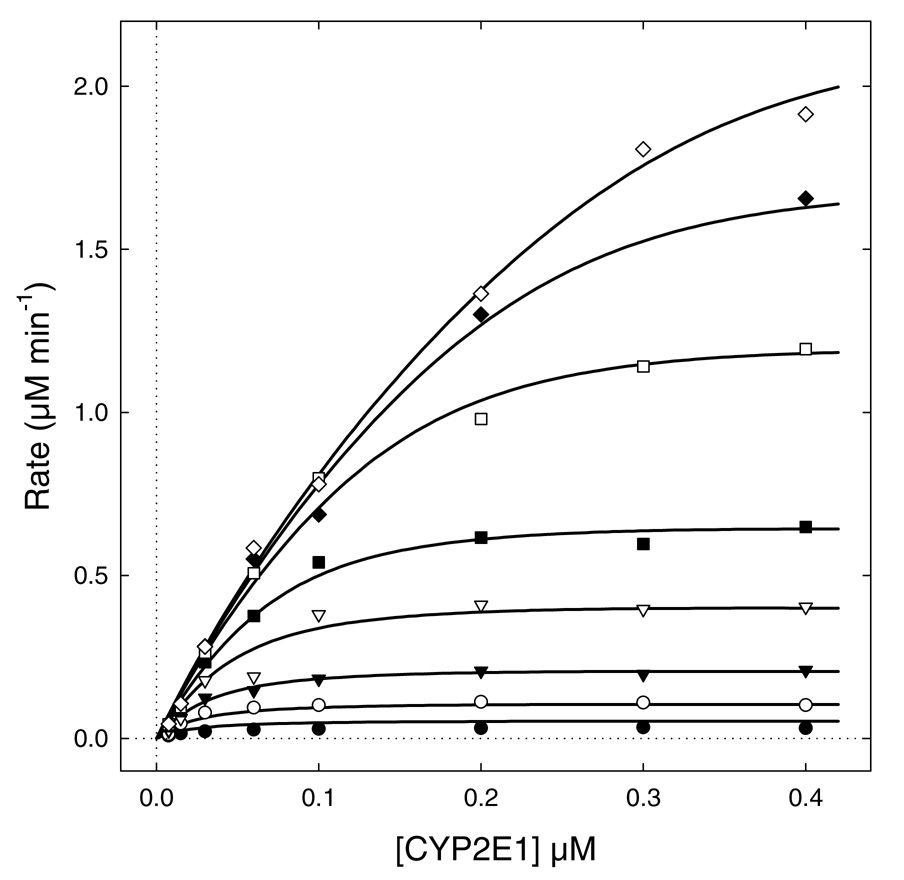
FIGURE 4.
The pooled experimental data and the best-fit model (smooth curves) for Model #14c defined in Table 3 and Scheme 2. P450 2E1 was varied from 7.5 nM to 400 nM. CPR concentrations were as follows: 7.5 nM (filled circles); 15 nM (filled circles); 30 nM (filled triangles); 60 nM (open triangles); 100 nM (filled squares); 200 nM (open squares); 300 nM (filled diamonds); 400 nM (open diamonds). The best-fit model is represented by the system of simultaneous nonlinear algebraic Eqns (3–6), automatically derived and numerically solved by the software package DynaFit (23).

