

A common difficulty encountered by surgeons is the broad range of treatment choices available for a surgical condition. Observational studies and small randomized trials account for a large proportion of the surgical literature. There are many reasons for this, but the clinician is left with evidence from small studies on which to base his or her practice. How can a surgeon know from a study that reports no difference between treatments whether the study group was too small to detect any difference?
This question refers to whether a study is adequately powered to answer the research question. We provide a succinct overview of power issues in surgical studies to better equip clinicians to assess the adequacy of a study's sample size and to determine whether its conclusions are valid and can be used to guide surgical practice.
Clinical scenario
You are in the surgeon's lounge and have just booked a laparoscopic appendectomy on the emergency list. A surgical colleague overhears you and asks why you are doing the surgery laparoscopically. You explain that you have observed fewer wound complications and less pain postoperatively with this technique. Your colleague, who does open appendectomies, says that there's no evidence to support that but then gets called back into the operating room. You decide that while you're waiting for your patient you'll review the latest literature on the topic.
Literature search
To search for evidence relevant to your clinical scenario, you search PubMed (www.pubmed.gov), using “open,” “laparoscopic” and “appendectomy” as keywords derived from your clinical question. Your search yields 407 articles. For further restriction, you use the “limits” function, selecting “randomized controlled trials,” “humans” and “English.” This returns 41 articles. Scanning through articles, you decide to narrow your search by focusing on postoperative pain as the outcome of interest. You find a study by Ignacio and colleagues1 that was published in 2003 and involved 52 patients randomly assigned to open or laparoscopic appendectomy.
Summary of the appraised article
The sample size of 52 in this particular article was calculated by determining that a 25% difference in postoperative pain, lost days of work and operating room costs was clinically relevant. After open (n = 26) and laparoscopic (n = 26) appendectomy, a large dressing covering the entire abdomen was used, and a second blinded surgical team assumed postoperative care. A blinded study nurse interviewed patients weekly to assess pain and ability to return to work. Results showed that the mean length of stay in hospital was 21.5 hours for the laparoscopic group, which was not statistically different from that in the open appendectomy group (29.2 h). Postoperative pain at days 1 and 7 was not statistically different between the groups. Using a visual analog pain scale, patients in the laparoscopic group scored a mean of 3.5 (standard deviation [SD] 2.1), whereas patients in the open appendectomy group scored a mean of 4.0 (SD 1.9) on day 1; scores on day 7 were 2.1 (SD 2.2) and 2.1 (SD 2.3), respectively. Return to work was a mean of 9.5 days after surgery in the open appendectomy group and 11.0 days in the laparoscopic group (not significantly different). The authors concluded that there was no advantage to laparoscopic appendectomy, and the cost for this procedure is $600 more per patient.1
You are surprised at the results, but wonder about the study's small sample size. Also, the authors' decision to use a 25% difference in outcomes for calculating the sample size piques your interest.
These questions directly relate to power and sample size. This is central to determining whether the results of studies showing no difference between 2 treatments are valid and clinically useful.
Assessing the methodology of the article
Prior to addressing whether a study is adequately powered, its methodology needs to be assessed to ensure that no errors in design and execution that could invalidate its results have occurred. The following assessment demonstrates the key questions that need to be answered.
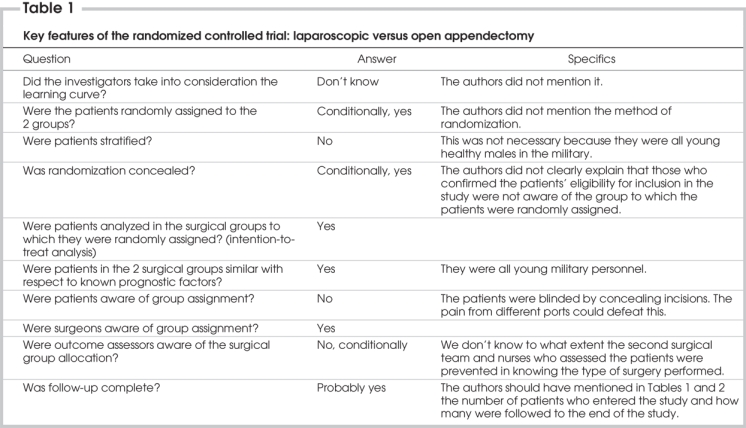
Because the intent of this article is to explore issues related to power, the appraisal of the article as a randomized controlled trial (RCT) in surgery is brief. The key features of this RCT are summarized in Table 1. Readers interested in the appraisal of published RCTs in surgery are directed to a more specific article of this series, titled “Users' guide to the surgical literature: how to assess a randomized controlled trial (RCT) in surgery.”2 A more recent article discusses the difficulties of performing an RCT in surgery.3
Table 1
Concept of power and sample size calculations
Although there were some limitations in the methodology, you are satisfied that an assessment of the power of the study can be undertaken. The following provides a brief overview of the concept of power and the closely related concept of sample size.
Understanding the direct relation between power and sample size is critical in interpreting the conclusions drawn from a study. Research studies are designed with predefined objectives. A study may be designed to estimate the prevalence or incidence of a disease in a specified population with a given degree of precision or to detect a difference between the 2 groups (e.g., 2 surgical treatments, surgical and nonsurgical treatments or a new drug and placebo in surgical patients). The most common design in clinical research is the comparative study. The study ought to have an appropriate statistical power to detect the minimum clinically important difference (MCID). The MCID is a key concept in evaluating study results; it specifies the minimum clinically important difference that would lead a clinician to change his or her practice. The MCID is often different from the statistically significant differences in results observed and reported in studies; however, this is the value that is clinically relevant.
The power of a study is defined as “the ability of a study to detect an effect or association if one really exists in a wider population.”4 In clinical research, we conduct studies on a subset of the patient population because it is not possible to measure a characteristic in the entire population. Therefore, whenever a statistical inference is made from a sample, it is subject to some error. Investigators attempt to reduce systematic errors with an appropriate design so that only random errors remain. Possible random errors to be considered before making inferences about the population under study are type I and type II errors. To make a statistical inference, 2 hypotheses must be set: the null hypothesis (there is no difference) and alternate hypothesis (there is a difference). The probability of reaching a statistically significant result if in truth there is no difference or of rejecting the null hypothesis when it should have been accepted is denoted as α, or the probability of type I error. It is similar to the false positive result of a clinical test. The probability of not detecting a minimum clinically important difference if in truth there is a difference or of accepting the null hypothesis when it should have been rejected is denoted as β, or the probability of type II error. It is similar to the false negative result of a clinical test. Properly, investigators choose the size of α and β before gathering data so that their choices cannot be influenced by study results. The typical value of α is set at 0.05, and the significance level (p value) determined from the data is compared with α to decide on statistical significance. The typical value of β is set at 0.2. The power of the study, its complement, is 1-β and is commonly reported as a percentage. Studies are often designed so that the chance of detecting a difference is 80% with a 20% (β = 0.2) chance of missing the MCID. This power value is arbitrary, and higher power is preferable to limit the chance of applying false negative (type II error) results. The belief is that the consequences of a false positive (type I error) claim are more serious than those of a false negative (type II error) claim, so investigators make more stringent efforts to prevent this type of error.5
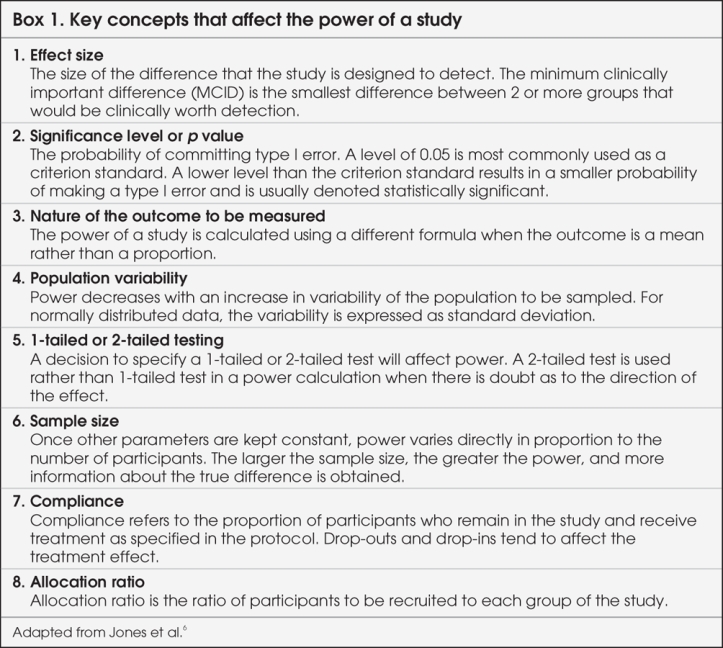
Understanding how the concept of power is used in planning a study is helpful, and factors that influence the power of a study are summarized in Box 1.6 This will help illustrate how power can be used in evaluating the results of a study. At the stage of planning a research study, investigators calculate the minimum required sample size by fixing the chances of a type I or II error, strength of association and population variability. This is called “power analysis,” and the purpose is to establish what sample size is needed to assure a given level of power (minimum 80%) to detect a specified effect size. From this, one can see that for a study to have greater power (smaller β or fewer type II errors), a larger sample size is needed. Sample size, in turn, is dependent on the magnitude of effect, or effect size. If the effect size is small, larger numbers of participants are required for the differences to be detected. Determining the sample size, therefore, requires the MCID in effect size to be agreed upon by the investigators. It is important for readers to remember that the point of powering a study is not to find a statistically significant difference between groups, but rather to find clinically important or relevant differences.
Box 1.
Reporting a detailed sample size calculation is important because it can demonstrate how well the study was planned and could increase our confidence in the investigators' appropriate handling of methodologic issues. Investigators could simply come up with a smaller sample size by deciding on a larger difference associated with 80% power, when in fact the real difference with the same sample size would have less than 80% power. The appropriate method is to use the observed differences from clinical consensus, experimental evidence or previous studies as a guide to the true difference as well as to estimate statistical variability.7,8 Determining whether this effect is within the neighbourhood of a MCID is based on an individual surgeon's judgment. For example, one surgeon may think the MCID for changing treatment is 5%, whereas another surgeon may require a more than 10% difference in outcome measures to warrant use of a proposed treatment. Therefore, it is important that a panel composed of experts, stakeholders and patients decide what is considered a MCID.
The role of statistical power and sample size calculation is straightforward and is most useful when implemented during the design of a study. Researchers should always determine the power of their studies before they begin. Often this step is overlooked, and studies are conducted without a power calculation. Subsequently, when the studies do not demonstrate the results of interest, researchers sometimes perform post hoc power analyses.9–11 Such belated power analyses are not recommended, because it is often possible to manipulate the numbers and argue that a negative study had enough power. Such post hoc power analyses are not the same as readers' evaluations of power in the articles they read, the rationale being that readers' analyses aim to determine whether the study is powered to detect variations of clinical relevance. Again, this emphasizes the difference between statistically significant differences and the MCID, which is the focus for clinicians. Online sites exist that can help with sample size and power calculations. Two such sites are included in Appendix 1.
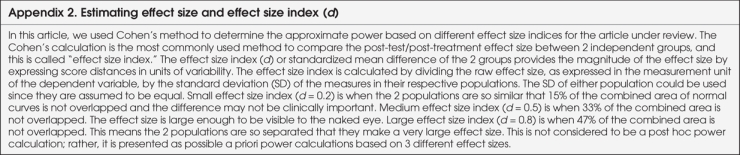
A new concept that can help with power calculations is the effect size index (d), or standardized mean difference of the 2 groups, which provides the magnitude of the effect size. In 1998, Cohen12 described a method to estimate approximate power for small, medium and large effect size indices based on sample size and the type of statistical analysis used to summarize the outcomes. The rationale for using the effect size index versus raw effect size is to appropriately evaluate the effect size post-treatment. Full details on Cohen's method are provided in Appendix 2. In summary, Cohen divided the effect size index into small, medium and large effect size indices, based on the degree of overlap of the 2 study populations. In this article, we have used Cohen's method to determine the approximate power based on different effect size indices for the article under review. We use the term “effect size” when referring to the difference between raw scores in a priori power analysis; we use the term “effect size index” when referring to the difference between scores standardized by pooled variance in the power evaluation of the article.
Applying power and sample size concepts to the article
Now having a clear idea regarding the power of a study, you can apply these concepts to the laparoscopic versus open appendectomy article. The first question to ask is whether the authors have specified an a priori power analysis or sample size calculation in the article. This question seems deceptively easy to answer; however, there are a number of qualifying factors to consider. Using the cited article, one must assume that an α of 0.05 and β of 0.2 for a 2-sided test were used for sample size calculation because this information was not reported in the article. The effect size was fixed at 25%, whereas the variance (standard deviation) for the end-points of postoperative pain, lost workdays and operating room cost were not provided. The sample size calculation should be based on the primary outcome. Since the investigators of the appraised study did not specify the primary outcome, we chose postoperative pain to answer your clinical question.
Next, is the effect size a clinically relevant difference that would result in a change in patient management? An improvement of 25% in postoperative pain seems clinically relevant for this study. Measurement of this variable becomes critical because, if the instrument is not sensitive enough to detect differences, actual differences may not be identified. The authors' use of the visual analog scale and the fact that they did not assess the need for pain medication may explain why no differences were noted.
Finally, is the effect size precise? As previously mentioned, estimating a larger effect size will allow a smaller sample size to be calculated for the same power of 80%. In reviewing the literature comparing laparoscopic and open appendectomy results, the effect size for postoperative pain is less than 25%. The most recent meta-analysis published in the Cochrane Database shows that postoperative pain decreased by 10% in patients who had laparoscopic appendectomies.13,14 This difference in effect size may explain the nonsignificant findings owing to the smaller sample size that was calculated.
To assess the power of the article reviewed, we determined approximate power based on the number of patients and on the effect size index described by Cohen,12 using Minitab version 14.0 (Minitab Inc.). The full power calculation is provided in Appendix 3. For brevity, the results are included here. As mentioned, postoperative pain on day 1, as assessed on the visual analog scale, was the primary outcome. We assigned the commonly accepted values to α and β: α = 0.05 and β = 0.2. The mean postoperative pain score at day 1 was 3.5 in the laparoscopic group and 4.0 in the open surgery group. Pooled standard deviation was 2.0. The effect size index for these results is the difference in mean scores divided by the standard deviation: (4.0 – 3.5) / 2.0 = 0.25. Now, let's consider the difference of 25% that the authors said they were interested in at the beginning of the study. Given that the mean score in the open surgery group was 4.0, an a priori effect size of 25% would have corresponded to a mean score of 3.0 in the laparoscopic group. The effect size index based on these data for the a priori effect size of 25% is 0.5 ([4.0 – 3.0] / 2.0 = 0.5). Therefore, the actual effect size index (0.25) is smaller than the effect size index based on a priori data (0.50).
We can use Figure 1 to determine the power that the study had to detect the effect size with 26 patients in each group. For a mean difference of 0.5 in the postoperative pain score, the study had power of 14%; for a mean difference of 1.0 (25% reduction), Figure 1 shows that the power of this study would have been 42%. For a mean difference of 1.6 in the postoperative pain score, the power would have been 80%. Further details of power and effect size index are found in Appendix 3.

FFIG. 1. Power analysis for small, medium and large effect size index.
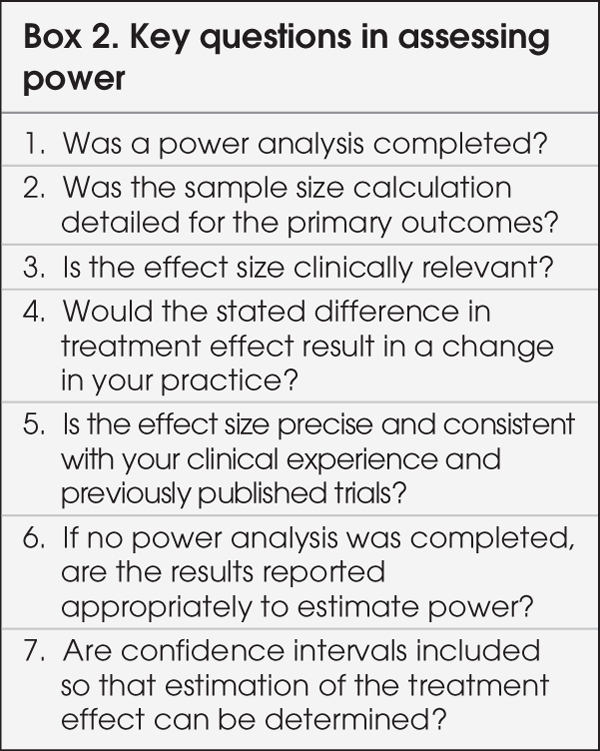
Figure 1 is quite useful in evaluating the power of a study. The 3 curves show the plot of sample size versus study power for 3 different effect size indices. Once the effect size index of interest is determined for any treatment result from a study, a clinician can use a graph such as Figure 1 to estimate the associated power. Figure 1 also shows that the sample size needed per group would be 252 for the effect size index of 0.25, 64 for an index of 0.5 and 26 for an index of 0.8. Clearly, the smaller the treatment effects of interest, the larger the studies need to be to detect them. The decision about what is a clinically relevant difference or MCID needs to be based on clinical importance rather than just statistical significance or a convenient sample size. Key questions to ask when assessing the power of a study are listed in Box 2.
Box 2.
The study reviewed was underpowered to answer the question about postoperative pain in patients who had laparoscopic versus open appendectomies.
Discussion
Returning to the clinical scenario, you now know that this RCT comparing laparoscopic and open appendectomies contains some methodologic issues and effect size estimates that decrease its applicability. You could, for example, hope that all your patients would be young and fit with minimal comorbidities; however, in reality, your patients have numerous comorbidities and widely varied levels of physical fitness. This highlights the importance of assessing a study's methodology, since you now feel that for young, fit men, certain outcomes will be similar irrespective of surgical technique. However, with respect to patients that you treat on call for acute appendicitis, the study results for postoperative pain do not, in your opinion, apply to this heterogeneous group. In addition, using the effect size index to review the effect size in more detail has shown the study to be underpowered. The sample size is about one-tenth of what is required, resulting in a power of 42%, rather than the minimum 80%.
The MCID in the study reviewed was fixed at 25%, but other studies with larger sample sizes found significant differences of 10%–25%.13,14 Just as each surgeon needs to determine clinically important differences, each surgeon also needs to determine the outcomes most relevant to his or her practice. In the clinical scenario, you as the surgeon felt that in addition to the primary outcome of postoperative pain, one advantage of laparoscopic surgery was of decreased wound infection rates. Wound infection rates were not reported in the present study. To answer this question, another search of the literature would need to be done in addition to a similar analysis examining wound infections. With respect to the other outcome of interest to you, postoperative pain, the study found no differences between the study groups based on the visual analog scores. This is different from other studies that found statistically significant differences in pain scores of about 10%.13,14 The disparity is likely related to the difference in sample size used in the studies as well as the variance of the effect. The fact that one study can find a nonsignificant difference in postoperative pain, whereas another study finds a statistically significant difference of the same variable highlights to you the critical role of assessing a study's power and sample size calculations. In addition, the impact of effect size on the calculations is clearly evident: using precise effect size estimates can dramatically impact the results of a study. Different effect sizes can, as demonstrated in the included power calculation, have a large impact on the sample size required. The point is not to enroll many patients to attain statistical significance; rather, it is to be more practical and choose the clinically relevant effect (MCID) size for sample size calculation. In the power calculation that was undertaken, the sample size required was 252 patients (for a small effect size index), rather than 26 patients per group because the difference detected between groups was smaller than was deemed clinically relevant by the authors, who had chosen a medium rather than small effect size.
Conclusion
You now have an answer for your surgical colleague who is exiting his operating room. With the methodologic and statistical limitations of the study, you feel that the conclusion that laparoscopic appendectomy has no advantages is unjustified owing to the fact that the study is underpowered because of an inadequate sample size. You plan to further assess the literature for your other outcomes of interest, keeping in mind your MCIDs, which determine what clinically relevant effect sizes need to be included in the studies you evaluate. Keeping in mind the crucial effect that a priori power calculation, MCID and sample size have on study calculations and results, you now have a better approach to evaluating a study's methods, results and conclusions.
Appendix 1.

Appendix 2.
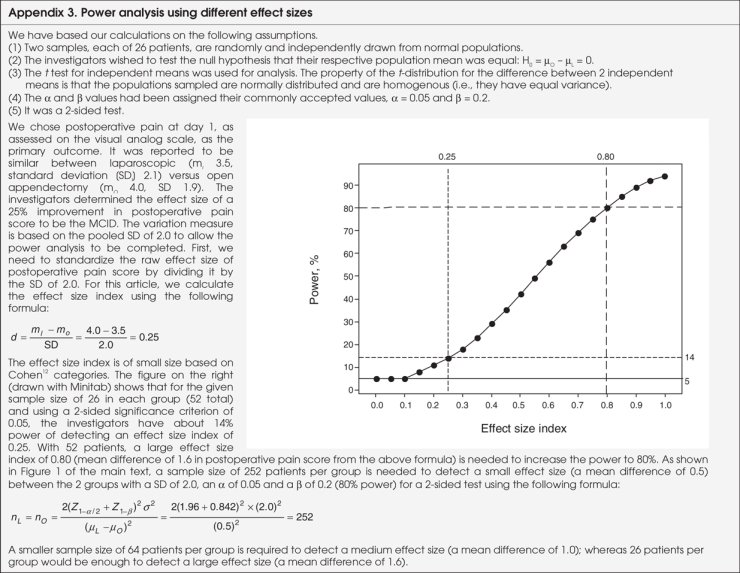
Appendix 3.
The Evidence-Based Surgery Working Group members include: Stuart Archibald, MD;*†‡ Frank Baillie, MD;†‡¶ Mohit Bhandari, MD, MSc;†‡§¶ Margherita Cadeddu, MD;*†‡ Claudio Cinà, MD, MSc;†‡§¶ Sylvie Cornacchi, MSc;†‡ Forough Farrokhyar, MPhil, PhD;†‡§¶ Anna Garnett, BA;†‡ Charles H. Goldsmith, PhD;‡§ Ted Haines, MD, MSc;‡§ Robert Hansebout, MD, MSc;* †‡ Carolyn Levis, MD, MSc;*†‡ Marko Simunovic, MD, MPH;†‡§¶ Ved Tandan, MD, MSc;*†‡§ Achilleas Thoma, MD, MSc,*†‡§ from *St. Joseph's Healthcare, the †Department of Surgery, the ‡Surgical Outcomes Research Centre, the §Department of Clinical Epidemiology and Biostatistics, McMaster University, and ¶Hamilton Health Sciences, Hamilton, Ont.
Contributors: Drs. Cadeddu, Farrokhyar, Thoma, Haines and Goldsmith designed the study and wrote the article. Drs. Cadeddu and Farrokhyar and Ms. Garnett acquired the data, which Drs. Cadeddu, Farrokhyar, Thoma and Goldsmith analyzed. Drs. Cadeddu, Farrokhyar, Haines and Goldsmith and Ms. Garnett reviewed the article. All authors gave final approval for publication.
Competing interests: None declared.
Accepted for publication Jul. 9, 2008
Correspondence to: Dr. M.O. Cadeddu, St. Joseph's Healthcare, 50 Charlton Ave. E, Rm. G810, Hamilton ON L8N 4A6; fax 905 522-0864; mocadeddu@yahoo.com
References
- 1.Ignacio RC, Burke R, Spencer D, et al. Laparoscopic vs open appendectomy. Surg Endosc 2004;18:334-7. [DOI] [PubMed]
- 2.Thoma A, Farrokhyar F, Bhandari M, et al.; Evidence-Based Surgery Working Group. Users guide to the surgical literature: how to assess a randomized controlled trial in surgery. Can J Surg 2004;47:200-8. [PMC free article] [PubMed]
- 3.Thoma A. Challenges in creating a good randomized controlled trial in hand surgery. Clin Plast Surg 2005;32:563-73. [DOI] [PubMed]
- 4.Last JM. A dictionary of epidemiology. 4th ed. New York: Oxford University Press; 2001.
- 5.Cashen LH, Geiger SW. Statistical power and the testing of null hypotheses: a review of contemporary management research and recommendations for future studies. Organ Res Methods 2004;7:151-67.
- 6.Jones M, Gebski V, Onslow M, et al. Statistical power in stuttering research: a tutorial. J Speech Lang Hear Res 2002;45: 243-55. [DOI] [PubMed]
- 7.Goodman SN, Berlin JA. The use of predicted confidence intervals when planning experiments and the misuse of power when interpreting results. Ann Intern Med 1994;121:200-6. [DOI] [PubMed]
- 8.Halpern SD, Karlawish JH, Berlin JA. The continuing unethical conduct of underpowered clinical trials. JAMA 2002;288: 358-62. [DOI] [PubMed]
- 9.Moher D, Dulberg CS, Wells GA. Statistical power, sample size, and their reporting in randomized controlled trials. JAMA 1994;272:122-4. [PubMed]
- 10.Freiman JA, Chalmers TC, Smith H Jr, et al. The importance of beta, the type II error and sample size in the design and interpretation of the randomized control trial. Survey of 71 “negative” trials. N Engl J Med 1978;299:690-4. [DOI] [PubMed]
- 11.Altman DG, Moher D, Schulz KF. Peer review of statistics in medical research. Reporting power calculations is important. BMJ 2002;325:491. [PubMed]
- 12.Cohen J. Statistical power analysis for the behavioural sciences. 2nd ed. Hillsdale (NJ): Lawrence Erlbaum Associates; 1988.
- 13.Sauerland S, Lefering R, Neugebauer EAM. Laparoscopic versus open surgery for suspected appendicitis. Cochrane Database Syst Rev 2004;(4). CD001546. [DOI] [PubMed]
- 14.Temple LKF, Litwin DE, McLeod RS. A meta-analysis of laparoscopic versus open appendectomy in patients suspected of having acute appendicitis. Can J Surg 1999; 42:377-83. [PMC free article] [PubMed]