
Figure 2.
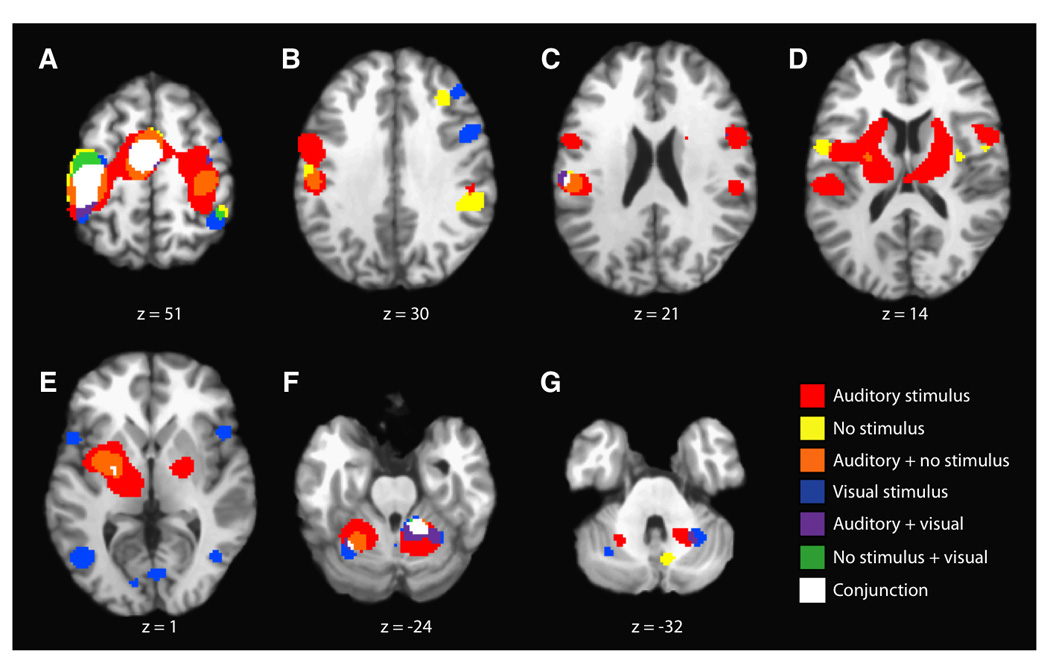
ALE Results Segregated By Pacing Stimuli. Representative axial slices are shown (P < 0.05; FDR corrected) for finger tapping activations when paced by auditory, visual, or no stimuli. Overlap (conjunction) among all three task variations is seen in the same executive regions noted for the main effects in Figure 1, except the basal ganglia. The results also show many clusters of concordance that are unique to one or more of the task variations.