Abstract
A series of metal-varied model complexes [ML(SC6F5)] (where L = hydrotris(3,5-diisopropyl-1-pyrazolyl)borate and M = Mn, Fe, Co, Ni, Cu, and Zn) related to blue copper proteins has been studied by the combination of absorption, MCD, resonance Raman, and S K-edge X-ray absorption spectroscopies. Density functional calculations have been used to characterize these complexes and calculate their spectra. The observed variations in geometry, spectra, and bond energies are interpreted in terms of changes in the nature of metal-ligand bonding interactions. The metal 3d-ligand orbital interaction, which contributes to the covalent bonding in these complexes, becomes stronger in going from Mn(II) to Co(II) (the σ contribution) and to Cu(II) (the π contribution). This change in the covalency results from the increased effective nuclear charge of the metal atom in going from Mn(II) to Zn(II) and the change in the 3d orbital populations (d5→d10). Ionic bonding also plays an important role in determining the overall strength of the ML+-SC6F5− interaction. However, there is a compensating effect: as the covalent contribution to the metal-ligand bonding increases, the ionic contribution decreases. These results provide insight into the Irving-Williams series, where it is found that the bonding of the ligand being replaced by the thiolate makes a major contribution to the observed order of stability constants over the series of metal ions.
1. Introduction
Blue copper centers, a critical component in biological electron transfer, represent some of the most well characterized active sites in metalloproteins.1 The Cu site geometry is trigonally distorted tetrahedral with three equatorial ligands, including two Cu-N(His) bonds at 2.0 Å, a short Cu-S(Cys) bond at 2.1 Å, and an axial S(Met) ligand with a long Cu-S bond at ~2.8 Å. The unique spectral features of the blue copper center include an intense, low energy charge transfer band at 16700 cm−1 (ε ~5000 M−1 cm−1) in the absorption and a two-fold reduced parallel hyperfine coupling relative to that of normal copper centers. These spectral features are due to a highly covalent Cu-thiolate bond, which facilitates long distance electron transfer.1–3 Many metal-substituted blue copper centers have been made in the protein active sites, which further probe the nature of the metal-thiolate interaction.4–13 Additionally, they provide insight into the specific assignments of the spectral features of the blue copper sites.
Recently, a series of metal-varied model complexes [ML(SC6F5)] (where L = HB(3,6-iPr2pz)3− and M2+ = Mn, Fe, Co, Ni, Cu, and Zn), related to blue copper sites in proteins, has been synthesized and crystallographically characterized.14,15 The metal atoms in [ML(SC6F5)] have a distorted tetrahedral coordination sphere, with one M-S bond, two short equatorial M-N bonds, and the elongated axial M-N bond. The absorption features of these complexes are similar to those of the corresponding metal-substituted sites in the proteins and the complexes show interesting systematic changes in the metal-thiolate bond lengths. The M-S bond length changes in the following order: Mn(II) > Fe(II) > Co(II) > Ni(II) > Cu(II) < Zn(II), which follows the Irving-Williams series for the stability constants.16–18 Thus, these model complexes provide a systematic way to explore the different contributions to metal-thiolate bonding.
In this study, the combination of absorption, magnetic circular dichroism (MCD), resonance Raman (rR), and S K-edge X-ray absorption spectroscopies coupled with density functional calculations has been used to characterize the electronic structure of these complexes. Absorption and MCD spectroscopies provide a method to distinguish the ligand field transitions from the charge transfer transitions, which provides insights into covalent interactions at the metal center. S K-edge XAS provides an estimate of the sulfur contribution in the ground state wave function, and the relative effective nuclear charges () at the metal atoms. DFT calculations evaluate the trends in bond energies, force constants, and bond orders and correlate these to the nature of bonding between the metal ion and the thiolate ligand. In particular, this study examines the origin of the properties of the metal-ligand bonds for first-row transition metal complexes, the relative contributions of different covalent and ionic interactions to bonding, and how they produce the Irving-Williams series.
2. Experimental Section
2.1. Samples
The [ML(SC6F5)] complexes (where M2+ = Mn, Fe, Co, Ni, Cu, and Zn, and L = HB(3,6-iPr2pz)3−) were synthesized as described.15 All reagents were of highest grade commercially available and were used without further purification. The crystal structures of these complexes have been reported previously.15 Preparation and handling of these complexes were done under argon atmosphere in a Schlenk line.
2.2. UV-Vis Electronic Absorption and Magnetic Circular Dichroism Spectroscopy
Room temperature (in cyclohexane solution) UV-Vis absorption spectra were recorded with a JASCO V-570 spectrophotometer using a quartz cell (0.10 cm in path length) in 200–1700 nm region. Low temperature (~10 K) absorption spectra were obtained using a computer interfaced Cary-500 spectrophotometer modified to accommodate a Janis Research Super Vari-Temp cryogenic dewar mounted in the light path. Low temperature MCD was recorded using two Jasco spectropolarimeters. Each is equipped with a modified sample compartment to accommodate focusing optics and an Oxford Instruments SM4000-7T super conducting magnet/cryostat. This arrangement allows data collection at temperatures from 1.6–290 K and fields up to 7 T. A Jasco J810 spectropolarimeter operating with an S-20 photomultiplier tube was used to access the visible and UV spectral region. A Jasco J200 spectropolarimeter operating with a liquid nitrogen cooled InSb detector was used for the near-IR region. The PMT detector requires magnetic shielding. Solid samples (mulls) for spectroscopy were prepared by grinding microcrystalline material into powders with a mortar and pestle and then adding mulling agents (polydimethylsiloxane (Aldrich) or Florolube (Wilmad)). This mixture was uniformly spread between quartz disks (Haraeus-Amersil), loaded into copper MCD cells and promptly frozen. Depolarization of the light by the MCD samples was monitored by their effect on the CD signal of nickel (+)-tartarate placed before and after the sample. In all cases the depolarization was less than 5%. Simultaneous Gaussian fitting of the low temperature absorption and MCD spectra was performed using the Peak-Fit program (Jandel).
2.3. Resonance Raman
Raman spectra were recorded using a Princeton Instruments, liquid nitrogen cooled, back illuminated CCD camera mounted on a Spex 1877 0.6 m triple spectrometer, equipped with holographic grating blazed at 1200, 1800, or 2400 grooves mm−1. Kr ion (Innova 90C-K) and Ar ion (Sabre-25/7) visible and UV laser lines were used as variable energy excitation sources. Powder samples were loaded in 2 mm EPR tubes and stored in liquid nitrogen. Spectra were obtained in a ~135° backscattering geometry with 20–30 mW incident power. Raman scattering resolution and accuracy are ~2 cm−1. Raman peak profile intensities were determined relative to the 995 cm−1 band of solid Na2SO4.
2.4. X-ray Absorption Measurements and Data Reduction
The S K-edge data were measured using the 54-pole wiggler beam line 6-2 in high magnetic field mode of 10 kG, with a Ni-coated harmonic rejection mirror and a fully tuned Si(111) double crystal monochromator under ring conditions of 3 GeV and 60–100 mA. Details of the optimization of this beam line for low energy absorption studies and the experimental setup have been described previously.19 S K-edge measurements were performed at ~4 °C. The solid samples were ground finely under dry Ar atmosphere in a glove bag and dispersed as thinly as possible on Mylar tape to minimize the possibility of self absorption effects. The temperature was regulated using a cryostat which utilizes a cooled N2 gas through a channel in the sample holder. The sulfur fluorescence data were measured using an ionization chamber as a detector.20,21
The S K-edge data presented here were averaged and processed as described in an earlier publication.22 Energy calibration was achieved using the S K-edge spectra of Na2S2O3.5H2O run at intervals between sample scans. The maximum of the first transition was assigned to 2472.02 eV. A smooth polynomial background of order 2 was fit to the pre-edge and subtracted from the entire spectrum. Normalization was achieved by fitting a linear polynomial to the post-edge and normalizing the edge jump to 1 at 2540 eV.23 The area under the pre-edge peak was quantified by fitting the data using the program EDG-FIT.24 The pre-edge and rising edge features were modeled with pseudo-Voigt line-shapes with a fixed 1:1 Lorentzian:Gaussian ratio. The reported intensity and half-width value are based on an average over similar fits that accurately modeled the data and their 2nd derivatives. In addition to the error resulting from the background correction and fitting procedure (ca. 2%), normalization procedures can introduce error (ca. 3%) in the total pre-edge peak areas.
2.5. Computational Details
Density Functional Theory (DFT) spin-unrestricted calculations were performed using the Gaussian 03 program (Revision C.01).25 Optimized geometries were calculated using the BP8626,27 and B3LYP28 exchange-correlation functionals with the triple-zeta 6-311+G(d) basis set.
The B3LYP functional with the triple-zeta 6-311+G(d) basis set was found to reproduce the crystal structure of the model complexes at acceptable computational cost, and was used for further calculations. Total energies were obtained by single-point calculations on these structures also with the B3LYP method but with the larger 6-311+G(3df) basis set. This improvement of the basis set did not change the energies by more than 2 kcal mol−1. Tight SCF convergence criteria (10−8 a.u.) were used for all calculations. The complexes were modeled without isopropyl groups on the pyrazole ligands; their retention was found to have no substantial effect on the geometric or electronic structure. In addition, Cs symmetry was retained with a mirror plane containing the metal and axial pyrazole. Frequency calculations were performed to ensure that the stationary points were minima and to calculate infra-red (IR) spectra. Calculated IR frequencies and intensities were transformed with the SWizard program29 into simulated IR spectra using Lorentzian functions with half-widths of 15 cm−1. High-spin electron configurations were used based on the experimental data15 and wave function stability calculations were performed (using the stable keyword in Gaussian 03) to confirm that in each case the calculated wave function corresponded to the ground state.
The interaction energy, Eo, between the metal-pyrazolyl fragment (in the high spin state) and the ligand X has been calculated as energy of the interaction:
where X= SC6F5 and F (the fluoride is included for comparison to the thiolate in the discussion of the Irving-Williams series, Section 5.4). In order to account for the basis set superposition error (BSSE), the counterpoise correction30 has been evaluated and its magnitude was very small (<1 kcal mol−1) in the B3LYP/6-311+G(3df) calculations.
The bonding energy is partitioned into several contributions. First, Eo is separated into two components Eprep and Eint:
Eprep is the preparation (deformation) energy31 necessary to transform the ML+ and X− fragments from their equilibrium geometries and electronic ground states to the those in the complexes:
In this series, Eprep(ML+) and Eprep(SC6F5−) is 5.3–10.3 kcal mol−1 and 1.0–1.2 kcal mol−1 respectively (Eprep(F−) is 0 kcal mol−1). Eint is the interaction energy between the ML+ and X− fragments. This interaction energy can be further divided into two major components which can be interpreted in a physically meaningful way:
Here Ecov is the covalent or orbital interaction energy (including the exchange repulsion energy32–34) and Eionic is the electrostatic interaction energy. The latter is estimated as a sum of electrostatic interactions between charges, qNPA, of atoms from the two molecular fragments, ML+ and X−:
The charge distribution in this calculation corresponds to the one in the complex, as opposed to the electrostatic interaction energy from the energy decomposition analysis of Kitaura-Morokuma32,33 and Ziegler35,36 which is calculated with undistorted charge distributions corresponding to those in the isolated fragments. Since the metal-pyrazolyl fragment and the X ligand carry the opposite charges, the electrostatic interaction is attractive (Eionic < 0) in the [ML(X)] complexes.
Molecular orbital (MO) compositions and the overlap populations between molecular fragments were calculated using the AOMix program.37,38 Atomic charges and spin densities were calculated using the Mulliken39–42 and natural43 population analysis methods (MPA and NPA respectively) as implemented in Gaussian 03 and the Löwdin population analysis (LPA)44 as implemented in AOMix-L.37 The analysis of the MO compositions in terms of fragment molecular orbitals, construction of orbital interaction diagrams, and the charge decomposition analysis45,46 was performed using AOMix-CDA.37 Single-point B3LYP calculations with the TZVP basis set47 for all atoms were used for molecular orbital analysis.
To analyze the chemical bonding between the molecular fragments A and B, the Mayer bond orders48–51 BAB were obtained using AOMix-L:
where P and Ps are the density and spin-density matrices respectively (P = Pα + Pβ; Ps = Pα − Pβ), Pα and Pβ are α- and β-electron density matrices, and S is the overlap matrix. The symmetry-adapted combinations of basis functions were used to allow a decomposition of the bond orders according to irreducible representations of Cs point group:
This analysis delivers local information on the chemical bonding between molecular fragments and the symmetry decomposition enables one to find the σ- and π- contributions to bond orders.
Force constants were calculated by fitting the metal-pyrazolyl fragment – X ligand potential surface to the polynomial function:
Time-Dependent Density Functional Theory (TD-DFT)52,53 was used to calculate the energies and intensities of the 60 lowest-energy electronic transitions of each model complex. These were transformed with the SWizard program29 into simulated spectra as described before,54 using Gaussian functions with half-widths of 2500 cm−1.
3. Results
3.1. Electronic Absorption and Magnetic Circular Dichroism
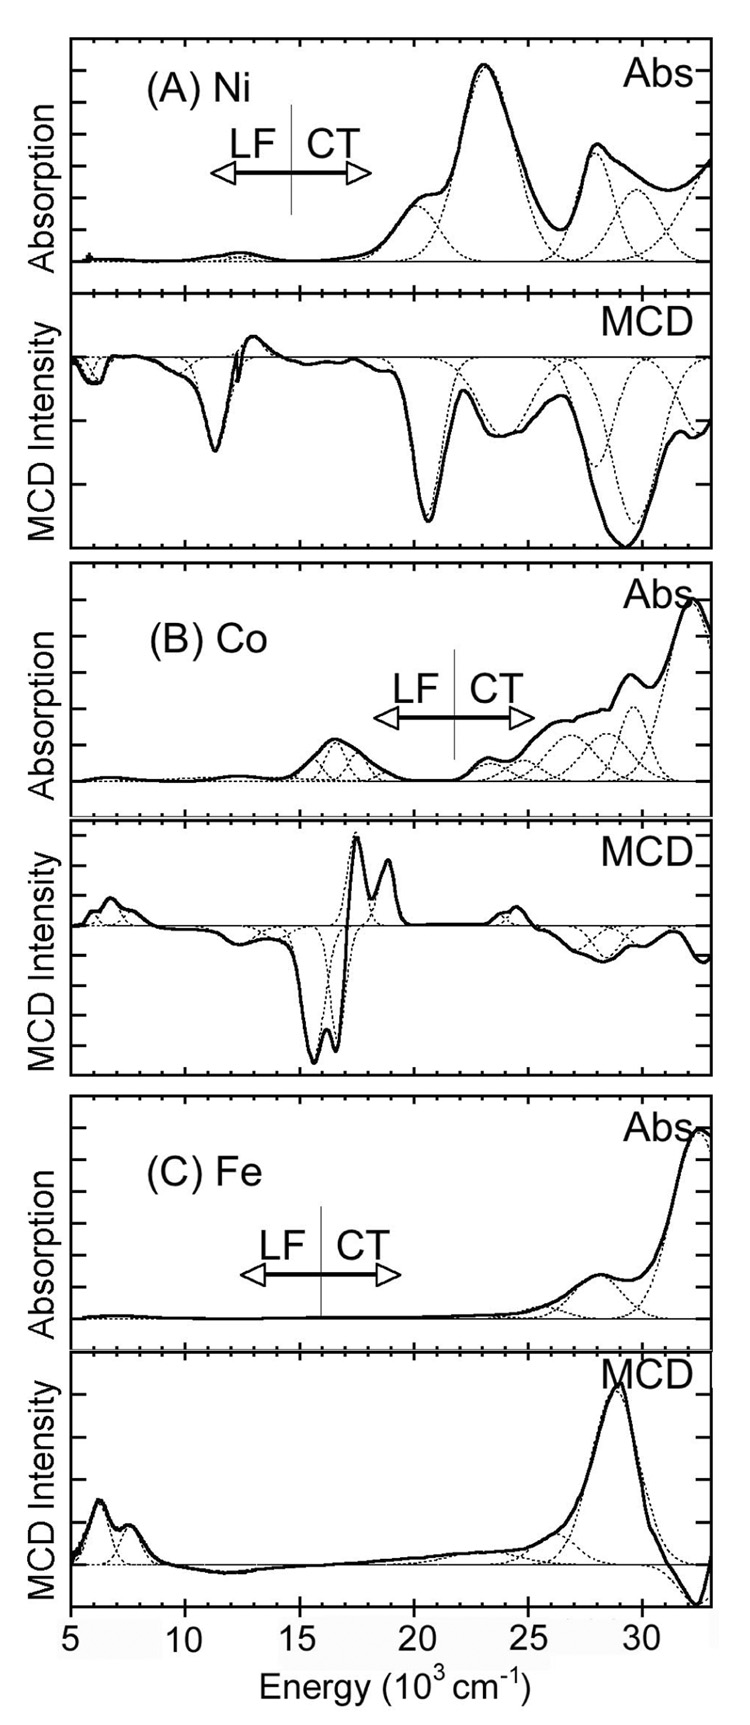
Figure 1 presents the room temperature solution absorption and low temperature mull MCD spectra of [NiL(SC6F5)] (A), [CoL(SC6F5)] (B), and [FeL(SC6F5)] (C). Gaussian resolution (depicted as dashed lines in the spectra) of the absorption spectra was obtained from a simultaneous fit of the absorption and MCD spectra for each of the complexes. Transitions gain MCD intensity by spin-orbit coupling. Thus, the ligand field (LF) transitions have higher MCD intensity than the charge transfer (CT) transitions which involve S or N character, because the spin-orbit coupling parameter for the metal is greater than for S and N: ξ(Cu2+) = 830 cm−1, ξ(Ni2+) = 630 cm−1, ξ(Co2+) = 515 cm−1, ξ(Fe2+) = 400 cm−1, ξ(S) = 382 cm−1, and ξ(N) = 70 cm−1.1 MCD transitions also have a sign which facilitates band resolution and assignment. On the other hand, absorption intensity is high for charge transfer (CT) transitions with large orbital overlap.
Figure 1.
Absorption and MCD spectra of (A) [NiL(SC6F5)], (B) [CoL(SC6F5)], and (C) [FeL(SC6F5)]. Room temperature absorption and low temperature MCD at 5 K and 7 T. Gaussian fits overlaid.
The bands observed for each of the complexes can be differentiated as LF and CT transitions by their relative intensities in absorption and MCD. The ratio of MCD-to-absorption intensity approximates the C0/D0 ratio for the mulls (C0 is the MCD C-term intensity and D0 is the dipole strength in absorption).
In the high energy (>15000 cm−1) region, the absorption spectrum (Figure 1A) of [NiL(SC6F5)] is dominated by intense absorptions at 30000 cm−1 (1120 M−1cm−1), 28000 cm−1 (1700 M−1cm−1), 23200 cm−1 (3060 M−1cm−1), and 20100 cm−1 (875 M−1cm−1). The low MCD/absorption ratios and the rR enhancements (vide infra) of these bands clearly indicate they are due to CT transitions. In the lower energy region there is weak absorption intensity (ε <100 M−1cm−1) at 12500 cm−1 and 6250 cm−1. Based on their high MCD/absorption ratios these are assigned as LF transitions. Tetrahedral Ni(II) complexes show a visible band at ~14000 cm−1 with multiplet structures due to the spin allowed 3T1(F) → 3T1(P) transition. They also exhibit additional spin allowed transitions at lower energies (~8000 and 5000 cm−1) due to the 3T1(F) → 3A2(F) and 3T1(F) → 3T2(F) transitions. Hence, in [NiL(SC6F5)] the 12500 cm−1 band is assigned to 3T1(F) → 3T1(P) (pseudo A due to in state spin orbit coupling), the 9500 cm−1 band (observed in MCD) to 3T1(F) → 3A2(F), and the 6250 cm−1 band to 3T1(F) → 3T2(F) transition.
The [CoL(SC6F5)] complex exhibits intense absorption (Figure 1B) at 32000 cm−1 (4900 M−1cm−1), 29400 cm−1 (2000 M−1cm−1), and 28000 cm−1 (1300 M−1cm−1). Again, these high energy bands are assigned to CT transitions based on their low MCD/absorption (C0/D0) ratios. The lower energy (<22000 cm−1) bands at 16500 cm−1, 12000 cm−1, and 7000 cm−1 are relatively more intense in MCD compared to absorption, which indicates that they are associated with LF transitions. Four-coordinate Co(II) complexes typically have an absorption band ~ 15000 cm−1 which is assigned to the 4A2 → 4T1(P) transition.56 The fine structure observed for this absorption band is attributed to spin orbit coupling within the T1 state (providing the pseudo A feature in MCD). The other bands observed in the visible and near-IR region are assigned to 4A2 → 4T1(F) at ~12500 cm−1 and 4A2 → 4T2(F) at 7000 cm−1 spin allowed transitions.
Figure 1C presents the absorption and MCD spectra for [FeL(SC6F5)]. This complex exhibits intense absorption at 32500 cm−1 (5850 M−1 cm−1) and 28000 cm−1 (1390 M−1 cm−1), and weak absorption at 7000 cm−1 (<100 M−1 cm−1). (Note that the MCD spectrum is collected using two spectrophotometers, one covering the range from 5000 – 16000 cm−1 and the second the range of 13000 – 33000 cm−1, where the overlap region 13000 – 16000 cm−1 is used to scale the two individual spectra for the mull sample. Due to the absence of any spectral feature in the overlap region for the ferrous complex, the data in the two spectral regions could not be scaled accurately). MCD investigation of four coordinate iron model complexes have shown that distorted tetrahedral sites exhibit two LF transitions in the 4000–7000 cm−1 region. The observed MCD spectral pattern (two bands in 5000–7000 cm−1 region) in the Fe complex, is analogously assigned to LF transitions. The other higher energy bands (which are orders of magnitude more intense in absorbance than LF transitions but comparable in MCD intensity) are assigned to CT transitions.
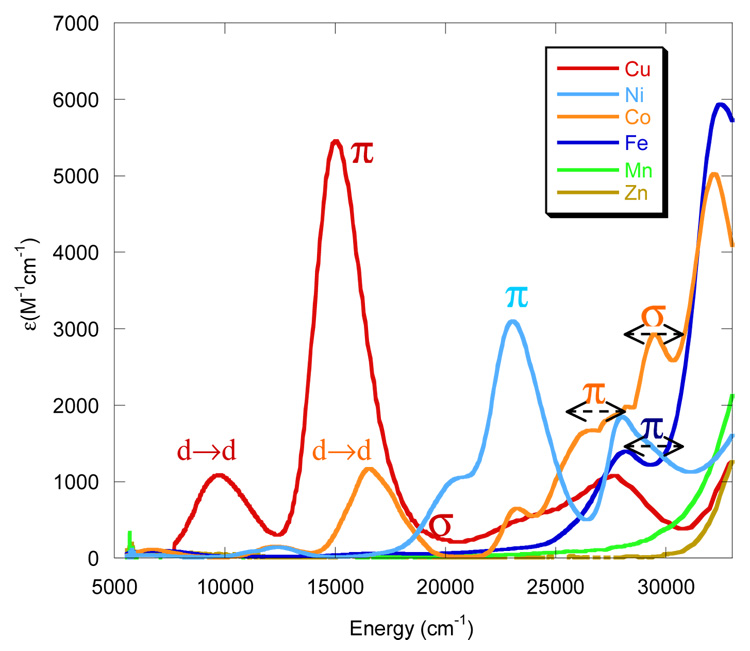
Figure 2 compares the electronic absorption spectra (5000–33000 cm−1) of the [ML(SC6F5)] complexes. Zn (d10) and Mn(d5) do not show significant absorption in the visible region (the former has a filled shell, and the latter has only spin forbidden LF transitions and CT transitions to high energy). The absorption spectrum of the copper complex matches those of a similar complex, [CuL(SCPh3)],57 the primary feature being the intense CT band due to a ligand-to-metal S(thiolate) pπ → Cu dx2−y2 (LMCT) transition. To lower energy are the LF transitions. Due to the presence of the SC6F5 thiolate, there are additional absorption bands in the 23000–30000 cm−1 region (Figure 2) when compared to the spectrum of the [CuL(SCPh3)] complex.
Figure 2.
UV-Vis absorption spectra of [ML(SC6F5)] in cyclohexane at room temperature.
Similar to [CuL(SC6F5)], the Ni complex also exhibits an intense S(thiolate) pπ → Ni dx2−y2 CT transition. This transition is shifted to higher energy and decreased in intensity relative the Cu complex. In going from Ni to Co, the S(thiolate) pπ → M dx2−y2 transition shifts to still higher energy and further decreases in intensity. Importantly, a new feature at higher energy and with increased intensity, relative to the S(thiolate) pπ → Co dx2−y2 LMCT transition, is present in the Co complex. This band is assigned to the S(thiolate) pσ → Co dxy LMCT transition. Further, the Fe complex also exhibits an intense higher energy CT transition above 30000 cm−1, which could be assigned to the S(thiolate) pσ → Fe transition. Thus, the interesting trends observed are 1) in going from Cu → Ni → Co the S(thiolate) pπ → M dx2−y2 transition shifts to higher energy and decreases in intensity, and 2) a new S(thiolate) pσ → M dxy band appears in going from Ni to Co which shifts to higher energy in going from Co to Fe.
3.2. Resonance Raman Spectroscopy
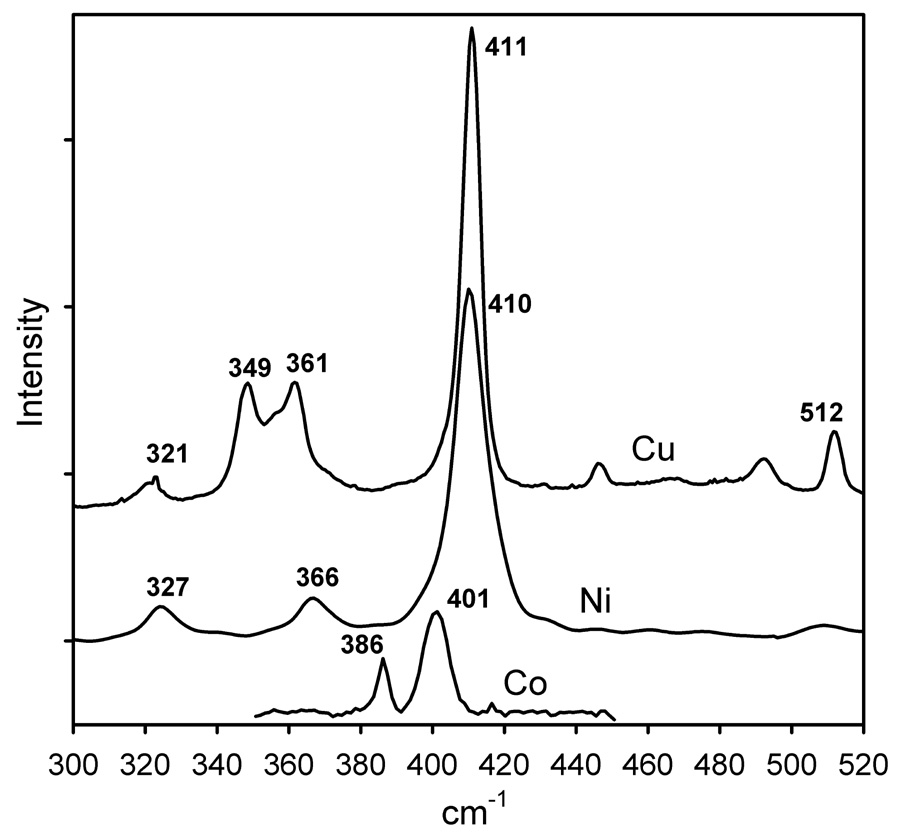
The resonance Raman (rR) spectra for [ML(SC6F5)] (M= Cu, Ni, and Co) are characterized by a dominant strong peak at 400–411 cm−1 that is associated with M-S stretching (Figure 3). This band is resonance enhanced through the S(thiolate) pπ → M dx2−y2 CT transition. There are also additional weak bands in the 300–500 cm−1 region. These weaker bands have been attributed to kinematic coupling of the M-S stretching with other vibrational modes of [ML(SC6F5)]. The rR spectrum of the [CuL(SC6F5)] complex resembles those of the [CuL(SCPh3)] complex, studied previously.57 In the latter, however, the Cu-S vibrational frequency (421 cm−1) is greater than that of [CuL(SC6F5)] (411 cm−1), indicating that the Cu-S force constant in [CuL(SC6F5)] is somewhat weaker than in the complex with the more electron-rich SCPh3 thiolate but similar to the Cu-S force constants in typical blue copper proteins.1
Figure 3.
Resonance Raman spectra of [ML(SC6F5)], M= Cu (excitation wavelength λo 676 nm), Ni (λo 458 nm), and Co (λo 407 nm).
The intensity-weighted average frequency,58 <νM-S(thiolate)> of the 400 cm−1 envelope for the [ML(SC6F5)] complexes does not show large variation. This agrees with the observation that the experimental15 and calculated (Figure S1 in Supporting Information) IR spectra of these complexes in the 300–500 cm−1 region are very similar.
Using excitation in the absorption bands of [FeL(SC6F5)] in the 23000–30000 cm−1 spectral region, the Fe-S stretching vibration has not been detected in the rR spectrum. Instead, very strong resonances at 1410 and 1675 cm−1 were observed (Figure S2 in Supporting Information). These two bands are also present in spectra of the other complexes, when the Raman excitation energy is in the 23000–30000 cm−1 region. The high frequencies of these vibrations are consistent with intraligand aromatic C-C and C-N stretches. This type of geometric distortion would be expected for an excited electronic state with a π-antibonding interaction between atoms in the aryl thiolate ligand. Since the 1410, 1675 cm−1 bands are observed for all the complexes and their energies are independent of the metal atom, they can be assigned to the SC6F5 thiolate vibrational bands. DFT calculations of the vibrational spectra of the complexes support this assignment (vide infra). Thus, the absorption spectra in the near-UV region all have significant contributions from thiolate intraligand electronic transitions.
3.3. XAS Sulfur K Edges
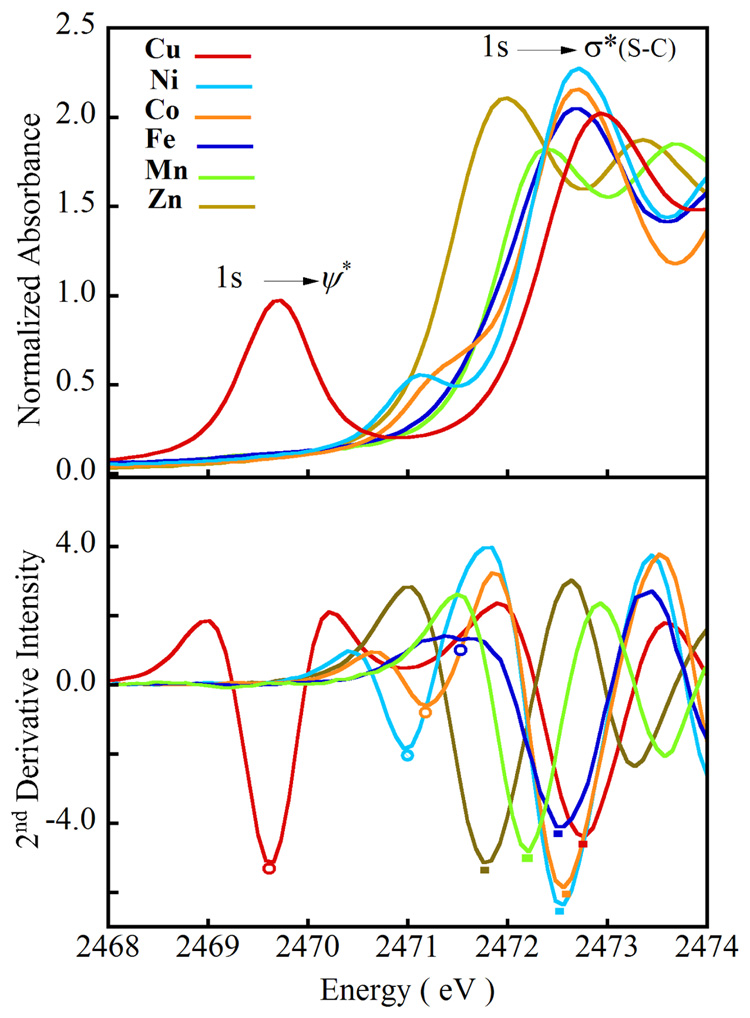
The S K-edge spectra of the [ML(SC6F5)] series are shown in Figure 4. A low energy pre-edge feature is observed in the 2469 – 2472 eV range, whose energy position varies in the order: Cu(II) < Ni(II) < Co(II) < Fe(II). The pre-edge feature for the Fe and Mn complexes is shifted into the edge but is observed in the 2nd derivative spectrum for [FeL(SC6F5)]. The Zn complex, which has a filled d-manifold, lacks this transition. This transition is assigned as a ligand 1s → ψ* transition, and in the case of a d9 system, ψ* is the singly occupied HOMO.59,60 Due to the localized nature of the S 1s orbital, this transition can gain intensity only if there is a significant component of the S 3p character mixed in the ψ* orbital, thus the observed pre-edge transition intensity is the intensity of the pure dipole allowed 1s → 3p transition weighted by α2 (M 3d – S 3p covalency of the bond):
Figure 4.
(A). The normalized S K-edge XAS spectra of [M-S(C6F5)] complexes (M = Mn(II)  , Fe(II)
  , Co(II)
  , Ni(II)
  , Cu(II)
  , and Zn(II)
  ]. (B) The 2nd derivative spectra showing the shift in the 1s→ ψ* transition as well as the edge transition between 2471.5 and 2473.0 eV. The circles and solid rectangles are color coded to indicate the pre-edge peak maxima and the edge transition respectively.
Integrating the area under the pre-edge peak thus provides a direct probe of the M 3d-S(thiolate) covalency.61 Quantitation of the S character in the ψ* for the Cu(II) and Ni(II) complexes gives 28% and 6% S 3p character (weighted by the number of d-holes), respectively. This is in very good agreement with DFT calculations (Section 4.2). For both Co(II) and Fe(II) the parent excited states can mix with the higher lying states (overlapping the edge) of appropriate symmetry, which derive from formally forbidden two-electron excitations.60 This mixing redistributes some of the intensity predicted by the strong field dipole strength (for the transition to the allowed dn+1 excited state) to higher energy states overlapping the edge. The magnitude of this mixing can be estimated from the Tanabe-Sugano matrices assuming reasonable excited state Dq and B values.62,63 In the Co(II) complex the excited state mixing is estimated to be 16%. The parent excited state (pre-edge) accounts for ~4% S character in the ψ*, which indicates a M 3d - S 3p covalency of ~ 5%. In the case of the Fe(II) and Mn(II) complexes, the pre-edge is completely shifted into the edge, which makes the experimental estimation of covalency inaccessible.
The energy of the pre-edge transition is determined by three factors, the S atomic charge, the ligand field on the metal ion and the felt by the metal 3d-manifold.60,64 In contrast, the energy of the edge transition is determined by the S atomic charge. Thus, the pre-edge transition energy, corrected for the shift in the edge energy, will reflect the combined effect of the ligand field and on the metal. In addition, since all the complexes are tetrahedral with the same ligand set, the ligand field effects in modulating the pre-edge transition energy are expected to be similar in the [ML(SC6F5)] series. Thus, the energy shifts of the edge and 1s → ψ* transitions, together, can determine the trend in metal effective nuclear charge in [ML(SC6F5)] (M = Fe to Cu).
The intense electric dipole allowed transition observed at the onset of the edge jump in the S K-edge spectra at ~2473 eV is the 1s → σ*(S-C) transition. This transition shifts to higher energy in the following order: Zn(II) < Mn(II) < Fe(II) < Co(II) = Ni(II) < Cu(II) (Figure 4, Table 1). This trend reflects a decrease in the negative charge on sulfur due to covalent donation from the thiolate ligand to the metal 3d orbitals (Section 4.2) as observed from the pre-edge intensity (vide supra). Interestingly, both edge transition energy and M 3d-thiolate covalency are similar for Ni(II)- and Co(II)-thiolate complexes. Co(II) has an additional vacant orbital (dxy) compared to Ni(II). This results in an additional σ covalent interaction in the Co(II) complex, which would decrease the negative charge on sulfur. However, the M 3d - S pπ covalency is weakening on going from Ni(II) to Co(II), resulting in similar edge energies and S 3p character mixed in to the metal d-orbitals. In the Zn(II) complex, the edge transition is 1 eV to lower energy compared to the Cu(II) complex, indicating more electron density on S in the Zn(II) complex consistent with the less covalent M-S bond in the d10 configuration (Section 4.4).
Table 1.
S K-Edge XAS Results for the [ML(SC6F5)] complexes.
| M | 1s → ψ* Pre-Edge Energy (eV)a | 1s → σ* (S-C) Transition Energy (eV)b | %S character in ψ* |
|---|---|---|---|
| Zn(II) | N/A | 2471.8 | - |
| Cu(II) | 2469.7 | 2472.8 | 28% |
| Ni(II) | 2470.9 | 2472.6 | 6% |
| Co(II) | 2471.3 | 2472.6 | 5% |
| Fe(II) | 2471.4c | 2472.5 | - |
| Mn(II) | - | 2472.2 | - |
The estimated error is ± 0.1 eV.
Determined from the 2nd derivative experimental spectra.
Error in energy estimation is higher as the pre-edge is barely resolvable in the 2nd derivative spectrum.
Using the trend observed in the edge transition (1s → σ*(S-C)) energy, a comparison of the edge-corrected pre-edge energies (1s → ψ*) furnishes the trend in on the metal ion. The edge-corrected pre-edge energy increases in going from Cu(II) to Ni(II) to Co(II) to Fe(II) (Table 1). This transition is ~ 1.4 eV higher in energy for Ni(II) compared to Cu(II), 0.4 eV higher for Ni(II) compared to Co(II) and 0.2 eV higher for Co(II) compared to Fe(II) in [ML(SC6F5)]. Since a greater of the metal ion would decrease the energy of the metal 3d-manifold leading to a decrease in the 1s → ψ* transition energy, the is largest for Cu(II) in the series.
4. Analysis
4.1. Geometric Structure, M-S Bond Energies, Force Constants and Bond Orders
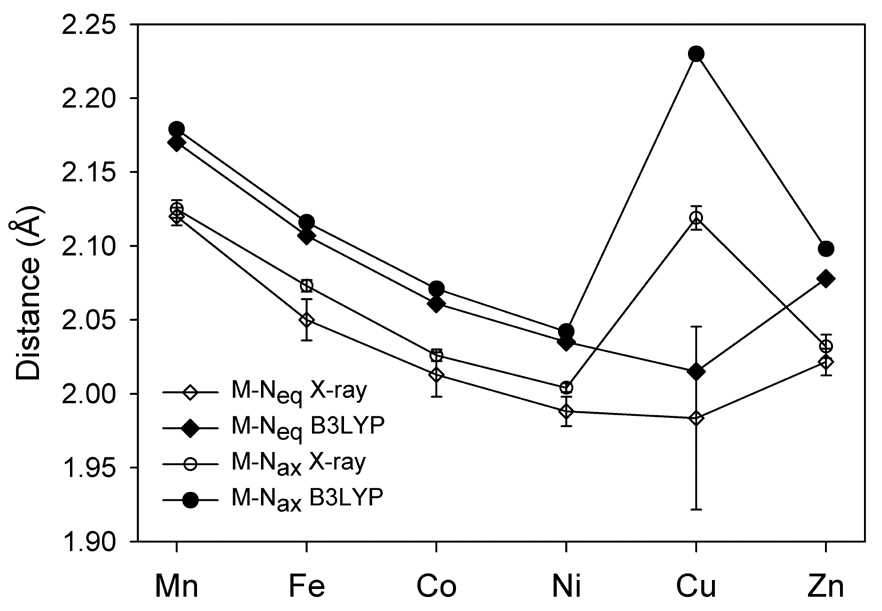
The metal atom in [ML(SC6F5)] has a distorted tetrahedral coordination sphere, with two short equatorial M-N bonds and the elongated axial M-N bond (Figure 5; the metal-ligand distances and Cartesian atomic coordinates of the optimized structures are available in the Supporting Information). The Cu-Nax bond distance is especially long due to the Jahn-Teller distortion for the (e)4(t2)5 electronic configuration.
Figure 5.
The experimental14,15 and calculated M-N bond lengths in the [ML(SC6F5)] complexes.
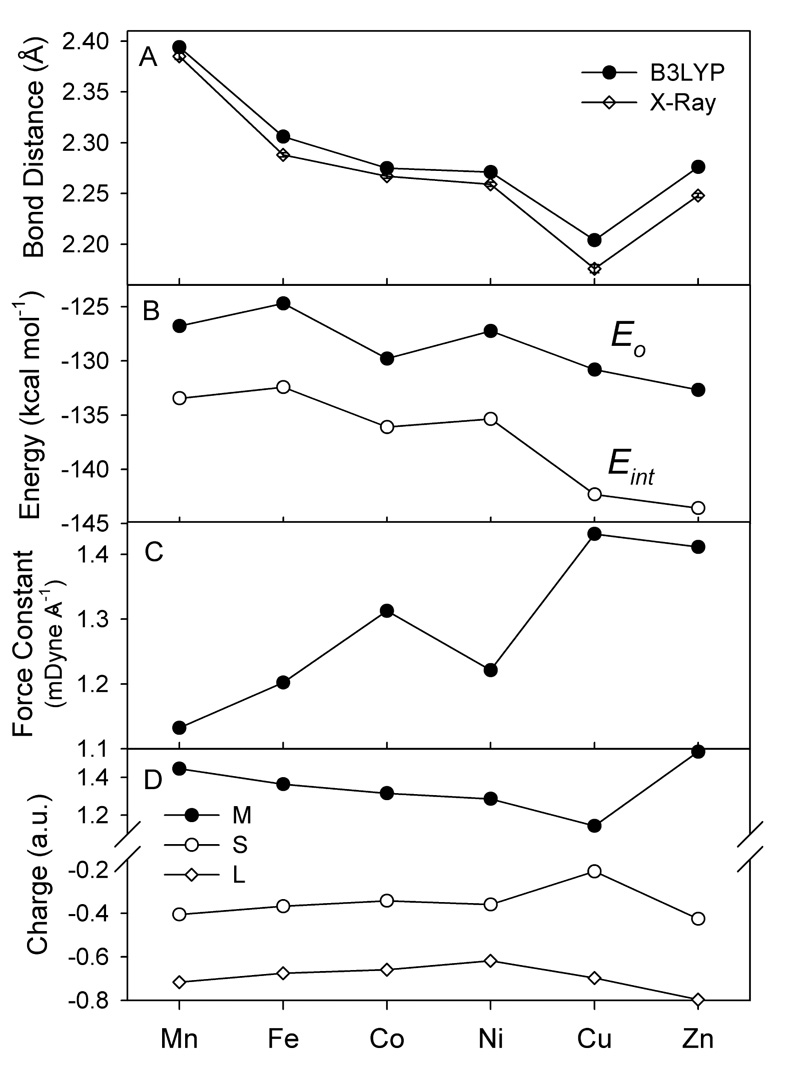
While the M-Neq bond distances decrease monotonically from Mn to Cu, the M-S bond lengths decreases sharply from Mn to Fe, changes little from Fe(II) to Co(II) and Co(II) to Ni(II), decreases again from Ni(II) to Cu(II) and increases to Zn (Figure 6A). The M-L distances from the B3LYP/6-311+G(d) calculations are somewhat longer than those determined crystallographically (the mean absolute deviation (MAD) is 0.048 Å and 0.017 Å for M-Neq and M-S bond lengths respectively). The Cu-Nax bond length difference between the calculated and experimental value is ~0.1 Å, but it corresponds to the weakest Cu-N interaction and easily influenced by other factors. The energy corresponding to the Cu-Nax bond length change from 2.23 Å to 2.12 Å (expr.)14 is only 0.45 kcal mol−1. Overall, the B3LYP calculations reproduce all experimentally observed structural changes very well. The BP86 functional also predicts the same trends in M-S bond lengths as the B3LYP functional but, because of the overly covalent tendency of the BP86 functional,1 the M-S distances from BP86 calculations are consistently shorter (by 0.02–0.07 Å) than those from the B3LYP calculations and the X-ray structures.14,15 The non-monotonic variations in the M-S bond lengths (Figure 6) mark important changes in the metal-thiolate bonding, depending on the electronic configuration of the metal ion (vide infra).
Figure 6.
A) Experimental and calculated M-S bond lengths in the [ML(SC6F5)] complexes; B) calculated binding energies, Eo, and interaction energies, Eint, between the ML+ and SC6F5− fragments; C) calculated M-S force constants; and D) the NPA charges of the metal and sulfur atoms and the pyrazolyl ligand L.
Generally, it is expected that the shorter bond will be stronger. More rigorously, the bond strength should be described by two main parameters, the bonding energy (Eo) and the force constant, k. The latter represents the potential energy surface (PES) curvature near the minimum:
The calculated ML+ - SC6F5− binding energy, Eo, in [ML(SC6F5)] ranges (Figure 6B) from −124.7 kcal mol−1 (Fe) to −132.7 kcal mol−1 (Zn) and its variation does not mirror the changes in the M-S bond lengths. The M-S force constant is the lowest for the Mn complex (1.13 mDyne Å−1), increases from Mn to Fe to Co, where it reaches a local maximum, then decreases for the Ni complex, and increases for the Cu(II) complex (the maximum value, 1.43 mDyne Å−1), and then decreases again for Zn(II). The force constant (Figure 6C) shows greater variation (26%) than the bond energy (6%). Its variation is more consistent with the changes in the M-S bond lengths.
The chemical bonding in transition metal complexes is usually described in terms of ionic and covalent interactions between the metal and the ligands. In many transition metal complexes (especially, complexes of first row transition metals), the ionic contribution to metal-ligand bonding is thought to be dominant. However, in [ML(SC6F5)], the metal-thiolate bonding also makes a significant covalent contribution. This is reflected in the experimental spectra (Section 3) and metal-thiolate orbital mixing, which will be discussed in Section 4.2. The ionic contribution is related to the atomic charges of the metal and the sulfur of the thiolate ligand (Figure 6D). It can be seen that the absolute values of metal and sulfur charges are highest in the Mn and Zn complexes and lowest in the Cu complex. All population analysis methods employed (MPA, LPA, and NPA) show this trend. Thus, the ionic contribution to the M-S bond energy is lowest in the Cu complex and highest in the Mn and Zn complexes.
4.2. Ground State Electronic Structure
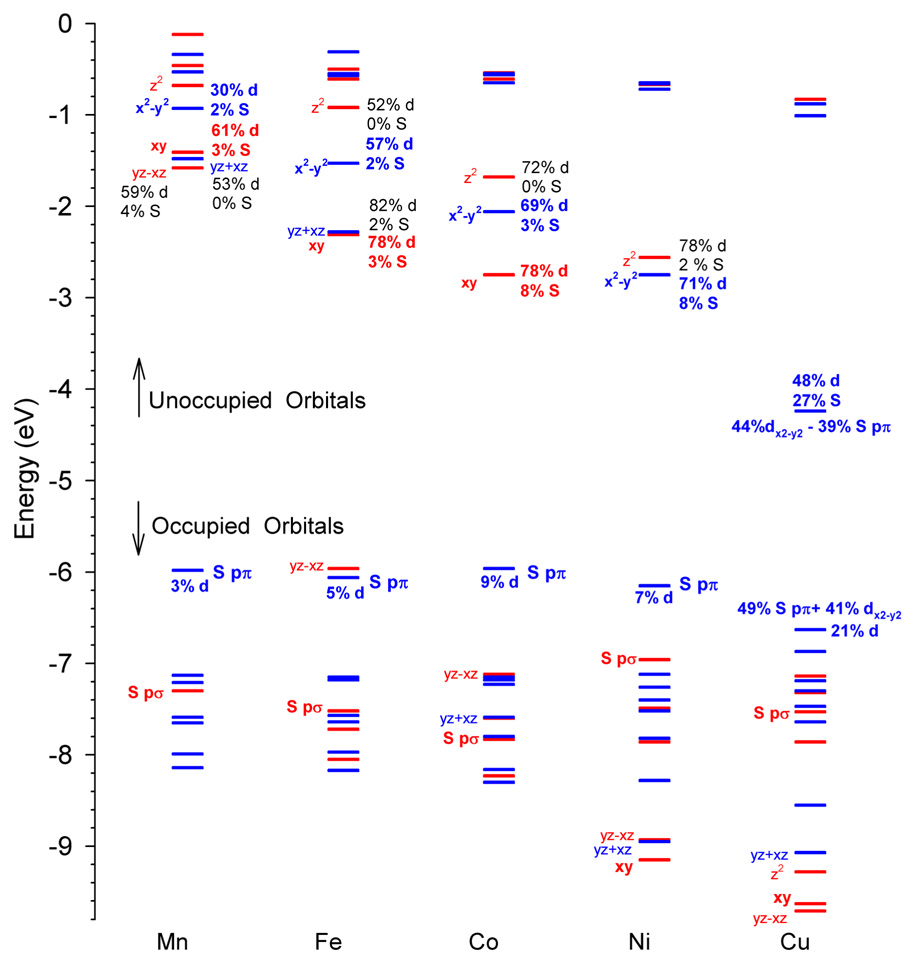
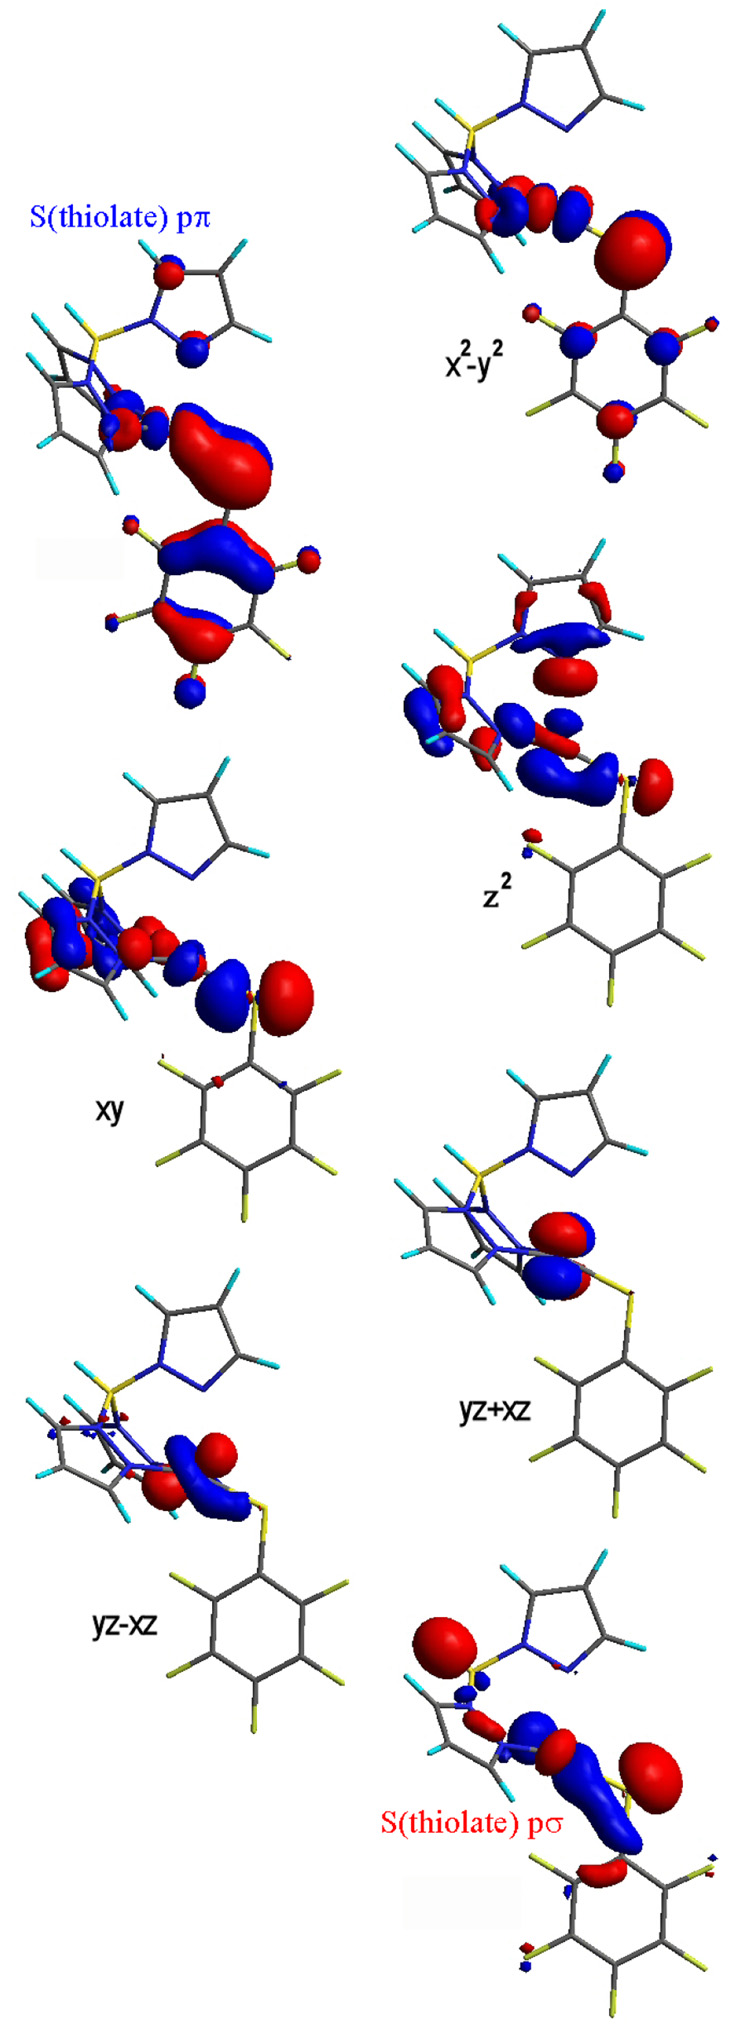
Figure 7 and Figure S3–4 (Supporting Information) shows MO diagrams for the [ML(SC6F5)] complexes, with the metal 3d orbitals and the thiolate ligand orbitals labeled. Contour surfaces of the frontier molecular orbitals are presented in Figure 8. These MOs are relevant for chemical bonding between the metal atom and the thiolate ligand and define the optical spectra of the corresponding [ML(SC6F5)] complexes (Section 4.3). The metal-ligand covalent interaction involves charge donation from the SC6F5− ligand to the ML+ fragment (Table 2). From the charge decomposition analysis,37,45 the back-donation from the ML+ fragment to the thiolate ligand is very small in this series (for example, the orbital contribution of all α-spin unoccupied SC6F5− fragment orbitals to all 119 α-spin occupied MOs of the complexes is only 2.7–4.3% (Table 2), out of 11900%) in spite of the less-electron donating character of the pentafluorinated thiolate ligand.
Figure 7.
β-Spin frontier molecular orbitals of the [ML(SC6F5)] complexes (MOs with a’ and a” symmetry are shown in red and blue respectively).
Figure 8.
Contour surfaces of frontier molecular orbitals of the [ML(SC6F5)] complexes.
Table 2.
Total contributions (%) of unoccupied fragment molecular orbitals (UFOs) to the occupied orbitals of [ML(SC6F5)], the resulting charge transfer (a.u.) from the SC6F5- thiolate to the ML+ fragment, and the NPA spin density sNPA (a.u.) on the thiolate ligand in the complexes.
| Mn | Fe | Co | Ni | Cu | Zn | |
|---|---|---|---|---|---|---|
| Donation (SC6F5−→ ML+) | ||||||
| % (α-spin UFO of ML+) | 29.5 | 29.6 | 28.2 | 28.2 | 26.2 | 32.5 |
| % (β-spin UFO of ML+) | 32.0 | 33.6 | 48.9 | 47.3 | 81.7 | 32.5 |
| Back-donation (SC6F5− ← ML+) | ||||||
| % (α-spin UFO of SC6F5−) | 3.1 | 3.5 | 3.5 | 3.4 | 4.3 | 2.7 |
| % (β-spin UFO of SC6F5−) | 2.7 | 4.8 | 4.2 | 3.7 | 4.0 | 2.7 |
| ΔqNPA (SC6F5− → ML+) | 0.32 | 0.36 | 0.38 | 0.37 | 0.57 | 0.28 |
| sNPA (SC6F5−) | 0.13 | 0.16 | 0.17 | 0.16 | 0.38 | 0.00 |
In the Mn complex, all the β-spin 3d orbitals of the central atom are unoccupied. The β–spin HOMO of the complex is the S(thiolate) pπ orbital, which corresponds to the highest occupied fragment orbital of SC6F5−. The occupied S(thiolate) pσ orbital (HOMO-3, which corresponds to HOMO-1 of the SC6F5− fragment) is 1.4 eV lower in energy than the HOMO. These two thiolate occupied fragment orbitals are main contributors to the covalent bonding between the metal ion and the thiolate. The 119 α-spin and 115 β-spin occupied MOs of the Mn complex contain a total of 29.5 % and 32% orbital character of the unoccupied molecular orbitals of the ML+ fragment respectively (Table 2).
Since the difference between β- and α-spin unoccupied fragment molecular orbitals (ML+) contributions (Table 2) is less than 3%, the Mn 3d - thiolate orbital interactions are weak and contribute little to the covalent bonding relative the stronger Mn 4s,4p - thiolate orbital interaction. This can be confirmed by looking at compositions of the frontier orbitals. The Mn 3d orbital character of the thiolate-based HOMO(π) and HOMO-3(σ) (the SC6F5− contribution is 95% and 86% respectively) is 3% and 5% respectively, and reciprocally the S orbital contribution is 2% for the Mn dx2−y2 (dπ) and 3% for dxy (dσ) orbitals (Figure 7). The β-spin HOMO-LUMO gap (4.4 eV) in the Mn complex is second largest (the Zn complex has the largest HOMO-LUMO gap in the series).
In the Fe complex with one more valence electron, the lowest of the d orbitals (dyz−xz) is the HOMO and is stabilized by 4.4 eV, relative to the analogous orbital in [MnL(SC6F5)]. The β-HOMO-LUMO gap becomes smaller, 3.7 eV, reflecting greater for Fe relative to Mn (vide supra). The increased shifts the energies of metal-based orbitals closer to the occupied thiolate ligand orbitals and increases the covalent contribution to metal-thiolate bonding (Table 2).
In the Co complex, the next d orbital (dyz+xz) becomes occupied. Since for Co is greater than that of Fe, the β-HOMO-LUMO gap again becomes smaller (3.2 eV) and the covalency of the metal-thiolate bond is further increased (Table 2). The important contribution comes from the HOMO-5 which is a bonding combination of the S(thiolate) pσ orbital (HOMO-1 of SC6F5−) and Co dxy. The largest HOMO-5 contribution to M-S bond order indicates the strongest σ bonding component among all [ML(SC6F5)] complexes.
In the Ni complex, the dxy orbital is now occupied. This cancels the S(thiolate) pσ – M dxy bonding component for the covalent M-S bond and causes the overall M-S bond order to decrease (Section 4.4). Since the dxy orbital is now below the S(thiolate) pσ orbital (Figure 7), the latter is destabilized by ~1 eV. The greater for Ni results in a further lowering of the energies of M 3d-based orbitals and favors more efficient covalent bonding with the S(thiolate) pπ orbital. As a result, the S character in the LUMO (dx2−y2) is increased to 8% and the corresponding HOMO(SC6F5−) contribution is 12%.
In the Cu complex, the dz2 orbital is populated and the Cu dx2−y2 is the only unoccupied d orbital. As a result of the still larger , the β-HOMO-LUMO gap for [CuL(SC6F5)] is lowest (2.4 eV) maximizing the orbital interaction between the S(thiolate) pπ and Cu dx2−y2: the β-HOMO of the complex is composed of 49% of HOMO(SC6F5−) and 41% β-LUMO(ML+) and the β-LUMO of the complex, which is the anti-bonding counterpart of the β-HOMO, is composed of 39% of HOMO(SC6F5−) and 44% β-LUMO(ML+), see Figure S3. Alternatively, the S character of the β-LUMO is 27% and the Cu 3d character of the β-HOMO is 21%. Thus, the β-HOMO/LUMO compositions in the Cu complex indicate the most covalent M-S bond in the series and largest charge transfer from the thiolate to the metal (Table 2).
In the Zn complex, all the d orbitals of the metal ion are occupied, including the Zn dx2−y2 - S pπ orbital. Thus, the π contribution to covalency is cancelled and the covalent bonding interaction between Zn 3d orbitals and the thiolate orbitals becomes very small and charge transfer from the thiolate to the metal is the smallest in the series (Table 2). The only remaining covalent interaction come from the Zn 4s,4p orbitals (Figure S4 in Supporting Information). Note that the amount of M 4s,4p – thiolate mixing changes little (26.2% – 32.5%, Table 2) over the [ML(SC6F5)] series.
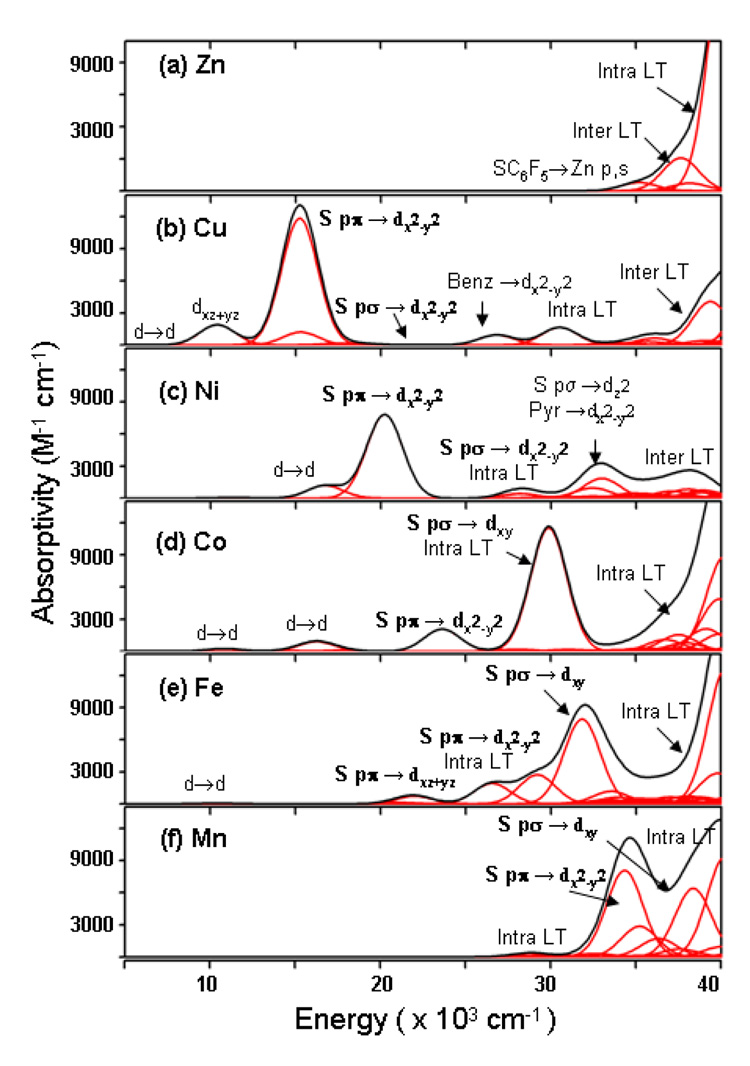
4.3. TD-DFT Calculations of Electronic Spectra
Figure 9A–F presents the calculated absorption spectra (5000 to 40000 cm−1) for the [ML(SC6F5)] complexes and lists the principal electronic excitations, which contribute to the electronic transitions. In the spectrum for the Zn complex (Figure 9A) there are no transitions in the 5000–30000 cm−1 region, consistent with the experimental UV-Vis absorption data (Figure 2). This is due to the filled d10 electronic configuration in the Zn(II) ion. The higher energy region (>35000 cm−1) exhibits some absorption intensity (ε ~ 1000 M−1cm−1) due to the S(thiolate) pπ → Zn 4p, the S(thiolate) pπ → (pyrazolyl) π inter-ligand transition, and benzyl based intra- ligand charge transfer transitions.
Figure 9.
Simulated electronic spectra of [ML(SC6F5)] from the TD-DFT calculations. The contributions from individual electronic transitions are shown in red.
The primary feature in the TD-DFT calculated spectrum of the copper complex (Figure 9B) is the intense absorption at ~15000 cm−, due to the S(thiolate) pπ → Cu dx2−y2 (β-spin HOMO → LUMO) transition. This is characteristic of copper complexes having the highly covalent S(thiolate) pπ - Cu interaction in the ground state and leads to its blue color.1–3 In the lower energy (5000–12000 cm−1) region there are the four LF transitions in the following order dz2<dxy<dxz+yz<dxz−yz. Note that one of the LF transition (dxz+yz → dx2−y2) gains absorption intensity by mixing with the allowed S(thiolate) pπ → Cu dx2−y2 LMCT transition as observed. In the higher energy region, TD-DFT predicts two weak (pyrazolyl) pπ → Cu dx2−y2 CT transitions at 15300 and 17600 cm−1. The S(thiolate) pσ → Cu dx2−y2 LMCT excitation is at 23000 cm−1 with very little intensity. The absorption intensity at 27000 cm−1 and 30000 cm−1 is due to S(thiolate) pπ → Cu dx2−y2 and thiolate-based intra-ligand transitions, respectively. The inter ligand CT transitions have absorption intensity in the >37000 cm−1 region. The calculated spectrum is in very good agreement with the experimental absorption data (Figure 2) and past band assignments for Cu-thiolate complexes1,57 (Section 3.1).
The calculated absorption spectrum of the Ni complex (Figure 9C) exhibits a dominant feature at ~20000 cm−1, which is due to the S(thiolate) pπ − Ni dx2−y2 LMCT transition. This transition is higher in energy (from 15000 cm−1 to 20000 cm−1) and lower in intensity (from 12000 M−1cm−1 to 8000 M−1cm−1) compared to the corresponding transition (S(thiolate) pπ → Cu dx2−y2) in the Cu complex (Figure 9B) as observed experimentally (Figure 2) and expected from the decreased β-spin HOMO(SC6F5−)-LUMO(NiL+) interaction (Figure 7). Ligand field transitions (dyz+xz → dx2−y2 and dyz−xz → dz2, into the two singly occupied orbitals in the ground state of Ni(II)) form the lower energy shoulder at 16000 cm−1. In the higher energy region (>25000 cm−1) there are the S(thiolate) pσ → Ni dx2−y2, benzyl based intra-ligand CT transitions, the S(thiolate) pσ → Ni dz2, and the (pyrazolyl) pπ → Ni dx2−y2 transitions. Inter ligand CT transitions are present in the ~37000 cm−1 region, similar to the Cu complex.
Figure 9D presents the absorption spectrum for [CoL(SC6F5)]. The LF transitions are calculated to be in the 10000–20000 cm−1 region. The S(thiolate) pπ → Co dx2−y2 charge transfer transition is present at 24000 cm−1 (ε ~ 3000 M−1cm−1); this transition is higher in energy and lower in intensity compared to the corresponding band in the Ni complex (20000 cm−1 and ε ~ 8000 M−1cm−1) as observed experimentally. The interesting feature in the Co complex is an intense (ε ~ 11000 M−1cm−1) S(thiolate) pσ → Co dxy charge transfer transition at 30000 cm−1. In Co(II) the additional, relative to Ni(II), singly occupied orbital is the dxy orbital (Figure 8), having the σ interaction with the S(thiolate), leads to the intense absorption at 30000 cm−1. This reverses the pattern of more intense S(thiolate) pπ and less intense S(thiolate) pσ to M dx2−y2 orbital CT transitions observed in the Cu and Ni complexes, to less intense S(thiolate) pπ → M dx2−y2 and more intense S(thiolate) pσ → M dxy transitions. This behavior explains the spectral differences in Figure 2, where the absorption intensity at ~30000 cm−1 due to the S(thiolate) pσ LMCT transition is more intense than the transition at ~25000 cm−1 due to the S(thiolate) pπ LMCT transition. Similar to the other metal-thiolate complexes in the higher energy region (>35000 cm−1) there are the SC6F5 based intra-ligand excitations contributing to the absorption intensity.
The TD-DFT calculated spectrum for the Fe complex (Figure 9E) shows low intensity ligand field transitions in the 5000 – 20000 cm−1 region. The S(thiolate) pσ → Fe dxy LMCT excitation appears as the intense absorption (ε ~ 8000 M−1cm−1) at 32000 cm−1, compared to the less intense (ε ~ 2200 M−1cm−1) S(thiolate) pπ → Fe dx2−y2 CT excitation contributing to the absorption intensity at ~28000 cm−1. Intra ligand transitions also contribute to absorption intensity in this energy region. The S(thiolate) pσ → Fe dxy LMCT transition is higher in energy (by 2000 cm−1) and lower intensity (by 3000 M−1cm−1), and the S(thiolate) pπ → Fe dx2−y2 LMCT transition is also higher in energy (by 4000 cm−1) and lower in intensity (by 800 M−1cm−1) relative to the corresponding excitations in the Co complex (vide supra, particularly the data in Figure 2). This is a refection of lower M 3d – S(thiolate) covalency in going from Co to Fe.
The [MnL(SC6F5)] complex does not have absorption intensity in the 5000–25000 cm−1 region. This is because the LF transitions in high spin Mn(d5) complexes are both spin and Laporté forbidden.56 The absorption intensity at ~35000 cm−1 is due to S(thiolate) pπ → Mn dx2−y2 LMCT transition, and at 38000 cm−1 to the S(thiolate) pσ → Mn dxy LMCT transition. Intra ligand CT transitions are present at higher energy (~40000 cm−1).
Thus, the calculated electronic absorption spectra are in good agreement with the experimental spectra for the [ML(SC6F5)] complexes. First, the zinc and manganese complexes with d10 and d5 electronic configuration do not exhibit absorption in the 5000–30000 cm−1 region. Second, in going from the copper to the iron (Cu → Ni → Co → Fe) complex, the S(thiolate) pπ → M dx2−y2 CT transition shifts to higher energy and decreases in intensity. Third, the Co complex exhibits a reversal in the π/σ intensity ratio as compared to the Cu and Ni complex. In going from Co to Fe the S(thiolate) pσ → M dxy CT transition shifts to higher energy and decreases in intensity.
4.4. Trends in Metal-Thiolate Bonding
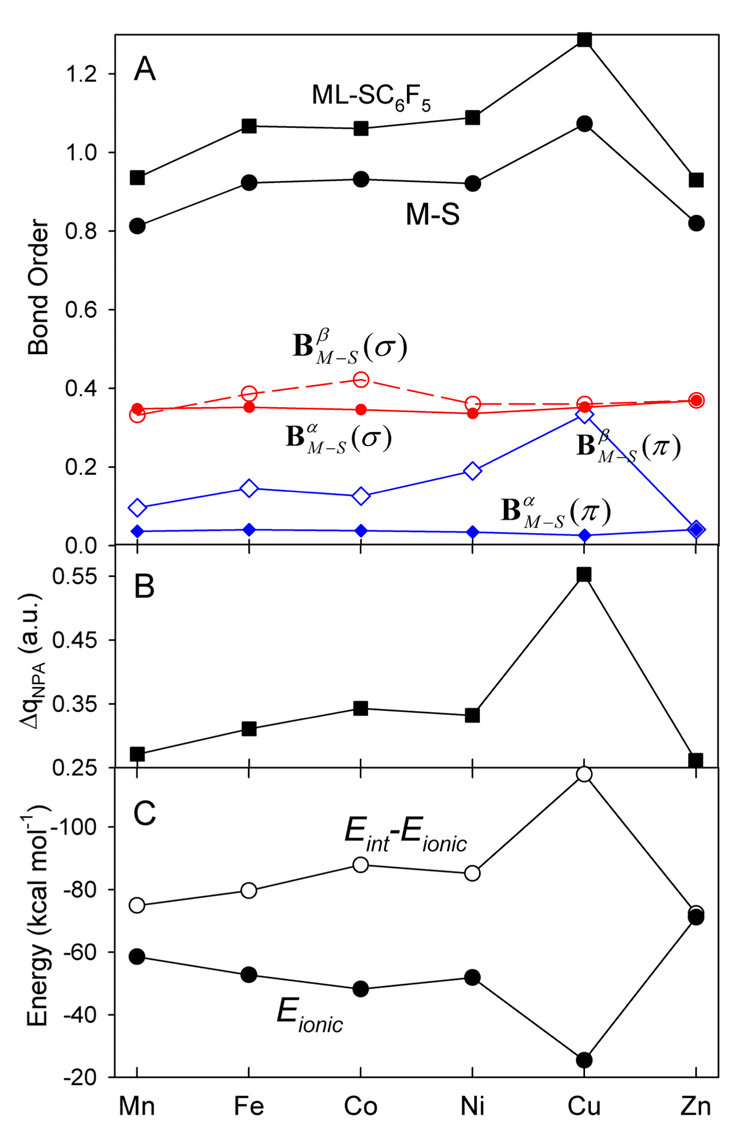
From the bond order analysis, the metal-sulfur bonding is a dominant interaction between the ML+ fragment and the thiolate ligand, contributing 75–81% to the total bond order between the two molecular fragments (Figure 10A). The M-S bond order (and the total ML-SC6F5 bond order) in the [ML(SC6F5)] complexes follows the Mn < Fe < Co > Ni < Cu > Zn progression found in the M-S force constants (Figure 6) and the charge transfer from the SC6F5− ligand to the ML+ fragment (Table 2, Figure 10B).
Figure 10.
A) The Mayer M-S bond order (solid black circle) and its σ- and π-components (in red and blue colors, respectively) and the bond order between the ML+ and SC6F5− fragments (solid black squares) in the [ML(SC6F5)] complexes. B) The charge donation from the SC6F5− ligand to the ML+ fragment. C) The ionic component of the ML+- SC6F5− bonding energy, Eionic, and the difference, Eint – Eionic.
To gain additional insight, it is possible to use symmetry-adapted orbitals in the bond-order analysis. The σ bond component to the Mayer bond orders from the α-spin MOs, , is fairly constant through the series. This is because the α-spin LUMO of the ML+ fragment (this orbital has 75–80% M 4s and 25–30% M 4p character) remains relatively unperturbed (in its energy and composition) by the nature of the central atom. As a result, the coupling between the α-spin LUMO of the ML+ fragment and the HOMO-1 of the SC6F5− fragment remains similar for all complexes in this series.
All α-spin metal 3d-based orbitals are occupied and cannot contribute to covalent bonding with the thiolate ligand donor orbitals. Thus, the π component to the bond orders from α-spin MOs, is close to zero. Zn(II) has a filled d10 shell, so its α- and β- spin orbital contributions to bond orders are equal and the M-S bond covalency is limited to the Zn 4s,4p – thiolate pσ orbital interactions.
The indices provide a useful baseline for observing changes in β-spin MO σ and π contributions to the bond orders. As has been discussed in Section 4.2, the increasing (from Mn(II) to Zn(II)) results in the stabilization of M 3d-based molecular orbitals and makes the M 3d-thiolate covalency stronger, given that the electron occupancy of the appropriate MOs allows the net contribution to be positive. This is the case for the σ component, in going from Mn(II) to Fe(II) to Co(II), and for the π component, when proceeding from Mn(II) to Cu(II). These changes in σ- and π-components of the covalent bonding between the metal and the thiolate produce the observed net bond order trends with a local maximum at Co(II) and a global maximum at Cu(II).
If the metal-thiolate bonding in the [ML(SC6F5)] complexes were limited to only covalent interactions, the calculated bond orders would directly correlate with the metal-thiolate bond energies and, thus, we would observe the maxima of the metal-thiolate bond energies at Co(II) and Cu(II) (notice the correlation between the M-S bond orders and Eint-Eionic, Figure 10). However, this is not the case (Figure 6). While the Co complex shows the second largest metal-thiolate binging energy, the absolute maximum is observed for the Zn complex, not for the Cu complex. This indicates that the ionic contribution, along with the covalent component to the bond energy, plays an important role in determining the overall strength of the metal-thiolate interaction (Figure 10C): ~44% ionic/ 56% covalent in Mn(II), becoming more and more covalent (with maxima at Co(II) for σ-type bonding and at Cu(II) for π type), and back to ~50% ionic / 50% covalent in Zn(II).
5. Discussion
Important spectral trends are observed in the series of metal-thiolate model complexes [ML(SC6F5)] both experimentally and computationally (TD-DFT). The intense S(thiolate) pπ → M dx2−y2 (M = Cu, Ni, Co, and Fe) charge transfer transition shifts to higher energy in going from Cu → Ni → Co → Fe. The intensity of this charge transfer transition decreases along the series, Cu → Ni → Co → Fe, due to reduced M 3d-thiolate covalency, supported by the decrease in the pre-edge intensity in the S K-edge XAS data and in MO calculations. An important feature is observed in the cobalt complex, the S(thiolate) pσ → Co dxy charge transfer transition is now present and more intense relative to the S(thiolate) pπ → Co dx2−y2 charge transfer transition. This is consistent with its ground state electronic structure description (from DFT calculations), indicating the strong interaction between Co dxy and the S(thiolate) pσ orbitals. Similar to the trend in the S(thiolate) pπ → M dx2−y2 CT transition, the S(thiolate) pσ → M dxy CT transition shifts to higher energy and decreases in intensity in going from Co to Fe to Mn.
To obtain insight into the variation in the observed spectral features, arising due to the different metal - thiolate interactions in these complexes, trends in the metal - thiolate bonding were evaluated using DFT methods. These calculations indicate that the observed variations in geometry, spectra and bond energies of the metal-thiolate complexes can be explained by changes in the nature of metal-thiolate interactions.
5.1 Covalent bonding
The covalent bonding due to the metal 4s,4p - thiolate interactions is dominant in this metal-thiolate series and its strength remains approximately the same over the series. This is reflected by the σ bond component to the bond orders from α-MOs, (Figure 10A), and the observation that the α-spin occupied molecular orbitals of each [ML(SC6F5)] complex contain 26–32 % of the unoccupied molecular orbitals of the ML+ fragment (Table 2).
Additional small σ bond and larger π bond contributions to the covalent bonding are due to M dxy - pσ thiolate and M dx2−y2 - pπ thiolate orbital interactions, respectively. These additional interactions grow stronger when going from Mn(II) to Co(II) (the σ contribution) and to Cu(II) (the π contribution). The observed changes in the d(M)- thiolate orbital interactions are caused by a monotonic increase of effective nuclear charge of the metal atom in going from Mn(II) to Zn(II) and the increasing electron population of β-spin 3d orbitals (d5→d10). The higher effective nuclear charge of the metal atom brings the energies of the dxy and dx2−y2 orbitals of the metal atom closer to the thiolate occupied orbitals and favors covalent M 3d-thiolate interactions.
5.2 Ionic bonding
The ionic bonding plays an important role in determining the overall strength of the ML+-SC6F5− interaction. It contributes ~45% and 50% to the ML+-SC6F5− bond energy in Mn(II) and Zn(II), respectively (Figure 10C).
The higher effective nuclear charge of the metal atom favors covalent metal-thiolate interactions but it also causes a decrease in metal ionic radii. The latter would cause a gradual increase in the ionic component of the ML+-SC6F5−1 bond energy in going from Mn(II) to Zn(II) if the M-S covalency remained the same. However, this effect is obscured by the changes in the M-S covalency which results in charge donation from the thiolate ligand to the ML+ fragment (Figure 10B). Thus, the covalency causes the metal charge to decrease to less positive values and the sulfur charge to become less negative (Figure 6D), thus, reducing the ionic component of the M-S bond energy (Figure 10C). Thus, there is a compensating effect: as the covalent contribution to the metal-thiolate bonding increases, the ionic contribution decreases. An important implication for the [ML(SC6F5)] complexes is that the metal-thiolate binding energy shows little variation over this series. The two metal-thiolate complexes, [CuL(SC6F5)] and [ZnL(SC6F5)], have similar metal-thiolate bonding parameters (Eo, k, dM-S), yet only [CuL(SC6F5)] shows a very intense low-energy CT band, reflecting the high covalency of the cupric complex which is not present in the zinc complex.
5.3 Periodic Trends
As discussed above, the character of the metal-thiolate bonding becomes more covalent, in going from Mn(II) to Cu(II), reaching maxima at Co(II) and Cu(II). As a result, the metal-sulfur bond length decreases from 2.39 Å (Mn) to 2.18 Å (Cu) and the force constant increases from 1.13 to 1.43 mDyne Å−1. The other parameters of the metalthiolate bond, Eo and Eint, show a trend toward greater binding as we move from Mn to Zn. However, the fine structure of the binding energy curve (Figure 6) is more complex since Eint is a sum of two contributions which are linked through charge transfer and compensate each other (Figure 10C).
The metal-thiolate force constant is very similar in [CuL(SC6F5)] and [ZnL(SC6F5)]. The Zn complex shows a longer M-S bond distance than the Cu complex, however the calculated metal-thiolate interaction energy in the Zn complex is 2 kcal mol−1 stronger than in for the Cu complex with the largest M-S covalency. For the Zn complex, the M 3d - thiolate covalency is lost (all 3d orbitals are occupied) and the remaining M 4s,4p - thiolate covalency contributes only ~50% to the metal-thiolate interaction energy. This large ionic contribution compensates for the lost M-S covalency and results in the strongest metal-thiolate bond in this series (Figure 6B and Figure 10). The lack of a correlation between bond strength and length (see Figure 6) for the Cu vs. Zn complex reflects the differences in distance dependence of the ionic vs. covalent contributions to bonding. In such a case, the general correlation of the bond energy, length, and the force constant does not hold.
5.4 The Irving-Williams Series
If the successive stability constants of complexes of divalent ions of the first transition series are plotted against the atomic number of the element, there is a monotonic increase to a maximum at Cu irrespective of the nature of the ligand.16–18 This order was explained by Irving and Williams17 as a consequence of the fact that the two parameters, which serve as a guide to the magnitude of the ionic (electrostatic) and covalent interactions (the reciprocal of the metal ionic radius and the sum of the first two ionization energies, respectively) both increase monotonically throughout the series from Mn to Cu, and then decrease in going from Cu to Zn. Thus, if water is replaced from [M(OH2)n]2+ by a ligand of better electron-donating power, the gain in stability will increase with the ionization potential of the metal. If H2O is replaced by a ligand with a formal negative charge, the stability gain through electrostatic forces will increase as the radius of the metal cation decreases.
Figure 6B shows that the metal-thiolate binding energies in [ML(SC6F5)] do not show the trend expected for the Irving-Williams series. The calculated binding energy varies from −126.8 kcal mol−1 (Mn) to −130.8 kcal mol−1 (Cu), to −132.7 kcal mol−1 (Zn). As we discussed in Section 5.2 and shown in Figure 10C, this is a result of the compensating effect in the metal-thiolate complexes where the covalent contribution to bonding is comparable in magnitude with the ionic contribution to bonding.
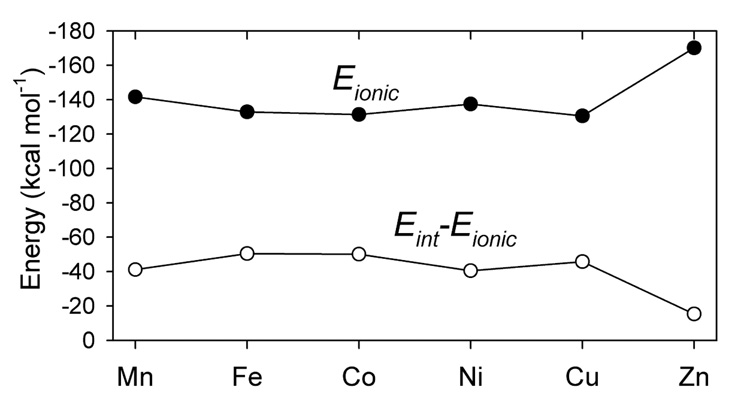
In order to explain the Irving-Williams series, we have also analyzed the metal-ligand bonding in a series of [ML(F)] (where L= HB(pz)3−) complexes where the fluoride models the 4th ligand being replaced by the thiolate. Our analysis indicates that the metal-ligand bonding in these complexes is dominated by the ionic contribution (compare Figure 10C and Figure 11) and the metal-fluoride binding energy (Figure S5) decreases from −176.4 kcal mol−1 (Mn) to −166.1 kcal mol−1 (Cu) and then increases to −176.6 kcal mol−1 (Zn). This variation in the binding energy is a result of the increasing metal-ligand covalency in going from Mn to Cu which reduces the ionic interaction (Figures S6 and S7).
Figure 11.
The ionic component of the ML+-F− bonding energy, Eionic, and the difference, Eint – Eionic, in the [ML(F)] complexes.
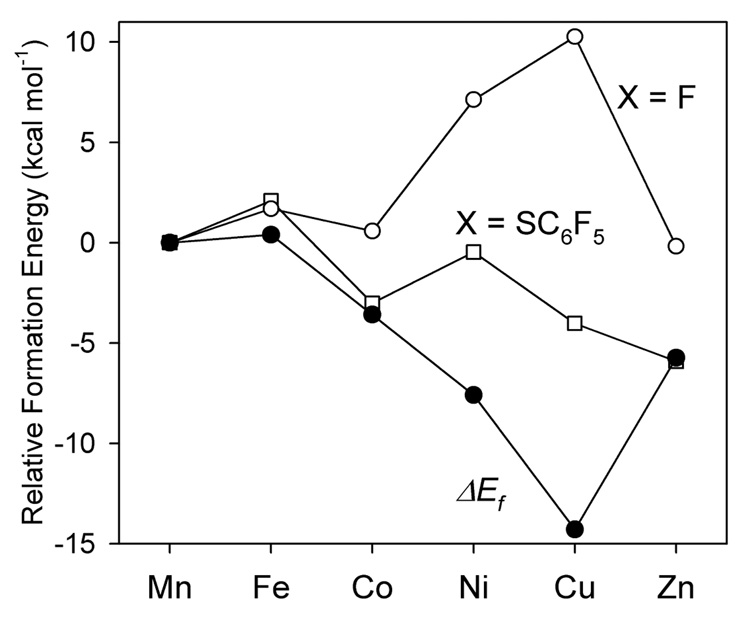
However, because of the dominant ionic contribution to bonding in the [ML(F)] series, the compensating effect of the increasing covalent bonding contribution is not as large as in the [ML(SC6F5)] series. As a result, the difference between the relative formation energies of the metal-thiolate complexes and the metal-fluoride complexes,
shows the Mn ≈ Fe > Co > Ni > Cu < Zn progression (Figure 12) which is the Irving-Williams series. Moreover, stability constants of the metal-thiolate complexes calculated from the binding energy differences are consistent with the experimentally observed quantities.16–18
Figure 12.
The relative formation energies (kcal mol−1) of the metal-thiolate complexes, [ML(SC6F5)], and the metal-fluoride complexes, [ML(F)], and their difference, ΔEf.
Thus, the “softer” thiolate ligand can have comparable covalent and ionic contributions to bonding and these compensate to produce little change in binding energy over the series of metal ions (open squares in Figure 12). For the “harder” ligands (F−1, OH−1, H2O, etc.), the ionic term dominates and their binding energies are affected by changes in covalency over the series (open circles in Figure 12). It is the competition between these behaviors that produces the Irving-Williams series (solid circles in Figure 12) in stability constants.
Supplementary Material
Listings of the optimized structures, a summary of calculated electronic parameters, calculated IR spectra, the rR spectrum of [NiL(SC6F5)] (excitation wavelength λo 351 nm), and molecular orbital interaction diagrams for [CuL(SC6F5)] and [ZnL(SC6F5)]. This material is available free of charge via the Internet at http://pubs.acs.org.
Acknowledgements
This research is supported by NSF grant #9980549 (E.I.S.), NIH grant RR-01209 (K.O.H.), and JSPS grant #14350471 (K.F.). SSRL operations are funded by the Department of Energy Office of Basic Energy Sciences. The SSRL Structural Molecular Biology program is supported by the National Institute of Health, National center for Research Resources, Biomedical Technology Program and by the Department of Energy, Office of Biological and Environmental Research. S.I.G. is grateful to NSERC (Ottawa) for a postdoctoral fellowship.
Footnotes
These are free-ions values. Covalent reduction of these (due to the relativistic nephelauxetic effect) is small. (55) Neese, F.; Solomon, E. I. Inorg. Chem. 1998, 37, 6568.
References
- 1.Solomon EI, Szilagyi RK, George SD, Basumallick L. Chem. Rev. 2004;104:419. doi: 10.1021/cr0206317. [DOI] [PubMed] [Google Scholar]
- 2.Gewirth AA, Cohen SL, Schugar HJ, Solomon EI. Inorg. Chem. 1987;26:1133. [Google Scholar]
- 3.Gewirth AA, Solomon EI. J. Am. Chem. Soc. 1988;110:3811. [Google Scholar]
- 4.McMillin DR, Rosenberg RC, Gray HB. Proc. Natl. Acad. Sci. U.S.A. 1974;71:4760. doi: 10.1073/pnas.71.12.4760. [DOI] [PMC free article] [PubMed] [Google Scholar]
- 5.Tennent DL, McMillin DR. J. Amer. Chem. Soc. 1979;101:2307. [Google Scholar]
- 6.Nar H, Huber R, Messerschmidt A, Filippou AC, Barth M, Jaquinod M, van de Kamp M, Canters GW. Eur. J. Biochem. 1992;205:1123. doi: 10.1111/j.1432-1033.1992.tb16881.x. [DOI] [PubMed] [Google Scholar]
- 7.Di Bilio AJ, Chang TK, Malmström BG, Gray HB, Goran Karlsson B, Nordling M, Pascher T, Lundberg LG. Inorg. Chim. Acta. 1992;198–200:145. [Google Scholar]
- 8.Bonander N, Vänngård T, Tsai L-C, Langer V, Nar H, Sjölin L. Proteins: Struct., Funct., Genet. 1997;27:385. doi: 10.1002/(sici)1097-0134(199703)27:3<385::aid-prot6>3.0.co;2-c. [DOI] [PubMed] [Google Scholar]
- 9.Moratal JM, Romero A, Salgado J, Perales-Alarcon A, Jimenez HR. Eur. J. Biochem. 1995;228:653. doi: 10.1111/j.1432-1033.1995.tb20305.x. [DOI] [PubMed] [Google Scholar]
- 10.Chen Z-W, Barber MJ, McIntire WS, Mathews FS. Acta Crystallogr. 1998;D54:253. doi: 10.1107/s0907444997011505. [DOI] [PubMed] [Google Scholar]
- 11.Funk T, Kennepohl P, Di Bilio AJ, Wehbi WA, Young AT, Friedrich S, Arenholz E, Gray HB, Cramer SP. J. Am. Chem. Soc. 2004;126:5859. doi: 10.1021/ja036218d. [DOI] [PubMed] [Google Scholar]
- 12.Jimenez HR, Salgado J, Moratal JM, Morgenstern-Badarau I. Inorg. Chem. 1996;35:2737. [Google Scholar]
- 13.De Kerpel JOA, Pierloot K, Ryde U. J. Phys. Chem. B. 1999;103:8375. [Google Scholar]
- 14.Kitajima N, Fujisawa K, Tanaka M, Moro-Oka Y. J. Am. Chem. Soc. 1992;114:9232. [Google Scholar]
- 15.Matsunaga Y, Fujisawa K, Ibi N, Miyashita Y, Okamoto K. Inorg. Chem. 2005;44:325. doi: 10.1021/ic049814x. [DOI] [PubMed] [Google Scholar]
- 16.Irving H, Williams RJP. Nature. 1948;162:746. [Google Scholar]
- 17.Irving H, Williams RJP. J. Chem. Soc. 1953:3192. [Google Scholar]
- 18.Irving H, Williams RJP. Nature. 1954;1948:746. [Google Scholar]
- 19.Hedman B, Frank P, Gheller SF, Roe AL, Newton WE, Hodgson KO. J. Am. Chem. Soc. 1988;110:3798. [Google Scholar]
- 20.Stern EA, Heald SM. Rev. Sci. Instrum. 1979;50:1579. doi: 10.1063/1.1135763. [DOI] [PubMed] [Google Scholar]
- 21.Lytle FW, Greegor RB, Sandstrom DR, Marques EC, Wong J, Spiro CL, Huffman GP, Huggins FE. Nucl. Instrum. Methods. 1984;226:542. [Google Scholar]
- 22.Rose K, Shadle SE, Glaser T, de Vries S, Cherepanov A, Canters GW, Hedman B, Hodgson KO, Solomon EI. J. Am. Chem. Soc. 1999;121:2353. [Google Scholar]
- 23.Ellis PJ, Freeman HC. J. Synchrotron. Rad. 1995;2:190. doi: 10.1107/S0909049595006789. [DOI] [PubMed] [Google Scholar]
- 24.George GN. EDG_FIT. Stanford, CA: Stanford Synchrotron Radiation Laboratory, Stanford Linear Accelerator Center, Stanford University; 2000. 94309. [Google Scholar]
- 25.Frisch MJ, Trucks GW, Schlegel HB, Scuseria GE, Robb MA, Cheeseman JR, Montgomery JJA, Vreven T, Kudin KN, Burant JC, Millam JM, Lyengar SS, Tomasi J, Barone V, Mennucci B, Cossi M, Scalmani G, Rega N, Petersson GA, Nakatsuji H, Hada M, Ehara M, Toyota K, Fukuda R, Hasegawa J, Ishida M, Nakajima T, Honda Y, Kitao O, Nakai H, Klene M, Li X, Knox JE, Hratchian HP, Cross JB, Adamo C, Jaramillo J, Gomperts R, Stratmann RE, Yazyev O, Austin AJ, Cammi R, Pomelli C, Ochterski JW, Ayala PY, Morokuma K, Voth GA, Salvador P, Dannenberg JJ, Zakrzewski VG, Dapprich S, Daniels AD, Strain MC, Farkas O, Malick DK, Rabuck AD, Raghavachari K, Foresman JB, Ortiz JV, Cui Q, Baboul AG, Clifford S, Cioslowski J, Stefanov BB, Liu G, Liashenko A, Piskorz P, Komaromi I, Martin RL, Fox DJ, Keith T, Al-Laham MA, Peng CY, Nanayakkara A, Challacombe M, Gill PMW, Johnson B, Chen W, Wong MW, Gonzalez C, Pople JA. Gaussian 03, Revision C.01 [Google Scholar]
- 26.Perdew JP. Phys. Rev. B. 1986;33:8822. doi: 10.1103/physrevb.33.8822. [DOI] [PubMed] [Google Scholar]
- 27.Becke AD. Phys. Rev. A. 1988;38:3098. doi: 10.1103/physreva.38.3098. [DOI] [PubMed] [Google Scholar]
- 28.Becke AD. J. Chem. Phys. 1993;98:5648. [Google Scholar]
- 29.Gorelsky SI. SWizard program. http://www.sg-chem.net.
- 30.Boys SF, Bernardi F. Mol. Phys. 1970;19:553. [Google Scholar]
- 31.Bickelhaupt FM, Baerends EJ. Rev. Comput. Chem. 2000;15:1. [Google Scholar]
- 32.Morokuma K. J. Chem. Phys. 1971;55:1236. [Google Scholar]
- 33.Kitaura K, Morokuma K. Int. J. Quantum Chem. 1976;10:325. [Google Scholar]
- 34.Chen W, Gordon MS. J. Phys. Chem. 1996;100:14316. [Google Scholar]
- 35.Umeyama H, Morokuma K. J. Am. Chem. Soc. 1977;99:1316. [Google Scholar]
- 36.Ziegler T, Rauk A. Theoret. Chim. Acta. 1977;46:1. [Google Scholar]
- 37.Gorelsky SI. AOMix program. http://www.sg-chem.net.
- 38.Gorelsky SI, Lever ABP. J. Organomet. Chem. 2001;635:187. [Google Scholar]
- 39.Mulliken RS. J. Chem. Phys. 1955;23:1833. [Google Scholar]
- 40.Mulliken RS. J. Chem. Phys. 1955;23:1841. [Google Scholar]
- 41.Mulliken RS. J. Chem. Phys. 1955;23:2338. [Google Scholar]
- 42.Mulliken RS. J. Chem. Phys. 1955;23:2343. [Google Scholar]
- 43.Reed AE, Weinstock RB, Weinhold F. J. Chem. Phys. 1985;83:735. [Google Scholar]
- 44.Lowdin P-O. Adv. Quantum. Phys. 1970;5:185. [Google Scholar]
- 45.Dapprich S, Frenking G. J. Phys. Chem. 1995;99:9352. [Google Scholar]
- 46.Gorelsky SI, Solomon EI. to be published. [Google Scholar]
- 47.Schafer A, Huber C, Ahlrichs R. J. Chem. Phys. 1994;100:5829. [Google Scholar]
- 48.Mayer I. Chem. Phys. Lett. 1983;97:270. [Google Scholar]
- 49.Mayer I. Theoret. Chim. Acta. 1985;67:315. [Google Scholar]
- 50.Mayer I. Int. J. Quantum Chem. 1986;29:73. [Google Scholar]
- 51.Mayer I. Int. J. Quantum Chem. 1986;29:477. [Google Scholar]
- 52.Casida ME. In: Recent Advances in Density Functional Methods. Chong DP, editor. Singapore: World Scientific; 1999. p. 155. [Google Scholar]
- 53.Stratmann RE, Scuseria GE, Frisch MJ. J. Chem. Phys. 1998;109:8218. [Google Scholar]
- 54.Gorelsky SI. In: Comprehensive Coordination Chemistry-II. McCleverty JA, Meyer TJ, editors. Vol. 2. Amsterdam: Elsevier; 2004. p. 467. [Google Scholar]
- 55.Neese F, Solomon EI. Inorg. Chem. 1998;37:6568. doi: 10.1021/ic980948i. [DOI] [PubMed] [Google Scholar]
- 56.Lever ABP. Inorganic Electronic Spectroscopy. 2 ed. Amsterdam: Elsevier; 1984. [Google Scholar]
- 57.Randall DW, DeBeer George S, Hedman B, Hodgson KO, Fujisawa K, Solomon EI. J. Am. Chem. Soc. 2000;122:11620. [Google Scholar]
- 58.Blair DF, Campbell GW, Schoonover JR, Chan SI, Gray HB, Malmstrom BG, Pecht I, Swanson BI, Woodruff WH, Cho WK, English AM, Fry HA, Lum V, Norton KA. J. Am. Chem. Soc. 1985;107:5755. [Google Scholar]
- 59.Shadle SE, Penner-Hahn JE, Schugar HJ, Hedman B, Hodgson KO, Solomon EI. J. Am. Chem. Soc. 1993;115:767. [Google Scholar]
- 60.Shadle SE, Hedman B, Hodgson KO, Solomon EI. J. Am. Chem. Soc. 1995;117:2259. doi: 10.1021/ja002183v. [DOI] [PubMed] [Google Scholar]
- 61.DeBeer George S, Metz M, Szilagyi RK, Wang HX, Cramer SP, Lu Y, Tolman WB, Hedman B, Hodgson KO, Solomon EI. J. Am. Chem. Soc. 2001;123:5757. doi: 10.1021/ja004109i. [DOI] [PubMed] [Google Scholar]
- 62.Karpishin TB, Gebhard MS, Solomon EI, Raymond KN. J. Amer. Chem. Soc. 1991;113:2977. [Google Scholar]
- 63.Ferguson J. Prog. Inorg. Chem. 1970;12:159. [Google Scholar]
- 64.Shadle SE, Hedman B, Hodgson KO, Solomon EI. Inorg. Chem. 1944;33:4235. [Google Scholar]
Associated Data
This section collects any data citations, data availability statements, or supplementary materials included in this article.
Supplementary Materials
Listings of the optimized structures, a summary of calculated electronic parameters, calculated IR spectra, the rR spectrum of [NiL(SC6F5)] (excitation wavelength λo 351 nm), and molecular orbital interaction diagrams for [CuL(SC6F5)] and [ZnL(SC6F5)]. This material is available free of charge via the Internet at http://pubs.acs.org.


