

Abstract
A central goal in cognitive and developmental science is to develop models of behavior that can generalize across both tasks and development while maintaining a commitment to detailed behavioral prediction. This paper presents tests of one such model, the Dynamic Field Theory (DFT). The DFT was originally proposed to capture delay-dependent biases in spatial recall and developmental changes in spatial recall performance. More recently, the theory was generalized to adults’ performance in a second spatial working memory task, position discrimination. Here we use the theory to predict a specific, complex developmental pattern in position discrimination. Data with 3- to 6-year-old children and adults confirm these predictions, demonstrating that the DFT achieves generality across tasks and time scales, as well as the specificity necessary to generate novel, falsifiable predictions.
Introduction
A central goal in cognitive and developmental science is to develop models that capture the richness of human behavior in specific situations and make behavioral predictions that span across situations. Although many models do an excellent job capturing the specific details of behavior, most models are exclusively linked to a single task and thus have relatively limited generalizability (for discussion of this concern in categorization see, e.g. Murphy, 2002). This is not a criticism of existing models: it is difficult to capture the details of performance in a single task, let alone generalize across multiple tasks (for one exception, see Love, Medin & Gureckis, 2004). And generalization over time – for instance, over the time scale of development – can be even more challenging. Thus, although theoretical specificity is an essential goal in cognitive and developmental science, it often comes at the cost of generalization.
There are a handful of formal models that have confronted this challenge, speaking to the processes that underlie behavior, while still addressing multiple tasks and time scales (e.g. Huttenlocher, Hedges & Duncan, 1991; Morton & Munakata, 2002). The research presented here seeks to build on the lofty goals set by such models while staying grounded in the specificity that is the hallmark of cognitive models. In particular, we report theoretical and empirical work that has generalized a Dynamic Field Theory (DFT) of spatial cognition across development as well as beyond the spatial recall task that was central to establishing this theory.
In this paper, we focus on two behaviors – spatial recall and position discrimination – with children and adults. In particular, we focus on the effects of perceived reference frames in these two tasks. In spatial recall, memory for targets near reference frames shows systematic distortions, referred to as geometric biases (e.g. Huttenlocher et al., 1991). These biases show a striking developmental pattern: early in development, children show memory biases toward frames of reference, whereas older children and adults show biases away from reference frames (Huttenlocher, Newcombe & Sandberg, 1994; Schutte & Spencer, 2002; Spencer, Simmering, Schutte & Schöner, 2007). The dominant account of this developmental transition uses the Category Adjustment model proposed by Huttenlocher and colleagues (1991; see Conclusions for further discussion of this model). According to this account, young children treat large spaces as a single category and are biased toward the center of the space, whereas older children and adults sub-divide large spaces into two categories and show biases toward the centers of the left and right regions. Although this account proposes a specific developmental change to account for the transition, there is no underlying developmental mechanism that explains how this change occurs.
Visual reference frames also influence position discrimination performance: adults show enhanced discrimination near frames of reference, with psychophysical models as the dominant account of performance (e.g. Kinchla, 1971). More recently, we demonstrated geometric-like effects in discrimination, with asymmetries based on whether discrimination was tested in the direction of geometric biases or in the opposite direction (Simmering, Spencer & Schöner, 2006). These data show continuity across position discrimination and spatial recall, suggesting that a single framework may capture performance in both tasks.
In the sections that follow, we review the established behavioral effects in both spatial recall and position discrimination, as well as how the DFT can account for performance in both tasks. We also describe a specific developmental mechanism that captures the emergence of the adult-like pattern of geometric biases in spatial recall. We then combine our existing accounts of the development of spatial recall and adults’ position discrimination performance to generate an ensemble of specific behavioral predictions regarding the development of position discrimination performance in young children. Empirical data with 3- to 6-year-old children and adults confirm the pattern of results predicted by the theory. This study provides an important step in this line of research, demonstrating that the DFT offers generality across tasks and time scales without sacrificing specificity. We conclude by considering implications of our theoretical and empirical work for other models in cognitive and developmental science.
Overview of DFT and generation of novel model predictions
The Dynamic Field Theory is a process-based theory of spatial cognition instantiated in a neural network model that captures children’s and adults’ performance in spatial working memory tasks (for a complete description of the theory, see Spencer et al., 2007; see also Simmering, Schutte & Spencer, 2008). Our use of dynamic fields derives from Amari’s initial work on the dynamics of cortical maps (Bastian, Riehle, Erlhagen & Schöner, 1998; Bastian, Schöner & Riehle, 2003; Erlhagen, Bastian, Jancke, Riehle & Schöner, 1999; Jancke, Erlhagen, Dinse, Akhavan, Giese, Steinhage & Schöner, 1999), as well as initial applications of this theoretical framework to motor planning (Erlhagen & Schöner, 2002; Kopecz & Schöner, 1995; Thelen, Schöner, Scheier & Smith, 2001; Wilimzig, Schneider & Schöner, 2006). In addition to the spatial cognition application we describe here, this framework has also been extended to address the real-time processes that underlie the use and maintenance of non-spatial features in visual working memory (Johnson, Spencer & Schöner, 2006, in press), the processes that drive infant habituation (Schöner & Thelen, 2006) and infant categorization (Perone, Spencer & Schöner, 2007), as well as the cognitive processes that underlie the flexible behavior of autonomous robots (Bicho, Mallet & Schöner, 2000).
In the present report, we focus on the dynamics of three layers of spatially tuned neurons from our more general theory (see Spencer et al., 2007). These three layers are shown in Figure 1: a perceptual field (PF; Figure 1A), a spatial working memory field (SWM; Figure 1C), and a shared inhibitory field (Figure 1B). In each field, the x-axis consists of a collection of spatially tuned neurons; the y-axis shows each neuron’s activation level; lastly, time is captured along the z-axis, beginning at the front of the figure. These layers pass excitation and inhibition as indicated by solid and dashed arrows, respectively. Activation from a retinal field (not shown) is passed strongly to PF, and more weakly to SWM. Neurons within PF and SWM have locally excitatory interactions, while lateral inhibition is mediated by the shared layer of interneurons (Amari, 1977). These locally excitatory and laterally inhibitory interactions enable PF and SWM to form self-sustaining ‘peaks’ of activation that maintain themselves in the absence of input (though the ability of PF to do this is limited due to interactions with SWM; see below). This three-layer structure is inspired by the cytoarchitecture of visual cortex (Douglas & Martin, 1998; for a related architecture, see Edin, Macoveanu, Olesen, Tegnér & Klingberg, 2007). The following sections describe how the DFT captures the development of spatial recall, how it has been generalized to a second spatial working memory task, and how these lines of research can be combined to generate novel predictions regarding the development of children’s position discrimination abilities.
Figure 1.

A simulation of the dynamic field theory performing one spatial recall trial with adult (A–C) and child (D–F) parameter settings. In each panel, location is along the x-axis, activation along the y-axis, and time along the z-axis. Solid and dashed arrows show excitatory and inhibitory connections between layers (respectively). The target was presented at 35° for 2 s, followed by a 10 s delay. The reference frame (midline) was presented continuously at 0°. See text for details.
Generalizing the DFT across time scales: the development of spatial recall
In spatial recall tasks, participants see a target location which they must remember for a short delay (e.g. 5–20 s) before reproducing the remembered location. Adults show systematic ‘geometric’ biases in such tasks: responses aligned with visible edges and symmetry axes are accurate, whereas responses to targets on either side of such reference axes are biased away from the axes over delay (e.g. Engebretson & Huttenlocher, 1996; Spencer & Hund, 2002; Tversky & Schiano, 1989; Werner & Diedrichsen, 2002). For instance, when adults remember a location to the left of the midline symmetry axis of a large table, they show biases away from midline that increase over delays (e.g. Spencer & Hund, 2002).
Figure 1A–C shows the DFT performing a single recall trial with ‘adult’ parameters. When the target is presented, neurons tuned to respond to the stimulated location become active in PF and SWM (see T in Figure 1A and 1C). Because neurons in SWM have stronger interactions, the SWM peak self-sustains after the target input is removed, maintaining target information during the delay (see Figure 1C). At the same time, input from perceived reference frames in the task space – in this case, the midline symmetry axis – leads to a reference peak at 0° (see R in Figure 1A). If the target peak in SWM is aligned with the reference input to PF (i.e. the target is presented at midline), the SWM peak remains stably positioned over the delay and the model responds accurately. If the target peak is not aligned with the reference, however, the lateral inhibition associated with the reference peak repels the target peak in SWM away from the reference axis. This occurs due to the shared inhibitory layer (see Figure 1B): because the model is simultaneously holding a reference peak in PF and a target peak in SWM, inhibition from the reference peak ‘repels’ the target peak in the opposite direction – away from midline – over delay (see ‘drift away from midline’ in Figure 1C). The reference peak, on the other hand, remains stably centered at 0° due to the continued visual input from midline.
Young children show markedly different biases in spatial recall tasks – they show bias toward reference frames. Specifically, 2- to 3-year-olds show strong attraction toward the midline symmetry axis across a wide range of spatial locations (Huttenlocher et al., 1994; Schutte & Spencer, 2002; Schutte, Spencer & Schöner, 2003). This pattern of bias changes gradually over development. First, attraction narrows such that children’s responses to locations far from midline show no attraction, while closer locations show robust attraction (Schutte, 2004; Schutte & Spencer, 2008). When bias away from midline first emerges, it is localized to certain regions of space (i.e. 20° from midline). Eventually, the region of repulsion expands such that, by 6 years of age, children show biases away from midline from 10–60° on either side of midline (Hund & Spencer, 2003; Spencer & Hund, 2003).
To account for this developmental transition, Spencer and colleagues proposed the spatial precision hypothesis (see Schutte et al., 2003; Spencer & Hund, 2003). This hypothesis posits that early in development, locally excitatory neural interactions are broad with weak lateral inhibition. Over development, excitation narrows (i.e. becomes more precise) as both excitatory and inhibitory interactions strengthen (for support for this type of neural change in cortex over development, see Edin et al., 2007). Importantly, this type of change does not modify the basic architecture of the model, nor does it require the addition of a new module or computational unit; rather, small quantitative changes in neural interaction yield both quantitative and qualitative changes in the ‘behavioral states’ of the model over development (see Simmering et al., 2008, for further discussion). For instance, when implemented in the DFT, the spatial precision hypothesis gives rise to the qualitative developmental shift in recall biases.
Figure 1 D–F shows the DFT performing a recall trial with ‘child’ parameters, that is, with a relatively broad and weak local excitation/lateral inhibition profile. As with the adult parameters, the presentation of the target input forms a self-sustaining target peak in SWM (see Figure 1F). During the delay, however, performance with the child and adult parameters diverges. Although there is reference input during the delay (to capture continued perception of the midline symmetry axis), reference-related input to PF produces broad, diffuse activation with the child parameters – there is not enough focused excitation and inhibition to create a reference peak (Figure 1D). Because activation in PF fails to form a reference peak, there is no reference-related inhibition to repel the SWM peak. Instead, excitatory input to PF attracts the SWM peak across a broad spatial range (see ‘drift toward midline’ in Figure 1F). Gradually over development, excitation becomes stronger and narrower, which narrows the attraction effect. Eventually, neural interactions in PF become strong enough to create a reference-related peak and repulsion emerges in recall. As interactions strengthen further, the repulsion effect increases and extends across a broad spatial range (see Schutte, 2004; Spencer et al., 2007).
In summary, the DFT captures delay-dependent geometric biases in adults’ spatial recall performance. When the spatial precision hypothesis is implemented in this theoretical framework, the theory effectively captures the delay-dependent geometric biases in children’s recall performance as well. Thus, this dynamic field account of spatial recall performance generalizes across multiple time scales (for other developmental changes captured by the spatial precision hypothesis, see Schutte et al., 2003; Spencer, Simmering & Schutte, 2006; Simmering et al., in press).
Generalizing the DFT across tasks: position discrimination
Recently, we have also generalized the DFT to capture performance in a second spatial working memory task – position discrimination (Simmering et al., 2006). In this task, two stimuli are presented in quick succession and participants judge whether the stimuli were in the same or different locations. Although both spatial recall and position discrimination are spatial working memory tasks, these tasks have not previously been united within a single framework. Discrimination has typically been studied in adults and described with psychophysical models that fail to generalize to recall performance (see Simmering et al., 2006, for discussion; see also, Werner & Diedrichsen, 2002). Conversely, models of spatial recall have failed to capture discrimination performance. One likely reason that these tasks have not been previously modelled within a single theoretical framework is that position discrimination is viewed as more of a perceptual task due to the brief presentation of the two stimuli. Moreover, the tasks require different response types – a same versus different judgment in discrimination and a pointing response in recall.
The first difference across tasks – the quick presentation of two stimuli versus the longer presentation of a single stimulus – is straightforward to address in the DFT: because the model operates in real time, we can simply present two inputs to the model at the appropriate times. The second difference – the difference in response type – presents more substantive challenges for formal models because most models are designed to generate only one type of response. As we demonstrate below, however, the dynamic interplay between PF and SWM in the DFT can lead to emergent same and different decisions with relatively little modification. To achieve the same/different response in the DFT, we added two bi-stable neurons that are dedicated to these labels (i.e. when the same node receives strong input, it goes into a self-sustaining state that represents the generation of this response). This allows the model to generate an explicit response on each discrimination trial (see below).
Figure 2 shows the adult parameters in the DFT producing a same response in position discrimination. Note that the simulations in Figures 2-4 were generated using identical model parameters that produced the adult recall responses in Figure 1, with the addition of response nodes. As this figure shows, the different node is coupled to PF, and the same node is coupled to SWM. Activation from these fields is summed across the spatial dimension and passed to the respective nodes. When the nodes’ activation rises above threshold, they compete with one another such that only one response is generated – a winner-take-all type of interaction. The winner then projects global excitation back to the coupled field, stabilizing the current response and maintaining current activation in the relevant field (PF for the different node; SWM for the same node). To capture the task instructions, we keep the resting level of the response nodes low before the response is required (i.e. at the beginning of the trial); when the response is prompted, we raise the resting level of the nodes.
Figure 2.

A simulation of the DFT responding same in a position discrimination trial. S1 and S2 were presented at 35° for 1 s each, with a 1 s delay in between. Panels A–C show the same three fields as Figure 1 (axes and arrows are as in Figure 1), with the addition of response nodes: PF is coupled to the different (D) node, and SWM to the same (S) node; these nodes mutually inhibit one another. Panels D–G show time-slices through PF and SWM at the end of the delay (D, E) and at response (F, G). Horizontal dotted lines in these panels indicate the zero threshold; arrows specify stimulus locations, and vertical dashed lines mark the position of S1 for comparison. Note that, for simplicity, we did not include reference input in these simulations.
Figure 4.

The influence of directional drift on position discrimination in the DFT using adult parameters. Panels A–F show time-slices through PF and SWM at the end of the delay (A, B) and at response when S2 was presented away from midline (C, D) or toward midline (E, F). Axes and arrows are as in Figure 2D–G. Behavioral predictions (G–I) show differences for targets near versus far from midline (x-axis), and when S2 is presented toward (solid line) versus away (dashed line) from midline. Low discrimination thresholds (along the y-axis) correspond to better performance. See text for further details.
For the simulation in Figure 2, both S1 and S2 were presented at 35° (without midline input, for simplicity). Figure 2A–C shows the same three layers from the recall simulations in Figure 1; we have also added time-slices through PF (Figure 2D, F) and SWM (Figure 2E, G) at relevant points in the trial to highlight how responses are generated in this task. To begin the trial, S1 is presented, building activation in PF and SWM. When the input is removed, the peak in SWM sustains during the delay (Figure 2E), as in the recall simulations. Because of the shared inhibitory layer, this peak produces a trough of inhibition in PF (Figure 2D); thus, when S2 is presented after a brief delay, activation in PF is relatively weak. When the input is removed, then, activation in PF quickly decays (Figure 2F). In SWM, on the other hand, activation from S2 overlaps with the self-sustaining peak. This peak sends activation to the same node (because there is no above-threshold activation in PF at this point, the different node receives no input). Given the strong input to the same node, this node suppresses the different node and the model correctly generates a same response.
The simulation in Figure 3 shows how the model responds when S1 and S2 are presented in different locations. This simulation begins exactly as the same simulation (compare Figure 2D–E with Figure 3D–E). When S2 is presented it is now shifted to the right of S1 (to 45°). Because S2 does not overlap spatially with the working memory of S1, activation builds more easily in PF (Figure 3F); this, in turn, suppresses the SWM peak associated with S1 (Figure 3G) due to the strong, shared inhibition. Consequently, PF sends activation to the different node, and there is no activation from SWM to the same node, leading to a different response.
Figure 3.

A simulation of the DFT responding different in a position discrimination trial. S1 was presented at 35°, S2 at 45°. Panels, axes, and arrows are as in Figure 2.
Simmering et al. (2006) used these concepts to predict a specific pattern of adults’ position discrimination performance based on factors that influence overlap between activation in PF and activation in SWM. Specifically, reference-related inhibition – the inhibition associated with reference peaks in PF that produces delay-dependent biases in spatial recall – should produce two effects in position discrimination. First, directional drift should influence overlap, as illustrated in Figure 4 (for simplicity, this figure shows only time-slices of PF and SWM). Importantly, these simulations now include midline input, which is the source of directional drift in the model. Figure 4A–B shows the beginning of the trial, when S1 is presented. At the end of the delay, the peak in SWM has drifted slightly away from midline (Figure 4B), and has produced a corresponding trough of inhibition in PF (Figure 4A). Note that, because of the much shorter delay (1 s compared to 10 s in the recall simulation), the amount of drift is relatively small. This drift is sufficient, however, to influence performance based on the direction in which S2 is presented.1
If S2 is presented away from midline – that is, in the direction of drift – activation from S2 overlaps with the drifted position of the peak in SWM (Figure 4D). Because this region of PF is inhibited by the peak in SWM, activation in PF dies as soon as the input is removed (Figure 4C). In SWM, on the other hand, the S2 activation overlaps with the S1 peak, maintaining the SWM peak and generating a same response even though S1 and S2 were in different locations. As such, the DFT predicts that larger separations between stimuli are necessary to generate a different response when S2 is presented away from midline. In experiment, this corresponds to higher discrimination thresholds, as shown by the square marker in Figure 4G.
If S2 is presented toward midline, on the other hand, the DFT predicts better performance, even at the same actual separation between S1 and S2. In this case, because the S1 peak in SWM has drifted in the direction opposite to the S2 presentation, S2 activation comes in to a relatively uninhibited region of PF. After the input is removed, then, the peak is maintained in PF (Figure 4E). This deletes the SWM peak (Figure 4F) and leads to a different response. As a result, the DFT predicts different responses at smaller separations if S2 is presented toward midline. In experiment, this corresponds to lower discrimination thresholds, as shown by the diamond marker in Figure 4G.
These simulations illustrate the first novel prediction of the DFT: position discrimination should be enhanced (i.e. producing different responses at smaller separations between S1 and S2) when S2 is presented toward midline. Note that the DFT also predicts that this difference across S2 directions should only be evident for spatial locations where memory drift is relatively large, around 20–30° from midline (Spencer & Hund, 2002). Conversely, directional drift should have little effect near midline, where drift is minimal. This is captured in Figure 4G – discrimination thresholds are comparable for the ‘near’ target. Note that these are qualitative predictions of the DFT; we predict relatively higher or lower thresholds, rather than specific discrimination thresholds (which show marked individual differences; see Simmering et al., 2006).
Reference-related inhibition in the DFT also predicts a second effect on position discrimination, specifically, that stronger inhibition near the reference should lead to narrower peaks. Narrower peaks are less likely to overlap. Consequently, discrimination thresholds should be consistently lower near midline versus far from midline (see Figure 4H). Importantly, because both repulsion from midline and enhanced discrimination near midline arise through the same mechanism in the DFT, they should combine to form the specific pattern of performance shown in Figure 4I (i.e. Figure 4I shows the summation of the predictions in Figure 4G and 4H). As can be seen in this figure, the DFT predicts comparable performance across locations when S2 is presented toward midline, but impaired performance far from midline when S2 is presented away from midline. Data with adults confirmed this predicted pattern of performance (Figure 4J, Simmering et al., 2006), supporting the DFT account of discrimination and demonstrating that the model generalizes across tasks.
Generalizing the DFT across tasks and time scales: novel predictions for the development of position discrimination
Thus far, we have described how the DFT captures the spatial recall performance of children and adults as well as how this theory has predicted novel effects in discrimination performance with adults. The goal of the present paper is to combine these two accounts to generate and test specific behavioral predictions regarding the development of position discrimination. As with adults, children’s discrimination performance should depend on overlap between the S1 SWM peak and S2 input to PF, and overlap should be affected by both directional drift and peak width. The spatial precision hypothesis predicts related changes in both of these factors over development and, combined with our theory of the processes underlying discrimination, leads to the specific pattern of behavioral predictions shown in Figures 5 and 6.
Figure 5.

The influence of directional drift on position discrimination in the DFT using child parameters. Panels, axes, and arrows are as in Figure 4.
Figure 6.
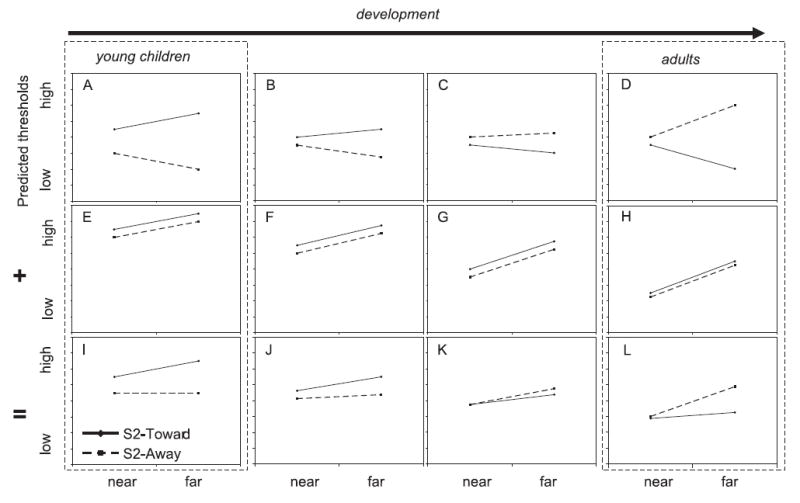
Developmental predictions based on reference-related inhibition and increasing spatial precision in the DFT for discrimination performance: differences across locations and S2-direction based on only directional drift (A–D), only peak width (E–H), or both (I–L). Solid lines indicate predicted performance when S2 is presented toward midline; dashed lines indicate predicted performance when S2 is presented away from midline. Note that lower thresholds correspond to better performance. Predictions for young children (A, E, I) and adults (D, H, L) are reproduced from previous figures for comparison (see dashed boxes).
First, the DFT predicts that directional drift should influence children’s discrimination performance, just as it influenced adults’ performance. However, because young children show biases toward midline in recall, the specific predictions based on directional drift are actually reversed, as shown in Figure 5. This figure shows the same type of simulations shown in Figure 4, but now run with the child parameters.2 Figure 5A–B shows the beginning of the trial, when S1 is presented. At the end of the delay, the peak in SWM has now drifted slightly toward midline (Figure 5B), along with a corresponding trough of inhibition in PF (Figure 5A). Again, this drift is much smaller than that seen in recall, due to the shorter delay.
If S2 is presented away from midline (Figure 5C–D), this is now the opposite direction of drift, and activation from S2 falls outside of the inhibitory trough in PF (Figure 5C), resulting in a different response. Consequently, in experiment, children’s performance should be better when S2 is presented away from midline (see lower thresholds for the square marker in Figure 5G). If S2 is presented toward midline (Figure 5E–F), on the other hand, this is in the direction of drift. Now, activation from S2 overlaps with the S1 peak in SWM; as a result, activation in SWM is maintained, producing a same response. Consequently, the DFT predicts that children’s performance should be worse when S2 is presented toward midline (see higher thresholds for the diamond marker in Figure 5G).
These simulations illustrate the first novel developmental prediction of the DFT: young children’s discrimination performance should show the opposite directional pattern from adults, with better performance when S2 is presented away from midline (compare Figures 4G and 5G). As with the adult parameters, the child parameters predict that this difference across S2 directions should only be evident for spatial locations where memory drift is relatively large. Thus, directional drift should have little effect near midline, where drift is minimal (see predictions for ‘near’ targets in Figure 5G).
The second important factor for discrimination performance in the DFT – peak width – should also be changing over development. According to the spatial precision hypothesis, broader interactions should lead to broader peaks early in development. As such, discrimination performance should be (not surprisingly) worse in young children, as shown by the relatively high thresholds predicted in Figure 5H. Because the formation of reference peaks in early development is predicted to be rather tenuous, the modulation in peak width across near and far targets should be relatively minimal (compare near and far thresholds in Figure 4H to Figure 5H). These factors should again combine to yield the predicted behavioral pattern for young children’s discrimination performance shown in Figure 5I. The DFT predicts comparable performance across locations when S2 is presented away from midline, but impaired performance far from midline when S2 is presented toward midline – the opposite of the pattern seen with adults. Moreover, thresholds should be relatively high overall.
The DFT and spatial precision hypothesis make one final developmental prediction for discrimination performance: because changes in precision are gradual over development, at intermediate ages, children should show intermediate patterns of performance, as shown in Figure 6. Note that the qualitative predictions for young children and adults from Figures 4 and 5 are reproduced here for comparison (see dashed boxes in Figure 6). Figure 6A–D shows predicted changes based on directional drift over development. Young children should show the opposite pattern to adults, with better performance when S2 is presented away from midline. At intermediate ages, however, biases toward midline in recall first become smaller before switching to biases away from midline. This change is reflected in Figure 6B–C, in which the predicted difference across directions first becomes less pronounced, and then reverses, eventually showing the adult pattern.
Figure 6E–H shows predicted changes in peak width. As neural interactions become more precise, peaks should become narrower, especially near midline. This is reflected in a predicted overall reduction (i.e. improvement) in discrimination thresholds. In addition, this improvement should be more pronounced for locations near midline (see Figure 6F–G), as reference-related inhibition emerges. Finally, the DFT predicts that these factors should combine to produce the pattern shown in Figure 6I–L. For young children (Figure 6I), thresholds should be highest for the far target when S2 is presented toward midline. At intermediate ages (Figure 6J–K), this difference based on S2 direction should reduce and eventually switch. Critically, when this switch occurs, the difference across Toward and Away conditions should be small. Ultimately, the advantage when S2 is presented away from midline should increase, leading to the adult pattern of performance (Figure 6L).
We tested these predictions in the present study with 3- to 6-year-old children and adults, using a procedure modified from Simmering et al. (2006). Note that, although the predictions based on only directional drift are similar to the combined predictions, there are important differences. For instance, directional drift (Figure 6A–D) predicts that performance in the enhanced direction (i.e. Away for children, Toward for adults) will show a difference across target locations, with lower thresholds for the far target. But combining directional drift with peak width changes this prediction – instead, there should be no difference across near and far target locations for the enhanced direction for both children and adults, even though the enhanced direction shifts over development – away from midline for young children (dotted line in Figure 6I) and toward midline for adults (solid line in Figure 6L).3
Empirical test of predictions
Method
Participants
One hundred and eighty children and 22 adults participated in this experiment (see Table 1 for details). Child participants were recruited from a database at the University of Iowa and were given a small gift for participating. Parents of child participants gave informed consent. Adult participants either volunteered or were recruited from an introductory psychology course and received research exposure credit for their participation. All participants had normal or corrected-to-normal vision.
Table 1.
Participant ages and sample sizes
| M | SD | N (total)a | N (means) | N (var.) | Excluded from all analyses | |
|---|---|---|---|---|---|---|
| 3-year-olds | 3,8 | 0.5 | 51 | 41 | 35 | 8 (incomplete data) 2 (outliersb) |
| 4-year-olds | 4,4 | 0.6 | 49 | 42 | 36 | 7 (incomplete data) |
| 5-year-olds | 5,4 | 2.0 | 40 | 39 | 37 | 1 (incomplete data) |
| 6-year-olds | 6,3 | 1.7 | 40 | 39 | 38 | 1 (equipment problems) |
| Adults | 20,5 | 25.1 | 23 | 20 | 20 | 2 (equipment problems) 1 (experimenter error) |
Note: Mean ages are in years and months; standard deviations are in months.
Participants must have completed at least one run to each target to be included in analyses of means; otherwise, data were considered incomplete and were excluded from all analyses. In addition, at least two runs per target were required to be included in analyses of variability, leading to slightly smaller sample sizes for these analyses.
To evaluate data for outliers, we computed a threshold difference score (threshold for the 10° target minus threshold for the 30° target) for each participant. We compared these scores within age groups by plotting scores in histograms with 2-pixel bins. In each age group, the data formed approximately normal distributions. Only in the 3-year-olds’ data did any scores appear to fall outside of the distribution. In this case, 2 children’s data fell more than three bins (i.e. 6 pixels) from the nearest score; these children were considered outliers and their data were excluded from all analyses.
Apparatus
Sessions were conducted in a dimly lit room with black curtains covering the walls and ceiling to limit participants’ use of external reference cues (see Simmering et al., 2006, for description). For training, black cardstock flashcards of two yellow smiley-face ‘twins’ were hidden under a larger piece of black cardstock with three cutout flaps. For testing, participants sat on a chair placed within an arc cut out from the side of a large table (see Figure 7), with a female experimenter seated behind them, out of view. For child participants, a parent was also seated out of view in the testing area, at the corner of the table.
Figure 7.

Testing apparatus and stimuli. Note that stimuli are presented schematically and are not drawn precisely to scale. See Apparatus section for exact stimulus details.
Stimuli were projected onto the rear-projection surface of the table from below using a Barco 708 data projector. Throughout the procedure, the tabletop appeared black to participants. Two types of images were used: yellow smiley-face target dots and green reference lines. Target dots were 7 pixels in diameter, and presented in a 15 cm deep by 22.5 cm wide area extending rightward from the center of the tabletop. Green reference lines were 4 pixels in width and were presented along the midline symmetry axis of the table, with a gap in the center by the stimulus presentation area (see Figure 7).
Procedure
The task was explained as a ‘hiding game’ in which two smiley-face twins hid, and participants reported whether they hid together or apart. Children who had not yet mastered use of the terms ‘together’ and ‘apart’ used either ‘same place’ and ‘different place’ or hand gestures to respond. The experimenter and participant sat on the floor outside the testing area for training with the flashcards. The experimenter showed the twins hiding sequentially, and the participant responded if they were together or apart. Once the participant understood the task, they moved to the testing table, where the experimenter used demonstration trials showing the twins hiding together or apart until the participant understood the task.
Each test trial began with the presentation of green reference lines (see Figure 7), along with an auditory message ‘We’re going to hide’ and a 100 ms tone. This message was followed by a 1 s delay and then a 1 s presentation of the first stimulus dot (S1). Next came a 500 ms delay (consisting of a 200 ms delay, a 100 ms tone, and a 200 ms delay), followed by a 1 s presentation of the second stimulus dot (S2). Once S2 disappeared, the experimenter prompted the participant for a response. If the participant did not see one of the dots, the experimenter could re-present the trial. The experimenter entered 1 for same or 3 for different on a keyboard, which ended the trial and removed the green reference lines. When the participant was ready to go on, the experimenter pressed ‘G’ on the keyboard to begin the next trial. To keep children motivated, pictures of cartoon characters appeared on the tabletop after every five trials, with audio messages like ‘Great job!’
Experimental design
S1 was presented at two target locations – 10° and 30° to the right of midline, with green reference lines presented along midline (see Figure 7, Simmering et al., 2006). S2 was presented relative to S1 at a distance of 0–20 pixels (in 4-pixel steps) for children, or 0–10 pixels (in 1-pixel steps) for adults. Note that we refer to S2 positions in pixels rather than visual angles because children could shift their viewing angle freely in the experiment (see Table 2 and Simmering et al., 2006, for approximate visual angles of the stimuli). Across conditions, S2 was presented toward midline (coded as negative) or away from midline (coded as positive). Children were randomly assigned to the Toward or Away condition. Adults completed both conditions in a single session, with the order counter-balanced across participants.
Table 2.
Approximate visual angle to stimuli at various pixel separations
| Target separation
|
|||||
|---|---|---|---|---|---|
| Location | 0 pixels | 2 pixels | 4 pixels | 6 pixels | 8 pixels |
| 10° | 2.57° | 2.80° | 3.04° | 3.28° | 3.51° |
| 30° | 7.41° | 7.64° | 7.89° | 8.13° | 8.36° |
Note: Visual angle = angle from table midline to stimulus. The 0-pixel separation corresponds to the position of S1. All measurements were based on an adult sitting in a chin rest centered at midline (see Simmering et al., 2006).
To minimize the number of trials required of child participants, we designed a staircasing procedure based on the method of descending limits described by Abrimov and colleagues (Abrimov, Hainline, Turkel, Lemerise, Smith, Gordon & Petry, 1984). Participants completed up to four runs per target. One target was randomly selected to begin the first run, and S2 was presented at the largest separation (i.e. 20 pixels for children, 10 pixels for adults) in the direction specified by the condition. After the participant responded different, subsequent trials stepped through sequentially smaller separations (switching direction if necessary) until the participant made a same response. Then, the next run began at the other target. Runs were terminated if the participant reached the second-largest separation in the opposite direction (i.e. 16 pixels for children, 9 pixels for adults) without responding same. The second through fourth runs to each target were similar, except that the second trial of each run (after the largest separation) presented the separation two steps larger than the previous same response for that target (see Abrimov et al., 1984). Targets were presented on alternating runs until four runs were completed to each target or the participant chose to end early. Data were considered incomplete and excluded from all analyses if a participant did not respond same in at least one run to each target (see Table 1).
Results
We computed participants’ discrimination thresholds as the mean pixel separation at which they responded same across runs. We also computed threshold variability – the standard deviation of thresholds across runs for participants with at least two runs per target (see Table 1). We analyzed children’s data in a three-way ANOVA with Target (10°, 30°) as a within-subjects factor and Direction (Toward, Away) and Age (3, 4, 5, 6) as between-subjects factors. Adults’ data were analyzed separately in a two-way ANOVA with Target (10°, 30°) and Direction (Toward, Away) as within-subjects factors.
Mean discrimination thresholds
Figure 8A shows mean thresholds separately for each direction across targets and ages. Three- and 4-year-olds’ thresholds were generally highest, with better performance (i.e. lower thresholds) at the 10° target and in the Away condition. Five-year-olds showed more similar performance across directions and targets, although thresholds were still lower for the 10° target and in the Away condition at the 30° target. Six-year-olds and adults had the lowest thresholds, with better performance at the 10° target but the reversed direction effect – better performance in the Toward condition.
Figure 8.

Mean discrimination thresholds (A) and mean threshold variability (B) across Targets and Ages, separately for each stimulus Direction. Solid lines indicate the S2-Toward condition; dashed lines indicate the S2-Away condition. Lower discrimination thresholds (along the y-axis in A) correspond to better performance.
The ANOVA on children’s data revealed significant main effects of Target, F(1, 153) = 18.06, p < .001, and Age, F(3, 153) = 5.04, p < .01, as well as a significant Age × Direction interaction, F(3, 153) = 4.31, p < .01, and a significant Target × Direction × Age interaction, F(3, 153) = 3.27, p < .05. Tests of simple effects revealed a systematic shift across ages from better performance in the Away condition to better performance in the Toward condition.
Simple effects tests of 3-year-olds’ data showed a significant main effect of Target, F(1, 39) = 5.88, p < .05, and a significant Target × Direction interaction, F(1, 39) = 7.26, p < .05. Further tests of simple effects showed no difference at the 10° target, but significantly better performance in the Away condition at 30°, F(1, 39) = 8.39, p < .01. Additional tests of simple effects revealed no difference across targets in the Away condition, F(1, 19) < 1, as predicted by the combined effects of directional drift and peak width (see Figure 6I). Thus, 3-year-olds’ performance showed the predicted pattern of results: lower thresholds near midline and in the Away condition.
For 4-year-olds, tests of simple effects showed significant main effects of Target, F(1, 40) = 6.67, p < .05, and Direction, F(1, 40) = 8.96, p < .01, indicating better performance at 10°, and in the Away condition. For 5-year-olds, there was only a significant Target main effect, F(1, 37) = 4.83, p < .05, with better performance at 10°. Thus, as predicted, the difference across Toward and Away conditions was eliminated near the developmental transition. Finally, tests of simple effects for the 6-year-olds showed only a significant Direction main effect, F(1, 37) = 6.70, p < .05, with the predicted switch to better performance in the Toward condition.
The ANOVA on adults’ data revealed significant main effects of Target, F(1, 19) = 14.15, p < .01, and Direction, F(1, 19) = 5.71, p < .05, which were subsumed by a significant Target × Direction interaction, F(1, 19) = 4.31, p = .05. Tests of simple effects showed that this interaction was driven by no difference at 10° and significantly better performance in the Toward condition at 30°, F(1, 19) = 8.90, p < .01. Additional tests of simple effects revealed no difference across targets in the Toward condition, F(1, 19) < 1, as predicted by the combined effects of directional drift and peak width (see Figure 6L). Thus, adults’ performance replicated our previous findings (Simmering et al., 2006), with lower thresholds near midline and in the Toward condition – the opposite of the pattern observed with 3-year-olds. These analyses confirmed the developmental pattern predicted by the DFT and the spatial precision hypothesis (see Figure 6).
Variability of discrimination thresholds
Figure 8B shows threshold variability separately for each Direction across Targets and Ages. Variability generally decreased over development, but was higher when S2 was presented in the direction of drift – toward midline for younger children and away from midline for older children and adults. The dramatic reduction in variability over development in the Toward condition parallels the mean threshold results.
The ANOVA on children’s data revealed a significant Age main effect, F(3, 137) = 3.88, p < .05, which was subsumed by significant Target × Age, F(3, 137) = 3.29, p < .05, and Direction × Age, F(3, 137) = 2.99, p < .05, interactions. Tests of simple effects showed a significant Target main effect for only 3-year-olds, F(1, 33) = 7.35, p < .05. As Figure 8B shows, this effect was driven by higher variability at 10° (M = 5.27 pixels) than at 30° (M = 4.04 pixels). This is consistent with results from Schutte (2004), in which 3-year-olds’ attraction toward midline was larger for targets close to midline. In the DFT, greater drift leads to higher variability because small differences in the rate of peak drift across trials amplify variability.
Additional tests of simple effects revealed marginally significant Direction main effects for 3-year-olds, F(1, 33) = 3.49, p = .071, and 6-year-olds, F(1, 36) = 4.03, p = .052. As Figure 8B shows, these effects were driven by higher variability in the Toward condition for 3-year-olds (M = 5.40 pixels, Away M = 3.77 pixels), but in the Away condition for 6-year-olds (M = 3.80 pixels, Toward M = 2.87 pixels). Thus, variability was higher in the direction of drift for both age groups, as the direction of drift reversed across this age range.
The ANOVA on adults’ data showed a significant main effect of Target, F(1, 19) = 4.24 p = .05, with lower variability to 10° (M = 0.86 pixels; 30° M = 1.09 pixels). Note that this effect is opposite to that seen in the 3-year-olds’ data. Thus, the pattern of variability across targets reversed over development, consistent with the directional shift in spatial recall biases. As the direction of drift changes, thresholds for that direction are higher and more variable.
Discussion
Analyses of mean discrimination thresholds confirmed the developmental pattern predicted by the DFT and the spatial precision hypothesis. Early in development, when peaks are broad and memory drifts toward midline, 3-year-olds showed better performance to targets in the Away condition. Four-year-olds performed similarly, with a large advantage in the Away condition and better performance near midline. Later, when peaks become narrower and drift is minimal, 5-year-olds showed comparable performance across Targets and Directions. As peaks narrow further, strong repulsion emerges and 6-year-olds showed better performance in the Toward condition. Finally, adults showed the same pattern as in Simmering et al. (2006), with a reversal of the pattern seen with 3-year-olds.
Threshold variability showed a converging pattern of results. Three-year-olds’ performance was more variable for the near target, whereas adults’ performance was more variable for the far target. Additionally, variability was higher in the Toward condition for the 3-year-olds, but in the Away condition for the 6-year-olds. These results are consistent with the DFT and the spatial precision hypothesis: variability should be higher in the direction of drift, especially early in development when SWM peaks are quite unstable (see Schutte et al., 2003).
Conclusions
The goal of this paper was to achieve both specificity and generality within a single model of spatial working memory, the DFT. To evaluate whether we indeed accomplished this goal, we first consider specificity. By combining the real-time predictions from our work on position discrimination with adults with the developmental account of spatial recall biases (i.e. the spatial precision hypothesis), we were able to predict a specific, complex pattern of performance over development in position discrimination (see Figure 6I–6L). Empirical data confirmed these predictions (see Figure 8A), demonstrating a degree of specificity for a priori behavioral predictions not often achieved in the developmental literature.
Because these predictions also covered a broad period of development, they address a second part of our goal – generality across time scales. Indeed, these data provide the last step in two parallel tracks of study in our lab pursuing generality across time scales and tasks. In particular, the DFT has captured behaviors in two tasks – spatial recall (e.g. Spencer & Hund, 2002) and position discrimination (Simmering et al., 2006) – and the implementation of the spatial precision hypothesis in the DFT has now captured developmental changes in both tasks (Hund & Spencer, 2003; Schutte, 2004; Schutte & Spencer, 2002; Schutte et al., 2003; Spencer & Hund, 2003; Spencer et al., 2006).
As noted in the introduction, however, our model is not the first to attempt to capture both specificity and generality. Have we accomplished anything new? We contend that the answer is ‘yes’, both within the domain of spatial cognition and within cognitive and developmental science more generally. Ours is the first model to formally link spatial recall and position discrimination, not only with adults but also over development, and then test specific, novel predictions in both tasks. As a contrast, consider the Category Adjustment (CA) model (Huttenlocher et al., 1991), the dominant model of spatial recall biases. Although this model has also been applied in other domains (e.g. representation of time; Huttenlocher, Hedges & Prohaska, 1988; and memory for continuous features; Huttenlocher, Hedges & Vevea, 2000), in each case the task requires estimation along a continuous dimension. With the DFT, we have gone a step beyond estimation responses in recall to incorporate the same/different decision required in position discrimination. Thus, although the CA model and DFT offer similar accounts of recall biases (but with critical differences, see Simmering et al., 2008; Spencer et al., 2007), only the DFT has gone on to capture other behaviors as well (for a second example of generalization across tasks and response types, see Spencer et al., 2006).
The DFT is also the first model in this domain linked to a specific developmental hypothesis that can capture the details of behavior across developmental transitions. For instance, Huttenlocher and colleagues have used the CA model to explain the shift in recall biases from toward midline to away from midline: the change results when children shift from treating the task space as one category with a prototype at the center of the space to two categories with a boundary along midline and prototypes in the center of each half (Huttenlocher et al., 1994). Although this account captures the general change in recall biases, it fails to address, much less predict, the gradual nature of this change shown by Schutte (2004). By contrast, our theoretical account includes a specific developmental hypothesis that has now successfully predicted detailed behavioral changes in two spatial working memory tasks across this developmental transition. Moreover, we do not need to posit a mechanism for determining prototypical locations because our account of geometric biases does not rely on prototypes – instead, biases in our model arise from interactions between perception of available geometric structure in the task space and the on-line maintenance of activation in working memory (Simmering & Spencer, 2007).
Although the spatial precision hypothesis and the DFT can account for developmental changes in spatial recall, it is important to note that future work must specify the mechanism that gives rise to the changes in neural interaction captured by this hypothesis. Such changes in neural interaction could arise from basic Hebbian processes (see Spencer et al., 2007, for discussion). Hebbian learning has been shown to produce the type of continuous, graded, metric changes captured by the spatial precision hypothesis (e.g. Kohonen, 1982). Concretely, we could implement a Hebbian learning rule that would gradually modify the strength with which neurons in our model interact (see also Westermann & Mareschal, 2004, for discussion of possible sources of developmental changes in cortical tuning). Although the instantiation of the DFT presented here does not include this type of learning mechanism, we contend that this type of account is within reach.
It is also important to note that a growing body of neural data from studies of brain development is consistent with the spatial precision hypothesis. For example, Durston and colleagues (Durston, Davidson, Tottenham, Galvan, Spicer, Fossella & Casey, 2006) demonstrated that overall neural activation decreases over development (between about 9 and 12 years of age), reflecting a shift from diffuse to focused activation as older children show less activation in areas of the brain that are not considered relevant to the task at hand. More recently, Edin and colleagues (2007) used a neural network architecture similar to the layered architecture of the DFT to predict developmental changes in BOLD signals (measured with fMRI) during a working memory task. Predictions were based on implementations of five hypotheses about how neural interactions change over development. These researchers found that neural interactions with ‘higher contrast’ over development effectively captured changes in fMRI activity between 13 years of age and adulthood. Higher contrast in their model consisted of strengthening connections both within and between regions (similar to our excitatory projections), as well as ‘pruning’ or strengthening of lateral inhibitory connections. Thus, the most effective developmental hypothesis in their simulation and fMRI study mirrored the changes in local excitation/lateral inhibition captured by the spatial precision hypothesis.
The contrasts with the CA model above establish the DFT as the first model of spatial recall biases to propose a specific developmental mechanism, and then generate a host of specific, testable predictions in multiple tasks (e.g. Schutte, 2004; Schutte et al., 2003). But we also contend that we have accomplished something new in the field of cognitive and developmental science more generally. Beyond the domain of spatial cognition, the number of models that are able to achieve both specificity and generality is limited. The theoretical and empirical work presented here demonstrate that the spatial precision hypothesis and DFT offer a detailed account of how real-time behavior changes over the time scale of development, thus adding to the relatively small collection of models that achieve both specificity and generality. More generally, this approach may provide a framework for thinking about the processes that underlie performance in multiple contexts across multiple time scales, without giving up a core strength of process models – tight theory–experiment relations.
Acknowledgments
This research was funded by NIMH R01 MH62480 and NSF BCS 00-91757 awarded to John P. Spencer. Earlier versions of this work were presented at the 5th meeting of the International Conference on Development and Learning and the 28th annual meeting of the Cognitive Science Society. We thank the parents, children, and undergraduates who participated in this research, and the many research assistants who helped with data collection. We also thank Gregor Schöner and Anne Schutte for their input and assistance with this study, as well as Kara Recker and Larissa Samuelson for reading earlier versions of this manuscript.
Footnotes
In the DFT, drift of the SWM peak begins as soon as the stimulus is removed (provided there is a reference peak in PF to contribute inhibition), and increases systematically over delays, leveling out after approximate 15 s delay (see Spencer & Hund, 2002). Accordingly, the DFT predicts systematic changes in discrimination performance as the delay between S1 and S2 increases (i.e. asymmetries due to directional drift should become more pronounced as the S1 peak drifts further; we thank an anonymous reviewer for highlighting this aspect of the model). Preliminary unpublished data from our lab suggest, however, that this prediction may be difficult to test with the standard position discrimination task because the task becomes much more difficult at longer delays. For instance, after a 5 s delay in-between stimuli, participants were near chance performance on same/different trials.
Note that the separation between S1 and S2 was larger for the child simulations. Because peaks are broader with the child parameters, larger separations are needed to produce different responses. This contributes to our developmental predictions that children will have higher discrimination thresholds overall, compared to adults.
Note that although we predict a specific pattern of performance over development, these predictions are still of a qualitative nature – we do not predict the quantitative values of discrimination thresholds.
References
- Abrimov I, Hainline L, Turkel J, Lemerise EA, Smith H, Gordon J, Petry S. Rocket-ship psychophysics: assessing visual functioning in young children. Investigative Ophthalmology and Visual Science. 1984;25:1307–1315. [PubMed] [Google Scholar]
- Amari S. Dynamics of pattern formation in lateral-inhibition type neural fields. Biological Cybernetics. 1977;27:77–87. doi: 10.1007/BF00337259. [DOI] [PubMed] [Google Scholar]
- Bastian A, Riehle A, Erlhagen W, Schöner G. Prior information preshapes the population representation of movement direction in motor cortex. NeuroReport. 1998;9:315–319. doi: 10.1097/00001756-199801260-00025. [DOI] [PubMed] [Google Scholar]
- Bastian A, Schöner G, Riehle A. Preshaping and continuous evolution of motor cortical representations during movement preparation. European Journal of Neuroscience. 2003;18:2047–2058. doi: 10.1046/j.1460-9568.2003.02906.x. [DOI] [PubMed] [Google Scholar]
- Bicho E, Mallet P, Schöner G. Target representation on an autonomous vehicle with low-level sensors. The International Journal of Robotics Research. 2000;19:424–447. [Google Scholar]
- Douglas R, Martin K. Neocortex. In: Shepherd GM, editor. The synaptic organization of the brain. 4. New York: Oxford University Press; 1998. pp. 459–509. [Google Scholar]
- Durston S, Davidson MC, Tottenham N, Galvan A, Spicer J, Fossella JA, Casey BJ. A shift from diffuse to focal cortical activity with development. Developmental Science. 2006;9(1):1–20. doi: 10.1111/j.1467-7687.2005.00454.x. [DOI] [PubMed] [Google Scholar]
- Edin F, Macoveanu J, Olesen P, Tegnér J, Klingberg T. Stronger synaptic connectivity as a mechanism behind development of working memory-related brain activity during childhood. Journal of Cognitive Neuroscience. 2007;19(5):750–760. doi: 10.1162/jocn.2007.19.5.750. [DOI] [PubMed] [Google Scholar]
- Engebretson PH, Huttenlocher J. Bias in spatial location due to categorization: comment on Tversky and Schiano. Journal of Experimental Psychology: General. 1996;125(1):96–108. doi: 10.1037//0096-3445.125.1.96. [DOI] [PubMed] [Google Scholar]
- Erlhagen W, Bastian A, Jancke D, Riehle A, Schöner G. The distribution of neuronal population activation (DPA) as a tool to study interaction and integration in cortical representations. Journal of Neuroscience Methods. 1999;94:53–66. doi: 10.1016/s0165-0270(99)00125-9. [DOI] [PubMed] [Google Scholar]
- Erlhagen W, Schöner G. Dynamic field theory of movement preparation. Psychological Review. 2002;109:545–572. doi: 10.1037/0033-295x.109.3.545. [DOI] [PubMed] [Google Scholar]
- Hund AM, Spencer JP. Developmental changes in the relative weighting of geometric and experience-dependent location cues. Journal of Cognition and Development. 2003;4(1):3–38. [Google Scholar]
- Huttenlocher J, Hedges LV, Duncan S. Categories and particulars: prototype effects in estimating spatial location. Psychological Review. 1991;98:352–376. doi: 10.1037/0033-295x.98.3.352. [DOI] [PubMed] [Google Scholar]
- Huttenlocher J, Hedges L, Prohaska V. Hierarchical organization in ordered domains: estimating the dates of events. Psychological Review. 1988;95:471–484. [Google Scholar]
- Huttenlocher J, Hedges LV, Vevea JL. Why do categories affect stimulus judgment? Journal of Experimental Psychology: General. 2000;129:220–241. doi: 10.1037//0096-3445.129.2.220. [DOI] [PubMed] [Google Scholar]
- Huttenlocher J, Newcombe NS, Sandberg EH. The coding of spatial location in young children. Cognitive Psychology. 1994;27:115–147. doi: 10.1006/cogp.1994.1014. [DOI] [PubMed] [Google Scholar]
- Jancke D, Erlhagen W, Dinse HR, Akhavan AC, Giese M, Steinhage A, Schöner G. Parametric population representation of retinal location: neuronal interaction dynamics in cat primary visual cortex. Journal of Neuroscience. 1999;19:9016–9028. doi: 10.1523/JNEUROSCI.19-20-09016.1999. [DOI] [PMC free article] [PubMed] [Google Scholar]
- Johnson JS, Spencer JP, Schöner G. A dynamic neural field theory of multi-item visual working memory and change detection. Paper presented at the the 28th Annual Conference of the Cognitive Science Society; Vancouver, BC. 2006. [Google Scholar]
- Johnson JS, Spencer JP, Schöner G. Moving to higher ground: the dynamic field theory and the dynamics of visual cognition. In: Garzón F, Laakso A, Gomila T, editors. Dynamics and psychology [special issue]. New Ideas in Psychology. in press. [DOI] [PMC free article] [PubMed] [Google Scholar]
- Kinchla RA. Visual movement perception: a comparison of absolute and relative movement discrimination. Perception and Psychophysics. 1971;9:165–171. [Google Scholar]
- Kohonen T. Self-organized formation of topologically correct feature maps. Biological Cybernetics. 1982;43:59–69. [Google Scholar]
- Kopecz K, Schöner G. Saccadic motor planning by integrating visual information and pre-information on neural, dynamic fields. Biological Cybernetics. 1995;73:49–60. doi: 10.1007/BF00199055. [DOI] [PubMed] [Google Scholar]
- Love BC, Medin DL, Gureckis TM. SUSTAIN: a network model of category learning. Psychological Review. 2004;111:309–332. doi: 10.1037/0033-295X.111.2.309. [DOI] [PubMed] [Google Scholar]
- Morton JB, Munakata Y. Active versus latent representations: a neural network model of perseveration, dissociation, and decalage. Developmental Psychobiology. 2002;40:255–265. doi: 10.1002/dev.10033. [DOI] [PubMed] [Google Scholar]
- Murphy GL. The big book of concepts. Cambridge, MA: The MIT Press; 2002. [Google Scholar]
- Perone S, Spencer JP, Schöner G. A dynamic field theory of visual recognition in infant looking tasks. Paper presented at the Proceedings of the 29th Annual Conference of the Cognitive Science Society.2007. [Google Scholar]
- Schöner G, Thelen E. Using dynamic field theory to rethink infant habituation. Psychology Review. 2006;113(2):273–299. doi: 10.1037/0033-295X.113.2.273. [DOI] [PubMed] [Google Scholar]
- Schutte AR. Unpublished doctoral dissertation. University of Iowa; Iowa City, IA: 2004. A developmental transition in spatial working memory. [Google Scholar]
- Schutte AR, Spencer JP. Generalizing the dynamic field theory of the A-not-B error beyond infancy: three-year-olds’ delay- and experience-dependent location memory biases. Child Development. 2002;73:377–404. doi: 10.1111/1467-8624.00413. [DOI] [PubMed] [Google Scholar]
- Schutte AR, Spencer JP. Tests of the dynamic field theory and the spatial precision hypothesis: capturing a qualitative developmental transition in spatial working memory. 2008 doi: 10.1037/a0015794. Manuscript under review. [DOI] [PMC free article] [PubMed] [Google Scholar]
- Schutte AR, Spencer JP, Schöner G. Testing the dynamic field theory: working memory for locations becomes more spatially precise over development. Child Development. 2003;74(5):1393–1417. doi: 10.1111/1467-8624.00614. [DOI] [PubMed] [Google Scholar]
- Simmering VR, Spencer JP. Carving up space at imaginary joints: can people mentally impose spatial category boundaries? Journal of Experimental Psychology: Human Perception and Performance. 2007;33:871–894. doi: 10.1037/0096-1523.33.4.871. [DOI] [PubMed] [Google Scholar]
- Simmering VR, Spencer JP, Schöner G. Reference-related inhibition produces enhanced position discrimination and fast repulsion near axes of symmetry. Perception and Psychophysics. 2006;68:1027–1046. doi: 10.3758/bf03193363. [DOI] [PubMed] [Google Scholar]
- Simmering VR, Schutte AR, Spencer JP. Generalizing the dynamic field theory of spatial cognition across real and developmental time scales. In: Becker S, editor. Computational cognitive neuroscience [special section]. Brain Research. Vol. 1202. 2008. pp. 68–86. [DOI] [PMC free article] [PubMed] [Google Scholar]
- Spencer JP, Hund AM. Prototypes and particulars: geometric and experience-dependent spatial categories. Journal of Experimental Psychology: General. 2002;131:16–37. doi: 10.1037//0096-3445.131.1.16. [DOI] [PubMed] [Google Scholar]
- Spencer JP, Hund AM. Developmental continuity in the processes that underlie spatial recall. Cognitive Psychology. 2003;47(4):432–480. doi: 10.1016/s0010-0285(03)00099-9. [DOI] [PubMed] [Google Scholar]
- Spencer JP, Simmering VR, Schutte AR. Toward a formal theory of flexible spatial behavior: geometric category biases generalize across pointing and verbal response types. Journal of Experimental Psychology: Human Perception and Performance. 2006;32:473–490. doi: 10.1037/0096-1523.32.2.473. [DOI] [PubMed] [Google Scholar]
- Spencer JP, Simmering VR, Schutte AR, Schöner G. What does theoretical neuroscience have to offer the study of behavioral development? Insights from a dynamic field theory of spatial cognition. In: Plumert JM, Spencer JP, editors. The emerging spatial mind. New York: Oxford University Press; 2007. pp. 320–361. [Google Scholar]
- Thelen E, Schöner G, Scheier C, Smith LB. The dynamics of embodiment: a field theory of infant perseverative reaching. Behavioral and Brain Sciences. 2001;24:1–86. doi: 10.1017/s0140525x01003910. [DOI] [PubMed] [Google Scholar]
- Tversky B, Schiano DJ. Perceptual and conceptual factors in distortions in memory for graphs and maps. Journal of Experimental Psychology: General. 1989;118(4):387–398. doi: 10.1037//0096-3445.118.4.387. [DOI] [PubMed] [Google Scholar]
- Werner S, Diedrichsen J. The time course of spatial memory distortions. Memory and Cognition. 2002;30(5):718–730. doi: 10.3758/bf03196428. [DOI] [PubMed] [Google Scholar]
- Westermann G, Mareschal D. From parts to wholes: mechanisms of development in infant visual object processing. Infancy. 2004;5(2):131–151. doi: 10.1207/s15327078in0502_2. [DOI] [PubMed] [Google Scholar]
- Wilimzig C, Schneider S, Schöner G. The time course of saccadic decision making: dynamic field theory. Special issue: Neurobiology of decision making. Neural Networks. 2006;19(8):1059–1074. doi: 10.1016/j.neunet.2006.03.003. [DOI] [PubMed] [Google Scholar]