

Abstract
OBJECTIVE
To estimate costs for incontinence management, health-related quality of life, and willingness to pay for incontinence improvement in women electing surgery for stress urinary incontinence.
METHODS
A total of 655 incontinent women enrolled in the Stress Incontinence Surgical Treatment Efficacy Trial, a randomized surgical trial. Baseline out-of-pocket costs for incontinence management were calculated by multiplying self-report of resources used (supplies, laundry, dry cleaning) by national resource costs ($2006). Health-related quality of life was estimated with the Health Utilities Index Mark 3. Participants estimated willingness to pay for 100% improvement in incontinence. Potential predictors of these outcomes were examined by using multivariable linear regression.
RESULTS
Mean age was 52±10 years, and mean number of weekly incontinence episodes was 22±21. Mean and median (25%, 75% interquartile range) estimated personal costs for incontinence management among all women were $14±$24 and $8 (interquartile range $3, $18) per week, and 617 (94%) women reported any cost. Costs increased significantly with incontinence frequency and mixed compared with stress incontinence. The mean and median Health Utilities Index Mark 3 scores were 0.73±0.25 and 0.84 (interquartile range 0.63, 0.92). Women were willing to pay a mean of $118±$132 per month for complete resolution of incontinence, and willingness to pay increased significantly with greater expected incontinence improvement, household income, and incontinent episode frequency.
CONCLUSION
Urinary incontinence is associated with substantial costs. Women spent nearly $750 per year out of pocket for incontinence management, had a significant decrement in quality of life, and were willing to pay nearly $1,400 per year for cure.
Urinary incontinence is common among middle aged and older women and is associated with substantial “costs.” In addition to high economic costs, urinary incontinence (UI) results in medical and psychological morbidity and diminished quality of life.1,2 The economic costs of UI are substantial, accounting for over $20 billion per year in the United States,3 with a majority (50–75%) attributed to resources used for incontinence management or “routine care” such as absorbent pads, protection, and laundry. Cost estimates vary widely between studies ($50 to $1000 per person per year) and by method of cost determination.3-9 Studies suggest that costs increase with severity of UI, with expenses for women with daily UI estimated as fourfold higher than for women with weekly UI.6,7 However, there are no primary data quantifying costs for UI management or the predictors of incontinence-related spending among women seeking surgical treatment for UI.
Incontinence is also associated with a profound adverse effect on quality of life.1,2,10-12 Although many studies have quantified the impact of incontinence on general and incontinence-specific quality of life using instruments like the Medical Outcomes Study 36-Item Short-Form Health Survey (SF-36) and the Incontinence Impact Questionnaire, there is less known about the impact of UI on health-related quality of life measured by health utilities instruments. One study found that UI, Alzheimer’s disease, and stroke were the three chronic health conditions that most adversely effected health-related quality of life.13 Another measure of the physical and psychological burden of UI is willingness to pay for UI improvement. Although this method has been used in other chronic conditions like asthma, osteoarthritis, and migraine headache, data on willingness to pay for UI improvement are limited.6,13-15
We conducted this study to provide estimates of the economic costs of resources used at baseline for UI management, health-related quality of life, and willingness to pay for UI improvement among women electing to undergo surgery for stress urinary incontinence.
MATERIALS AND METHODS
From February 2002 to June 2004, 655 community-dwelling adult women electing surgical treatment for predominant stress urinary incontinence were enrolled in the Stress Incontinence Surgical Treatment Efficacy trial (SISTEr), a randomized surgical trial at nine clinical sites in the United States that compared two commonly performed stress UI surgeries—the Burch colposuspension and the autologous rectus fascial sling. Exclusion criteria included pregnancy, systemic disease that affects the bladder (eg, neurologic conditions), or recent pelvic surgery. Details of the study design, inclusion and exclusion criteria, and results have been previously reported.16 The study protocol was approved by the institutional review board at each of the participating institutions, and written informed consent was obtained from all participants.
For our analyses, a cross-sectional study was done at baseline with data collected before randomization using self-report questionnaires, physical examinations, and quantitative testing that included bladder diaries, weighted pad tests, and urodynamic studies. Patient resources used for UI management or “routine care” were assessed by the question “Over the past 7 days, please record the average number of supplies you used each day for your urinary incontinence.” Absorbent supplies included panty liners, minipads, maxipads, incontinence pads, diapers, urethral inserts/occlusive devices, toilet paper, and paper towels. Laundry use was assessed by the question “How many loads of wash did you do during the last 7 days because of your incontinence?” and dry cleaning by “How many items of clothing did you dry clean during the last 7 days because of your incontinence?”
National unit costs were estimated for each type of supply by a survey of 14 stores in six states and one national Internet source accessed in 2006.6 The cost of a load of laundry and dry cleaning was estimated by a survey of five laundromats and five dry cleaners in each of four geographically distant areas in the United States.6 To approximate home laundering cost, we used 80% of the mean laundromat cost ($2.24 per load) to adjust for laundromat-related expenses such as rent and profit. The cost of dry cleaning was estimated as pants $5.03, skirt $5.35, blouse $5.45, dress $9.45, two-piece suit $9.64. Because routine care costs are paid out of pocket by women in the United States, the analysis is from the patient’s perspective.
Health-related quality of life was estimated with the Health Utilities Index Mark 3,17 a validated, generic health-related quality-of-life measure. Although none of the Health Utilities Index health domains is directly associated with incontinence, the Health Utilities Index captures areas affected by the condition and is independently sensitive to incontinence.13 The Health Utilities Index utility score reflects global health-related quality of life measured on a scale from −0.36 to 1.0, where −0.36 is the worst possible state, 0 is associated with death, and 1.0 is the most desirable or the best attainable health. States of health are then quantified on the continuum between these extremes.
Willingness to pay for incontinence improvement was estimated using questions derived from prior studies of incontinence.6,13-15 Women were asked to “imagine that a new treatment for incontinence becomes available that has no adverse effects. This new treatment reduces the number of times you leak urine by one quarter (25%). (For example, if you currently leak urine four times a day, with this new treatment you would leak urine only three times a day. Or if you leak urine every day, this would be reduced to 3 days out of 4.)” Women were asked to estimate “the most money that you would be willing to pay per month out of your own pocket for this treatment?” with response options of $0, $5, $10, $20, $30, $40, $50, $75, $100, $150, $200, or $400. Similar questions were asked for 50% and 100% (dry) improvement in incontinent episode frequency.
Factors potentially associated with costs, health-related quality of life, and willingness to pay were assessed by self-reported questionnaires on demographic characteristics and medical history used in the SISTEr parent study.16 Frequency of UI was assessed by a participant-completed 3-day voiding diary and reported by quartiles. Classification of type of UI was determined by the Medical, Epidemiological, and Social Aspects of Aging questionnaire and defined as “stress only” if only stress UI symptoms were reported or “mixed” UI if both stress and urge UI symptoms were reported. By design of the SISTEr parent study, all women with mixed UI had predominately stress UI symptoms. Amount of urine involuntarily lost was estimated by 24-hour pad test weight. Condition-specific quality-of-life instruments (the Incontinence Impact Questionnaire, Urogenital Distress Inventory) and sexual function (Prolapse/Urinary Incontinence Sexual Questionnaire) were administered. Pelvic organ prolapse was assessed by physical examination (Pelvic Organ Prolapse Quantification), and fecal and flatal incontinence were identified by self-report of “leaking or loss of control of liquid or solid stool or gas.”
Because principal component analysis of the SISTEr baseline data showed that the mean number of UI episodes recorded in the bladder diary, pad test weight, Medical, Epidemiological, and Social Aspects of Aging questionnaire score, and Incontinence Impact Questionnaire score all assessed a single dimension of stress UI with approximately equal weights,18 we used mean UI episodes per day for the primary variable to represent UI severity in this study.
Mean cost for resources used for UI management was calculated by multiplying units of resources used by the mean cost per unit and presented in 2006 United States dollars ($2006). Since the distribution of the cost data was skewed, we calculated the median and 25th and 75th percentiles (interquartile range) as well as mean and standard deviation (SD) for total routine care costs. We report both mean and median cost estimates because the aggregate costs to society are best summarized by mean cost multiplied by the number of people affected by the cost.7 To minimize the outlier effect observed for some cost categories, sensitivity analyses using Winsorization were also used; specifically, costs more than 2 SD above the mean were reset to that limit, and the analyses rerun on the transformed data.19 Summary and univariable statistics were computed for women with any reported costs. Health-related quality of life was determined using the Health Utilities Index score,17 and willingness to pay for alleviation of incontinence was described by plotting the proportions of women willing to pay by the amount to be paid, stratified by the level of expected improvement.
Multivariable linear and proportional odds regression was used to estimate the independent associations of potential predictors established a priori and cost, health-related quality-of-life, and willingness to pay measures. Many of the clinical UI characteristics including type, frequency, and pad weight as well as the quality-of-life scores were highly correlated. Therefore, separate multivariable models were used to estimate the association of each of these variables with weekly UI management cost adjusting for age, body mass index, pelvic organ prolapse stage, ethnicity, annual household income, more than three urinary tract infections in the past year, fecal or flatal incontinence, diabetes, previous UI treatment, and current smoker. An additional model included all of these clinical UI characteristics and quality-of-life scores to determine the variables that independently predicted cost. To meet distributional assumptions, costs were log-transformed; the exponentiated coefficients in this model are interpretable as the ratios of average costs in the comparison and reference groups and were reported as the relative cost. To maximize the precision of the regression coefficient estimates of the risk factors correlated with Health Utilities Index score and the other quality-of-life variables (Incontinence Impact Questionnaire, Urogenital Distress Inventory, Prolapse/Urinary Incontinence Sexual Questionnaire, and self-reported health status), we ran separate models, one with and one without these variables. The ordinal scale of categorized dollar amounts capturing willingness to pay was analyzed using proportional odds models. The proportional odds model is a generalization of the logistic model that is commonly used for ordered multilevel categorical outcomes. Variables with P<.2 in univariable analysis and remaining significant after adjustment were included in the final Health Utilities Index and willingness to pay multivariable models. For ordinal predictors, tests for linear trend were calculated using linear contrasts of the model coefficients. The sample of 655 women provided 80% power to detect between-group differences in continuous outcomes, including log costs and Health Utilities Index scores, of 0.23–0.38 standard deviations, and odds ratios for binary predictors in the proportional odds model for willingness to pay of 1.5–2.0, in both cases depending on the proportion in the reference group. P<.05 was considered statistically significant. All analyses were carried out in SAS 9.1 (SAS Institute, Cary, NC).
RESULTS
The mean (±SD) age of the 655 women was 51.9 (±10.3) years, and participants were 73% white (Table 1). Women reported annual household income of less than $40,000 (37%), $40,000–99,999 (43%), and $100,000 or more (20%). Eighty-four percent of women reported at least daily frequency of urinary incontinence, with a mean of 22 (±21) incontinent episodes per week and a median (interquartile range) of 16 (9, 30).
Table 1.
Baseline Characteristics of Women in Stress Incontinence Surgical Treatment Efficacy Trial (n=655)
| Characteristic | |
|---|---|
| Demographic characteristics | |
| Age (y, mean±SD) | 51.9±10.3 |
| Race or ethnicity | |
| White | 480 (73) |
| Black | 44 (7) |
| Hispanic | 72 (11) |
| Other | 58 (9) |
| Relationship status | |
| Single/not in relationship | 208 (32) |
| Married/in relationship | 447 (68) |
| Education | |
| High school or less | 225 (34) |
| Some college/bachelor’s degree | 360 (55) |
| Graduate degree | 70 (11) |
| Annual household income ($2004) | |
| Less than 40,000 | 223 (37) |
| 40,000-99,999 | 257 (43) |
| 100,000 or more | 117 (20) |
| Reproductive history | |
| Number of vaginal deliveries (mean±SD) |
2.6±1.5 |
| Postmenopausal | 285 (44) |
| Current health and medical history | |
| Body mass index (kg/m2, mean±SD) |
30.0±6.5 |
| Health status | |
| Excellent | 146 (22) |
| Very good | 239 (37) |
| Good | 178 (27) |
| Fair/Poor | 89 (14) |
| Type II diabetes mellitus | 46 (7) |
| Pelvic organ prolapse diagnosis* | |
| Stage 0-I | 162 (25) |
| Stage II | 387 (59) |
| Stage III-IV | 106 (16) |
| Fecal incontinence (monthly or greater frequency)† |
102 (16) |
| Flatal incontinence (weekly or greater frequency)† |
231 (35) |
| Urinary incontinence | |
| Type of incontinence | |
| Stress only | 44 (7) |
| Mixed | 611 (93) |
| Incontinent episodes per day [median (IQR)]‡ |
2 (1, 4) |
| 24-hour pad test weight [g, median (IQR)] |
15 (6, 47) |
| Prior nonsurgical treatment for UI | 296 (45) |
| Prior surgery for UI | 93 (14) |
| More than three urinary tract infections in the past year |
45 (7) |
| Quality of life measures [median (IQR)] | |
| Incontinence Impact Questionnaire score§ | 160 (87, 254) |
| Urogenital Distress Inventory score§ | 150 (120, 182) |
| Prolapse/Urinary Incontinence Sexual | |
| Questionnaire score∥ | 33 (27, 37) |
SD, standard deviation; IQR, 25%, 75% interquartile range; UI, urinary incontinence.
Data are expressed as n (%) unless otherwise indicated
Based on Pelvic Organ Prolapse Quantification score
Fecal incontinence was identified by self-report of “leaking or loss of control of liquid or solid stool” and flatal incontinence by “leaking or loss of control of gas.”
Based on 3-day voiding diary.
The Incontinence Impact Questionnaire and Urogenital Distress Inventory are scored on a scale of 0–400, with a higher score representing greater impact.
Prolapse/Urinary Incontinence Sexual Questionnaire-12 is scored on a scale of 0–48, with a lower score representing greater impact. Includes only sexually active women (n=450)
Nearly all women (n=617; 94%) reported using resources for incontinence management (Table 2). Women not using resources for incontinence management had lower body mass index, higher self-reported health status, higher annual household income, lower incontinent episode frequency, lower scores on the Incontinence Impact Questionnaire and Urogenital Distress Inventory (less impact of incontinence), and a higher stage prolapse, and they were more likely to have stress-only UI compared with women using resources for incontinence (all P<.05 in univariable analyses). The 10% of women with the highest costs accounted for almost 50% of the total costs, and 50% of women accounted for 92% of the total costs. With nearly 85% of women reporting absorbent pad use, this category is the most costly and accounts for 65% of total patient costs for UI management. Over half of the women reported additional loads of laundry (20% of total costs), and 14% reported additional dry cleaning each week for UI (15% of total costs).
Table 2.
Resources Used and Costs per Week for Urinary Incontinence Management Among Women Using Each Resource in SISTEr
| Item | Number (% of Total) Using This Resource |
Number Used per Week |
Cost per Week ($2006)* |
Percentage of Total Estimated Cost |
||
|---|---|---|---|---|---|---|
| Mean±SD | Median (IQR) |
Mean±SD | Median (IQR) |
|||
| Any cost | 617 (94) | NA | NA | 15±25 | 9(4, 19) | 100 |
| Absorbent pads | 549 (84) | 50±40 | 35 (21, 77) | 11±23 | 5(2, 13) | 65 |
| Minipads | 331 (51) | 36±26 | 28 (14, 63) | 2±2 | 2(1, 4) | 8 |
| Maxipads | 198 (30) | 37±26 | 28 (14, 63) | 6±4 | 5(2, 10) | 13 |
| Incontinence pads | 212 (32) | 34±23 | 28 (14, 49) | 11±7 | 9(4, 15) | 24 |
| Diapers | 19 (3) | 31±22 | 21 (14, 49) | 81±58 | 55 (36, 127) | 16 |
| Urethral insert/occlusive device+ |
6(1) | 35±25 | 32 (14, 49) | 62±45 | 56 (25, 82) | 4 |
| Paper towels/toilet paper | 590 (90) | 50±33 | 42 (21, 77) | 0±0 | 0(0, 0) | Less than 1 |
| Laundry (number of loads) | 367 (56) | 2±2 | 2 (1, 3) | 5±4 | 4(2, 7) | 20 |
| Dry cleaning | 89 (14) | 2±2 | 2 (1, 3) | 15±13 | 10 (5, 20) | 15 |
SISTEr, Stress Incontinence Surgical Treatment Efficacy Trial; SD, standard deviation; IQR, 25%, 75% interquartile range; NA, not applicable.
Costs are presented in 2006 United States dollars and were calculated as the number used×unit cost. Unit costs for each item were as follows:minipads $0.062, maxipads $0.164, incontinence pads $0.316, diapers $2.60, toilet paper $0.0024 per sheet, paper towel $0.075 per sheet, and laundry $2.24 per load.
The mean and median estimated weekly patient costs for incontinence management for all women were $14±24 and $8 (interquartile range $3, $18), respectively. For the 617 (94%) women reporting any cost, the mean and median weekly costs were $15±25 and $9 (interquartile range $4, $19; range $0–248), respectively. This represents an annual mean cost of $751±1,277 for all women and $939±1,421 for women with any cost and almost 1% of the median annual household income ($50,000–59,999). In univariable analysis, mean costs per week increased with increasing UI episode frequency, from $8±19 in the lowest quartile (0–1 UI episodes per day) to $27±37 in the highest quartile (more than 4.5 UI episodes per day; P<.001); Table 3). Similar trends and costs were observed with 24-hour pad test weight ($6±7inthe lowest quartile 0–5.5 g) to $28±33 in the highest quartile (more than 47 g; P<.001).
Table 3.
Factors Associated With Weekly Incontinence Management Costs in Univariable and Multivariable Linear Regression for Women in SISTEr
| Univariable Analysis |
|||||||
|---|---|---|---|---|---|---|---|
| Cost per Week ($2006) |
Multivariable Analysis |
||||||
| Item | Number (%)* With Cost |
Mean<SD | Median (IQR) |
Mean Annual Cost |
P† | Relative Cost‡ (95% CI) |
P† |
| Type of incontinence | .003 | .01 | |||||
| Stress only | 37 (84) | 8±9 | 4 (2, 13) | 424±462 | Reference | ||
| Mixed | 580 (95) | 16±25 | 9 (4, 19) | 821±1,308 | 1.8 (1.1-2.9) | ||
| Mean no. of incontinence episodes per day (quartiles)§ |
<.001 | <.001 | |||||
| 0 to 1.0 | 120 (84) | 8±19 | 3 (1, 9) | 419±975 | Reference | ||
| More than 1.0 to 2.5 | 179 (95) | 10±15 | 6 (3, 13) | 528±761 | 1.9 (1.4-2.5) | ||
| More than 2.5 to 4.5 | 166 (99) | 15±17 | 11 (5, 20) | 797±875 | 3.0 (2.2-4.1) | ||
| More than 4.5 | 152 (98) | 27±37 | 18 (8, 27) | 1,415±1,950 | 4.5 (3.2-6.2) | ||
| IIQ (quartiles)∥ | <.001 | <.001 | |||||
| 0 to 86 | 141 (87) | 9±17 | 5 (2, 10) | 458±907 | Reference | ||
| More than 86 to 159 | 154 (94) | 10±10 | 6 (2, 14) | 502±500 | 1.2 (0.9-1.7) | ||
| More than 159 to 254 | 160 (98) | 17±29 | 10 (5, 20) | 904±1,530 | 2.3 (1.6-3.1) | ||
| More than 254 to 400 | 161 (99) | 24±31 | 16 (9, 29) | 1,268±1,598 | 3.1 (2.2-4.4) | ||
SISTEr, Stress Incontinence Surgical Treatment Efficacy Trial; SD, standard deviation; IQR, 25%, 75% interquartile range; CI, confidence interval; IIQ, Incontinence Impact Questionnaire.
Data are adjusted for age, ethnicity, body mass index, annual income, more than one urinary tract infection, pelvic organ prolapse stage, fecal incontinence, diabetes, previous urinary incontinence treatment, and current smoker.
Percentage of women in each category (row).
P values are based on linear regression models with the log(total costs) as the outcome tests.
Relative cost was calculated as the ratio of average cost compared with the reference group by exponentiating the coefficient from the regression model.
Based on 3-day voiding diary.
The Incontinence Impact Questionnaire is scored on a scale of 0-400, with a higher score representing greater effect.
In multivariable-adjusted models, increased UI episode frequency was strongly associated with higher costs: patient costs for incontinence management increased 2-, 3-, and 4.5-fold with each quartile of increased UI episode frequency compared with the lowest quartile (all P<.001; Table 3). Using pad weight instead of UI episode frequency as a measure of incontinence severity, similar associations with costs were observed. Patient costs for UI management were 80% higher for mixed compared with stress-only incontinence (P=.01). These costs also increased with poorer incontinence-specific quality of life (higher scores on the Incontinence Impact Questionnaire). We observed similar results with higher Urogenital Distress Inventory scores (relative cost from lowest to highest quartile: reference, 1.1, 1.5, 1.7; Pfor trend=.001) and lower scores on the Prolapse/Urinary Incontinence Sexual Questionnaire (relative cost from highest to lowest quartile: reference, 1.1, 1.3, 1.7; Pfor trend=.006) and higher general health-related quality of life on the Health Utilities Index (relative cost from lowest to highest quartile: reference, 0.9, 1.2, 1.4; P for trend=.03). We constructed a separate multivariable model to evaluate the independent association of these measures and patient costs for UI management, including the quality-of-life measures—the Incontinence Impact Questionnaire, Urogenital Distress Inventory, Pro-lapse/Urinary Incontinence Sexual Questionnaire and Health Utilities Index—as well self-reported health status. Only a higher Incontinence Impact Questionnaire score (worse UI-specific quality of life) was independently associated with higher patient costs (P<.01). There was no association between age, ethnicity, body mass index, or annual household income and patient costs for UI management. Sensitivity analyses using Winsorized costs produced similar results and trends in costs and predictors of cost.
The mean and median Health Utilities Index score to assess health-related quality of life were 0.73±0.25 and 0.84 (interquartile range 0.63, 0.92; range −0.24 to 1.0), respectively. In multivariable analyses, Health Utilities Index scores were lower with increasing body mass index (P=.009 for trend), more than three urinary tract infections in the past year (P=.003), weekly or greater flatal incontinence (P=.002), currently smoking (P=.008), and stage II compared with stage 0/I pelvic organ prolapse (P=.005) and higher with increasing annual household income (P<.001 for trend; Table 4). We did not observe an association between Health Utilities Index score and age, race or ethnicity, medical comorbidities, or frequency or type of UI. In separate models including condition-specific quality of life (Incontinence Impact Questionnaire, Urogenital Distress Inventory, and Prolapse/Urinary Incontinence Sexual Questionnaire) and health status variables, only Incontinence Impact Questionnaire score and self-report of health status remain independently associated with Health Utilities Index score (P<.001).
Table 4.
Factors Associated With Health Utilities Index Mark 3 Score in Multivariable Linear Regression for Women in SISTEr
| Variable | Effect Estimate (95% CI) |
P |
|---|---|---|
| Body mass index (kg/m2) | .009* | |
| Less than 25 | Reference | |
| 25 to less than 30 | −0.03 (−0.08 to 0.02) | |
| 30 to less than 40 | −0.05 (−0.10 to 0.003) | |
| More than 40 | −0.10 (−0.18 to −0.02) | |
| Annual household income ($2004 dollars) |
<.001* | |
| Less than 40,000 | Reference | |
| 40,000-99,999 | 0.14 (0.01 to 0.18) | |
| 100,000 or more | 0.20 (0.16 to 0.27) | |
| Current smoker | −0.08 (−0.13 to −0.02) | .008† |
| Pelvic organ prolapse | .28* | |
| Stage 0−I | Reference | |
| Stage II | −0.06 (−0.11 to −0.02) | |
| Stage III−IV | −0.04 (−0.10 to 0.03) | |
| More than three UTIs in past year |
−0.11 (−0.18 to −0.04) | .003† |
| Weekly flatal incontinence | −0.06 (−0.10 to −0.02) | .002† |
SISTEr, Stress Incontinence Surgical Treatment Efficacy Trial; CI, confidence interval; UTIs, urinary tract infections.
This analysis includes women with nonmissing parameter values (n=591).
P value from test for trend.
P value for heterogeneity.
Women were willing to pay more for greater expected reduction in UI episode frequency, from a mean of $31±76 per month for 25% reduction (median $0) to $44±80 for 50% reduction (median $20) and $118±132 for 100% reduction (median $50) in UI episode frequency (P<.001 for trend; Fig. 1). Thus, women were willing to pay about 1% of their annual household income for 100% improvement. In multivariable analyses, willingness to pay for alleviation of incontinence was higher with greater expected benefit (P<.001). Willingness to pay for complete resolution of UI (100% reduction) increased with household income to almost fourfold more in the highest compared with the lowest income categories (odds ratio [OR] 3.69, 95% confidence interval [CI] 2.36–5.77); P<.01 for trend) and with UI episode frequency, being almost threefold higher for women in the highest compared with the lowest quartile of UI episode frequency (OR 2.79, 95% CI 1.77–4.40; P<.01). Willingness to pay decreased by 45% with poorer self-reported health status (fair/poor compared with excellent, OR 0.53, 95% CI 0.31–0.92; P=.02) and prior UI surgery (OR 0.56, 95% CI 0.37–0.84; P=.01). We did not observe an association between willingness to pay for 100% improvement in UI and race or ethnicity or type of UI.
Fig. 1.
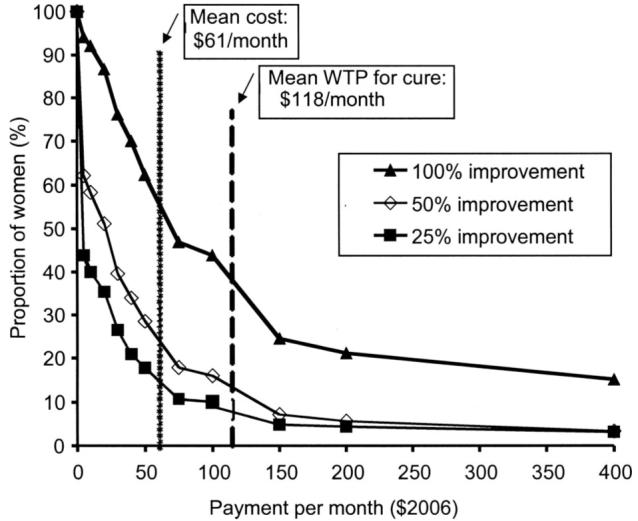
Willingness to pay for alleviation of incontinence. The proportion of women willing to pay each dollar amount per month for 25%, 50%, and 100% reduction in incontinence frequency is depicted. Women were willing to pay more for greater expected reduction in incontinent episode frequency (P<.001 for trend). The dotted line is the current monthly cost for incontinence management for all women in the Stress Incontinence Surgical Treatment Efficacy trial (SISTEr) ($61 per month) and dashed line is the mean willingness to pay per month for incontinence cure ($118 per month).
DISCUSSION
The economic and personal costs of incontinence are substantial for women electing to undergo surgery for stress urinary incontinence. Women in the SISTEr trial spent a median of almost $500 per year out of pocket for UI management at baseline. Although this may be affordable for some women, this represents almost 1% of the median annual household income of women in the study ($50,000–59,999), which is comparable to the mean annual out-of-pocket spending on prescription drugs for workers with health insurance benefits.20 Patient costs for UI management were strongly associated with UI episode frequency and mixed compared with the stress-only type of UI and had no association with annual household income, similar to findings in other cohorts.6,7 In addition, women in SISTEr reported a significant decrement in health-related quality of life as well as physical and psychological burden, as reflected by high willingness to pay for UI improvement.
Most women in this study (94%) reported incontinence-related resource use and costs for UI management. In prior studies among women with similar frequency of UI, fewer women (70–90%) reported incontinence-related resource use.6,7 In addition to more women using any resources, the volume of resources used and, therefore, the patient costs for UI management were substantially higher in this cohort. Both the median and mean weekly patient costs for incontinence management in this cohort were 2- to 5-fold higher than costs observed in other cross-sectional studies of women with UI.3-9,21-25 A recent population-based cohort and a cross-sectional study used similar instruments to assess costs and included women with comparable incontinence episode frequency to those in our cohort, which is critical since incontinence frequency is one of the strongest predictors of incontinence-related costs.6,7 Interestingly, women in SISTEr reported 1.5- to 4-fold higher mean and 2- to 15-fold higher median costs for incontinence management compared with women in these other studies. An important difference between the study populations is that all women in SISTEr were seeking surgical treatment for incontinence compared with few7 or none6 having sought any type of incontinence treatment in the other studies. Women in SISTEr were bothered enough by incontinence to elect surgery and may have been bothered enough to be paying more for its management. In addition, women may elect surgery for financial reasons if longer-term, out-of pocket expenses for incontinence management are greater than those for surgery.
Another “cost” of incontinence for patients is an adverse effect on quality of life. Health-related quality of life, assessed by the Health Utilities Index score, was very poor in this cohort (0.73), similar to Health Utilities Index scores reported among women with incontinence in population-based surveys in Canada (0.64 and 0.70) and lower than scores observed in women with incontinence who had not sought evaluation or treatment (0.90 for women with weekly and 0.81 for women with daily UI).2,6,13,26 For context, the mean Health Utilities Index score for women aged 45 years and older with no chronic medical conditions is reported as 0.92, and a difference in Health Utilities Index score of 0.09 or greater represents severe clinical impact.13,27 Observations in this study may reflect the severe impact on health-related quality of life, despite similar frequency of incontinence, experienced by women preparing to undergo incontinence surgery. Women with stress UI reported Health Utilities Index scores comparable to those reported by community-dwelling women similar in age to women in this study with other chronic and debilitating medical conditions like stroke, cancer, diabetes, back pain, and Alzheimer’s or other dementia (Fig. 2).2,13,28
Fig. 2.
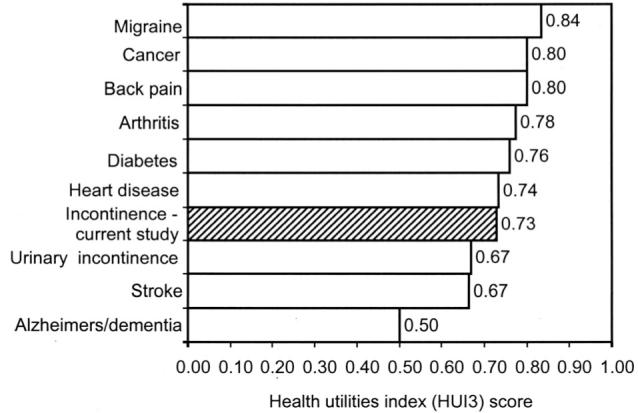
Mean of Health Utilities Index (HUI3) scores in published population-based, cross-sectional studies of chronic health conditions. The shaded bar is the mean HUI3 score observed in the current study.
Our study confirms previous findings that women with UI envision substantial benefits from a reduction in frequency of incontinence episodes. Women were willing to pay more for greater expected reduction in incontinence episode frequency, from a mean of $44 per month for 50% reduction to $118 per month for 100% reduction in incontinence episode frequency (P<.001 for trend). The amount women were willing to pay for 100% alleviation of stress incontinence was similar to willingness to pay for complete relief of asthma, migraine headaches, and gastroesophageal reflux symptoms.29-32 The observation that mean willingness to pay for cure ($118 per month) exceeded the mean ($61 per month) cost for incontinence management in our study suggests that effective incontinence treatment may be economically beneficial and also improve quality of life.
Our study population included community-dwelling women enrolling in a randomized, surgical trial. Therefore, these results may not be generalizable to other incontinent women. Although the SISTEr trial had ongoing prospective data collection, the baseline data presented here are cross-sectional and, therefore, cannot document causal associations. Pads, laundry, and dry cleaning may also have been used for nonincontinence reasons, and this may have inflated women’s estimates of resource use. Recall of resource use during a typical week was used to minimize participant burden. Because individuals may over- or underreport their use of resources,6,24 systematic variance in this discrepancy may bias our findings. In our health care system of third-party payer coverage, attaching a dollar value to willingness to pay for condition improvement can be unfamiliar to respondents and, therefore, give misleading data.
In summary, urinary incontinence was associated with substantial costs. Women in this study spent almost 1% of the median annual household income for incontinence management, an amount comparable to annual out-of-pocket spending on prescription drugs.20 The impact of stress incontinence on health-related quality of life is similar to the impact of other chronic and debilitating medical conditions such as stroke, cancer, diabetes, back pain, and dementia.13,28 Women were willing to pay over $1,400 per year for 100% improvement in incontinence, which is similar to willingness to pay for complete relief of asthma, migraine headaches, and gastroesophageal reflux symptoms.29-32 These data underscore the substantial economic and quality-of-life costs of incontinence and the importance of effective incontinence treatment.
Acknowledgments
Supported by grants from the National Institute of Diabetes and Digestive and Kidney Diseases, U01 DK58225, U01 DK58229, U01 DK58234, U01 DK58231, U01 DK60379, U01 DK60380, U01 DK60393, U01 DK60395, U01 DK60397, and 60401. Supported was also provided by the National Institute of Child Health and Human Development and Office of Research in Women’s Health, National Institutes of Health.
Footnotes
Financial Disclosure
Dr. Brubaker received research funding from Allergan (Irvine, CA) and Pfizer Pharmaceuticals, Inc. (New York, NY). Dr. Diokno received honoraria from Medtronic (Minneapolis, MN), Astellas Pharma Inc. (Tokyo, Japan), and Ortho Urology (Raritan, NJ). He also received grants and contracts from Allergan and GlaxoSmithKline (Philadelphia, PA). Dr. Goode has received honoraria from Otho McNeil (Titusville, NJ). Dr. Lukacz has served as a consultant to and speaker for Pfizer Pharmaceuticals, Inc., and served as a speaker for Novartis Pharmaceuticals, Inc. (Basel, Switzerland). The other authors have no potential conflicts to disclose.
REFERENCES
- 1.Hunskaar S, Vinsnes A.The quality of life in women with urinary incontinence as measured by the sickness impact profile [published erratum appears in J Am Geriatr Soc 1992;40:976–7]. J Am Geriatr Soc 199139378–82. [DOI] [PubMed] [Google Scholar]
- 2.Mittmann N, Trakas K, Risebrough N, Liu BA. Utility scores for chronic conditions in a community-dwelling population. Pharmacoeconomics. 1999;15:369–76. doi: 10.2165/00019053-199915040-00004. [DOI] [PubMed] [Google Scholar]
- 3.Wilson L, Brown JS, Shin GP, Luc KO, Subak LL. Annual direct cost of urinary incontinence. Obstet Gynecol. 2001;98:398–406. doi: 10.1016/s0029-7844(01)01464-8. [DOI] [PubMed] [Google Scholar]
- 4.Dowell CJ, Bryant CM, Moore KH, Simons AM. Calculating the direct costs of urinary incontinence: a new test instrument. BJU Int. 1999;83:596–606. doi: 10.1046/j.1464-410x.1999.00993.x. [DOI] [PubMed] [Google Scholar]
- 5.McClish DK, Wyman JF, Sale PG, Camp J, Earle B.Use and costs of incontinence pads in female study volunteers. Continence Program for Women Research Group J Wound Ostomy Continence Nurs 199926207–8., 210-3. [PubMed] [Google Scholar]
- 6.Subak LL, Brown JS, Kraus SR, Brubaker L, Lin F, Richter HE, et al. The “costs” of urinary incontinence for women. Obstet Gynecol. 2006;107:908–16. doi: 10.1097/01.AOG.0000206213.48334.09. [DOI] [PMC free article] [PubMed] [Google Scholar]
- 7.Subak LL, Van Den Eeden SK, Thom DH, Creasman JM, Brown JS. Urinary incontinence in women: direct costs of routine care. Am J Obstet Gynecol. 2007;197:1–9. doi: 10.1016/j.ajog.2007.04.029. [DOI] [PubMed] [Google Scholar]
- 8.Tediosi F, Parazzini F, Bortolotti A, Garattini L. The cost of urinary incontinence in Italian women: a cross-sectional study. Gruppo di Studio Incontinenza Pharmacoeconomics. 2000;17:71–6. doi: 10.2165/00019053-200017010-00005. [DOI] [PubMed] [Google Scholar]
- 9.Wagner TH, Hu TW. Economic costs of urinary incontinence in 1995. Urology. 1998;51:355–61. doi: 10.1016/s0090-4295(97)00623-7. [DOI] [PubMed] [Google Scholar]
- 10.Hagen S, Hanley J, Capewell A. Test-retest reliability, validity, and sensitivity to change of the urogenital distress inventory and the incontinence impact questionnaire. Neurourol Urodyn. 2002;21:534–9. doi: 10.1002/nau.10075. [DOI] [PubMed] [Google Scholar]
- 11.Mardon RE, Halim S, Pawlson GL, Haffer SC. Management of urinary incontinence in Medicare managed care beneficiaries: results from the 2004 Medicare Health Outcomes Survey. Arch Intern Med. 2006;166:1128–33. doi: 10.1001/archinte.166.10.1128. [DOI] [PubMed] [Google Scholar]
- 12.Wetle T, Scherr P, Branch LG, Resnick NM, Harris T, Evans D, et al. Difficulty with holding urine among older persons in a geographically defined community: prevalence and correlates. J Am Geriatr Soc. 1995;43:349–55. doi: 10.1111/j.1532-5415.1995.tb05806.x. [DOI] [PubMed] [Google Scholar]
- 13.Schultz SE, Kopec JA. Impact of chronic conditions. Health Rep. 2003;14:41–53. [PubMed] [Google Scholar]
- 14.Johannesson M, O’Conor RM, Kobelt-Nguyen G, Mattiasson A. Willingness to pay for reduced incontinence symptoms. Br J Urol. 1997;80:557–62. doi: 10.1046/j.1464-410x.1997.00420.x. [DOI] [PubMed] [Google Scholar]
- 15.Kobelt G.Economic considerations and outcome measurement in urge incontinence Urology 199750100–7.; discussion 108–10. [DOI] [PubMed] [Google Scholar]
- 16.Tennstedt S. Design of the Stress Incontinence Surgical Treatment Efficacy Trial (SISTEr) Urology. 2005;66:1213–7. doi: 10.1016/j.urology.2005.06.089. [DOI] [PubMed] [Google Scholar]
- 17.Feeny D, Furlong W, Boyle M, Torrance GW. Multi-attribute health status classification systems. Health Utilities Index. Pharmacoeconomics. 1995;7:490–502. doi: 10.2165/00019053-199507060-00004. [DOI] [PubMed] [Google Scholar]
- 18.Richter HE, Burgio KL, Brubaker L, Moalli PA, Markland AD, Mallet V, et al. Factors associated with incontinence frequency in a surgical cohort of stress incontinent women. Am J Obstet Gynecol. 2005;193:2088–93. doi: 10.1016/j.ajog.2005.07.068. [DOI] [PubMed] [Google Scholar]
- 19.Tukey JW. Exploratory data analysis. Addison-Wesley; Reading (MA): 1977. [Google Scholar]
- 20.Joyce GF, Escarce JJ, Solomon MD, Goldman DP.Employer drug benefit plans and spending on prescription drugs [published erratum appears in JAMA 2002;288:2409]. JAMA 20022881733–9. [DOI] [PubMed] [Google Scholar]
- 21.Black NA, Bowling A, Griffiths JM, Pope C, Abel PD. Impact of surgery for stress incontinence on the social lives of women. Br J Obstet Gynaecol. 1998;105:605–12. doi: 10.1111/j.1471-0528.1998.tb10174.x. [DOI] [PubMed] [Google Scholar]
- 22.Hu TW, Wagner TH, Bentkover JD, Leblanc K, Zhou SZ, Hunt T. Costs of urinary incontinence and overactive bladder in the United States: a comparative study. Urology. 2004;63:461–5. doi: 10.1016/j.urology.2003.10.037. [DOI] [PubMed] [Google Scholar]
- 23.Samuelsson E, Mansson L, Milsom I. Incontinence aids in Sweden: users and costs. BJU Int. 2001;88:893–8. doi: 10.1046/j.1464-4096.2001.01429.x. [DOI] [PubMed] [Google Scholar]
- 24.Sandvik H, Hunskaar S. The epidemiology of pad consumption among community-dwelling incontinent women. J Aging Health. 1995;7:417–26. doi: 10.1177/089826439500700305. [DOI] [PubMed] [Google Scholar]
- 25.Wyman J. The “costs” of urinary incontinence. Eur Urol. 1997;32(suppl):13–9. [PubMed] [Google Scholar]
- 26.Sintonen H. The 15D instrument of health-related quality of life: properties and applications. Ann Med. 2001;33:328–36. doi: 10.3109/07853890109002086. [DOI] [PubMed] [Google Scholar]
- 27.Drummond M. Introducing economic and quality of life measurements into clinical studies. Ann Med. 2001;33:344–9. doi: 10.3109/07853890109002088. [DOI] [PubMed] [Google Scholar]
- 28.Mo F, Choi BC, Li FC, Merrick J. Using Health Utility Index (HUI) for measuring the impact on health-related quality of life (HRQL) among individuals with chronic diseases. Scientific-WorldJournal. 2004;4:746–57. doi: 10.1100/tsw.2004.128. [DOI] [PMC free article] [PubMed] [Google Scholar]
- 29.Lloyd A, McIntosh E, Rabe KF, Williams A. Patient preferences for asthma therapy: a discrete choice experiment. Prim Care Respir J. 2007;16:241–8. doi: 10.3132/pcrj.2007.00052. [DOI] [PMC free article] [PubMed] [Google Scholar]
- 30.Zillich AJ, Blumenschein K, Johannesson M, Freeman P. Assessment of the relationship between measures of disease severity, quality of life, and willingness to pay in asthma. Pharmacoeconomics. 2002;20:257–65. doi: 10.2165/00019053-200220040-00004. [DOI] [PubMed] [Google Scholar]
- 31.Kleinman L, McIntosh E, Ryan M, Schmier J, Crawley J, Locke GR, 3rd, et al. Willingness to pay for complete symptom relief of gastroesophageal reflux disease. Arch Intern Med. 2002;162:1361–6. doi: 10.1001/archinte.162.12.1361. [DOI] [PubMed] [Google Scholar]
- 32.Lenert LA. Use of willingness to pay to study values for pharmacotherapies for migraine headache. Med Care. 2003;41:299–308. doi: 10.1097/01.MLR.0000044909.63278.0D. [DOI] [PubMed] [Google Scholar]