

Abstract
To identify traits that predict avian pathogenic Escherichia coli (APEC) virulence, 124 avian E. coli isolates of known pathogenicity and serogroup were subjected to virulence genotyping and phylogenetic typing. The results were analyzed by multiple-correspondence analysis. From this analysis, five genes carried by plasmids were identified as being the most significantly associated with highly pathogenic APEC strains: iutA, hlyF, iss, iroN, and ompT. A multiplex PCR panel targeting these five genes was used to screen a collection of 994 avian E. coli isolates. APEC isolates were clearly distinguished from the avian fecal E. coli isolates by their possession of these genes, suggesting that this pentaplex panel has diagnostic applications and underscoring the close association between avian E. coli virulence and the possession of ColV plasmids. Also, the sharp demarcation between APEC isolates and avian fecal E. coli isolates in their plasmid-associated virulence gene content suggests that APEC isolates are well equipped for a pathogenic lifestyle, which is contrary to the widely held belief that most APEC isolates are opportunistic pathogens. Regardless, APEC isolates remain an important problem for poultry producers and a potential concern for public health professionals, as growing evidence suggests a possible role for APEC in human disease. Thus, the pentaplex panel described here may be useful in detecting APEC-like strains occurring in poultry production, along the food chain, and in human disease. This panel may be helpful toward clarifying potential roles of APEC in human disease, ascertaining the source of APEC in animal outbreaks, and identifying effective targets of avian colibacillosis control.
Avian pathogenic Escherichia coli (APEC) isolates cause colibacillosis in birds raised for meat and eggs (2). This disease results in significant morbidity and mortality, which translates into multimillion-dollar annual losses for all facets of the world's poultry industry (2). It is estimated that at least 30% of the commercial flocks in the United States, at any point in time, are affected by colibacillosis. Recent reports have suggested a link between APEC and human disease (13, 36). Thus, the enhanced control of avian colibacillosis could prove beneficial to both animal and human health.
Management approaches based on the protection of poultry from predisposing conditions have proved largely ineffective in controlling avian colibacillosis (2). Also, evidence exists that APEC isolates are becoming more resistant to antimicrobial agents (17, 23, 29, 47), indicating that the control of colibacillosis is likely to become even more problematic in the future. Further complicating the control of this disease is the fact that antimicrobial usage in animal production is undergoing unprecedented scrutiny, with limitations placed on the use of certain agents in poultry production. Consequently, the vaccine-based control of avian colibacillosis, where appropriate, is likely to become increasingly desirable.
Unfortunately, vaccines designed to prevent avian colibacillosis have met with mixed results. Although vaccines against various APEC isolates have been produced (1, 3, 7, 14, 25, 26, 34, 38), some have proved effective only against homologous challenge (26, 34). This type of vaccine failure is a critical impediment to colibacillosis control, often because of the diversity of APEC populations (36, 37). Despite this diversity, recent efforts to define the APEC pathotype have shown that most APEC isolates contain a highly conserved cluster of plasmid-linked virulence genes that occurs in relatively few avian fecal commensal E. coli (AFEC) isolates (22, 37). Thus, the exploitation of these plasmid traits or other common APEC markers as the targets of future diagnostic tools and/or vaccines may yield colibacillosis control measures with widespread applicability.
Indeed, attempts to exploit this association between plasmid genes and APEC virulence to improve colibacillosis control already are under way. Lynne et al. (28) described the testing of a vaccine that targeted a plasmid-mediated trait, and others have described rapid diagnostic tools that identify APEC isolates based on the possession of certain genes, including plasmid-linked ones (11, 41). Unfortunately, these attempts were made prior to the recognition that these plasmid genes are ubiquitous among APEC isolates and before multiple APEC plasmid sequences had become available (21, 22). Also, these procedures were validated with relatively small samples of isolates. Here, we build on recent knowledge to more clearly define the APEC pathotype and to apply this definition to the development of a diagnostic test useful in predicting an avian E. coli strain's ability to cause disease. In addition to describing the use of multiple-correspondence analysis (MCA) in studying the traits of APEC isolates and their relationship to disease in birds, this study describes the use of MCA to predict the abilities of extraintestinal pathogenic E. coli (ExPEC) isolates to cause disease in their natural hosts rather than in a model system.
MATERIALS AND METHODS
Bacterial strains.
For genotyping studies, a total of 994 isolates were used (Table 1). This population included 794 APEC isolates, which were defined as E. coli strains isolated from lesions of birds clinically diagnosed with colibacillosis, and 200 AFEC isolates, which were isolated from the feces of apparently healthy birds. These isolates originated from various farms and flocks throughout the United States. Of these, 556 isolates were previously characterized for the presence of a subset of the genes included in this study (37). Also included among the 794 APEC isolates were 124 strains that were previously assigned to low-, intermediate-, or high-pathogenicity groups based on lesions and mortalities observed in experimentally infected chicks (6, 39, 40). Isolates were serogrouped by the E. coli Reference Center at Pennsylvania State University, University Park.
TABLE 1.
Bacterial strains used in this study
| No. of strains | Geographical location/origin (reference) | Source(s) | Type of available results |
|---|---|---|---|
| APEC | |||
| 670 | GA, MD, NC, ND, MN, Penn State University (22, 35, 36) | Chickens and turkeys clinically diagnosed with various forms of colibacillosis | Virulence genotyping, serogrouping, phylogenetic typing, and cluster analysis |
| 124 | Delmarva peninsula (6, 39, 40) | Commercially raised broilers clinically affected by colibacillosis | Virulence genotyping; serogrouping, phylogenetic typing, cluster analysis, pathotyping, and multiple correspondence analysis |
| AFEC | |||
| 200 | ND, SD, MN (22, 35, 36) | Fecal/cloacal swabs from apparently healthy birds | Virulence genotyping, serogrouping, phylogenetic typing, and cluster analysis |
Virulence genotyping.
For multiplex PCR studies screening for virulence genes and phylogenetic typing, template DNA was prepared using boiled lysates, as previously described (20). DNA was stored at −20°C until used. This study used previously described results (37) in combination with novel data. Primers for this procedure have been previously described (37). Test and control organisms were amplified in several multiplex procedures.
Phylogenetic typing.
Isolates were assigned to phylogenetic groups according to the method of Clermont et al. (5). Using this method, isolates are assigned to one of four groups (A, B1, B2, or D) based on their possession of two genes (chuA and yjaA) and a DNA fragment (TSPE4.C2) as determined by PCR. Boiled lysates of overnight cultures were used as a source of template DNA as described above.
Diagnostic pentaplex procedure.
MCA was used to identify traits corresponding to APEC isolates assigned to different pathogenicity groups (6, 16). From this analysis, the best five genes in terms of correspondence with pathogenicity were targeted in a multiplex PCR procedure (Table 2). The amplification of the five gene targets for the diagnostic multiplex protocol was accomplished under the following reaction conditions: 4 mM magnesium chloride, 0.25 mM deoxynucleoside triphosphates (USB Corporation, Cleveland, OH), 0.3 μM each primer (Integrated DNA Technologies, Iowa City, IA), and 1 U HotMaster Taq DNA polymerase (Eppendorf, Westbury, NY). The reactions were performed using a Mastercycler EP machine (Eppendorf) using the following cycling parameters: 94°C for 2 min; 25 cycles of 94°C for 30 s, 63°C for 30 s, 68°C for 3 min; and a final cycle of 72°C for 10 min.
TABLE 2.
Primer sequences and gene descriptions
| Gene | Amplicon size (bp) | Sequence | Description (reference) |
|---|---|---|---|
| iroN | 553 | AATCCGGCAAAGAGACGAACCGCCT | Salmochelin siderophore receptor gene (22) |
| GTTCGGGCAACCCCTGCTTTGACTTT | |||
| ompT | 496 | TCATCCCGGAAGCCTCCCTCACTACTAT | Episomal outer membrane protease gene (22) |
| TAGCGTTTGCTGCACTGGCTTCTGATAC | |||
| hlyF | 450 | GGCCACAGTCGTTTAGGGTGCTTACC | Putative avian hemolysin (32) |
| GGCGGTTTAGGCATTCCGATACTCAG | |||
| iss | 323 | CAGCAACCCGAACCACTTGATG | Episomal increased serum survival gene (24) |
| AGCATTGCCAGAGCGGCAGAA | |||
| iutA | 302 | GGCTGGACATCATGGGAACTGG | Aerobactin siderophore receptor gene |
| CGTCGGGAACGGGTAGAATCG |
All samples were subjected to horizontal gel electrophoresis in 2% agarose, and amplicon sizes were determined by comparison to the Hi-Lo DNA marker obtained from Minnesota Molecular Inc. (MN). Strains known to possess or lack the genes of interest were examined with each amplification procedure. An isolate was considered to contain a gene of interest if it produced an amplicon of the expected size (Table 2). To verify the accuracy of the amplification procedure, amplicons from control organisms were excised from the gels and subjected to DNA sequencing. In all cases, amplicons of the sizes predicted had their identities confirmed by sequencing.
Statistical analyses.
Fisher's exact test was used to test the null hypothesis of equal gene prevalence rates across the two populations studied. Due to the relatively large number of traits, stepdown permutation multiplicity adjustments were used to address the associated inflation of the type I error rate (44). In a further attempt to discern patterns among all isolates based on their content of virulence genes (papGI′ was excluded, as it was absent in all isolates), multivariate statistics were used. MCA was used to look for associations among the presence of traits and pathotypes, phylogenetic groups, and serotypes simultaneously (16). A linear discriminant analysis (LDA) was used to determine if isolate type (APEC or AFEC) could be predicted based on the virulence genes present (15). Although the use of data from binary variables in an LDA, as done here, violates the assumption of multivariate normality, LDA was used because parametric LDA can be very robust in spite of such violations (30). Additionally, a cluster analysis of the isolates was performed using the average linkage method based upon Jaccard's dissimilarity coefficient calculated from the presence of virulence genes (SAS 9.0). In order to better discern patterns among the isolates, the results of the cluster and discriminant analyses, along with the isolates' virulence genotypes, phylogenetic groups, and states of origin, were used to construct a single figure based on principles of Eisen et al. (10).
RESULTS
A group of 124 avian E. coli isolates were previously assigned to high-, intermediate-, and low-pathogenicity groups based on the lesions and mortality they caused in experimentally infected chickens (40). For the present study, these isolates were examined for serogroups, phylogenetic groups, and virulence genotypes. Several significant differences in gene distribution were found among the APEC isolates of the three pathotypes using Fisher's exact test (P < 0.05) and included etsA, etsB, hlyF, iutA, papC, ireA, kpsMT2, episomal ompT, and papG2 (Table 3 ). In most cases, a higher proportion of APEC isolates of the high-pathogenicity group contained the genes of interest than did the APEC isolates assigned to the intermediate- or low-pathogenicity group.
TABLE 3.
Relationship between APEC pathotype (high, intermediate, or low pathogenicity) and gene prevalence
| Genea | No. of isolates carrying (+) or lacking (−) the gene according to APEC pathotype
|
Probabilityb | |||||
|---|---|---|---|---|---|---|---|
| High + (n = 73) | High − (n = 73) | Intermediate + (n = 26) | Intermediate − (n = 26) | Low + (n = 25) | Low − (n = 25) | ||
| etsA | 69 | 4 | 22 | 4 | 17 | 8 | 0.0027 |
| etsB | 69 | 4 | 22 | 4 | 17 | 8 | 0.0027 |
| hlyF | 71 | 2 | 23 | 3 | 20 | 5 | 0.0133 |
| iutA | 71 | 2 | 23 | 3 | 20 | 5 | 0.0133 |
| papC | 30 | 43 | 10 | 16 | 3 | 22 | 0.0223 |
| ireA | 33 | 40 | 12 | 14 | 4 | 21 | 0.0232 |
| kpsMT2 | 15 | 58 | 0 | 26 | 4 | 21 | 0.0232 |
| Episomal ompT | 69 | 4 | 23 | 3 | 19 | 6 | 0.031 |
| papGII | 27 | 46 | 10 | 16 | 3 | 22 | 0.0482 |
| papEF | 27 | 46 | 9 | 17 | 3 | 22 | 0.0549 |
| cvaA | 61 | 12 | 18 | 8 | 16 | 9 | 0.0716 |
| cvaB5 | 61 | 12 | 18 | 8 | 16 | 9 | 0.0716 |
| malPAI | 10 | 63 | 1 | 25 | 0 | 25 | 0.0726 |
| papG23 | 23 | 50 | 10 | 16 | 3 | 22 | 0.0841 |
| Episomal iss | 65 | 8 | 21 | 5 | 18 | 7 | 0.1077 |
| kpsMT1 | 14 | 59 | 1 | 25 | 3 | 22 | 0.1722 |
| fyuA | 28 | 45 | 11 | 15 | 5 | 20 | 0.1913 |
| iha | 0 | 73 | 0 | 26 | 1 | 24 | 0.2016 |
| papA | 13 | 60 | 3 | 23 | 1 | 24 | 0.2297 |
| vat | 32 | 41 | 10 | 16 | 6 | 19 | 0.2405 |
| ibeA | 2 | 71 | 0 | 26 | 2 | 23 | 0.2727 |
| cvaB3 | 49 | 24 | 14 | 12 | 14 | 11 | 0.3723 |
| gimB | 6 | 67 | 0 | 26 | 1 | 24 | 0.376 |
| cvaC | 41 | 32 | 12 | 14 | 11 | 14 | 0.4935 |
| eitA | 42 | 31 | 14 | 12 | 11 | 14 | 0.508 |
| eitB | 42 | 31 | 14 | 12 | 11 | 14 | 0.508 |
| fliCH7 | 3 | 70 | 0 | 26 | 0 | 25 | 0.5678 |
| cbi | 27 | 46 | 10 | 16 | 12 | 13 | 0.6474 |
| Chromosomal ompT | 33 | 40 | 12 | 14 | 9 | 16 | 0.6996 |
| cma | 18 | 55 | 7 | 19 | 7 | 18 | 0.8833 |
| bmaE | 1 | 72 | 0 | 26 | 0 | 25 | 1 |
| iroN | 63 | 10 | 23 | 3 | 22 | 3 | 1 |
Note that only 32 genes are listed, since kpsMT3, cnf1, sfafoc, papGIII, hlyD, rfc, papG1, papGI, gafD, cdtB, focG, papGI′, afa, and sfaS occurred in none of these isolates.
The probability column shows the P values for Fisher's exact test of the homogeneity of prevalence rates across the pathogenicity groups for each gene.
Virulence genotypes, serogroups, and phylogenetic groups of these 124 APEC isolates also were subjected to MCA in order to determine which traits corresponded to the different pathogenicity groups (16, 40). Figure 1 graphs the results of this analysis. In this plot, corresponding factors associate with one another, but the distance between factors is not an indicator of the degree of correspondence. Factors associated with the three pathogenicity groups clustered about the origin of the plot and included the phylogenetic groups A, B1, and D but not B2. Also, corresponding with these pathotypes were all of the plasmid genes studied (episomal iss, iroN, episomal ompT, eitAB, cvaABC, cbi, cma, iutA, hlyF, and etsAB) and some of the chromosomal genes (chromosomal ompT, ireA, fyuA, papACEFG, and vat). Certain serogroups also corresponded with these three pathotypes, including O2, O11, O35, O78, and others. The B2 phylogenetic group corresponded with gimB, kpsMT1, ibeA, kpsMT2, malX, the gene encoding the H7 flagellar antigen, and the O1 serogroup, but these did not correspond with any of the APEC pathogenicity groups (Fig. 1).
FIG. 1.

MCA of 124 avian E. coli isolates of known pathogenicity, taking into account virulence genotypes, phylogenetic groups, and serogroups O1, O2, O11, O35, O36, O78, OT (other typeable serogroups are lumped together), and NT (nontypeable).
In addition, 794 APEC and 200 AFEC isolates were serogrouped, assigned to phylogenetic groups, and virulence genotyped, and the results were subjected to cluster analysis in an effort to identify patterns among the data (Table 4 and Fig. 2). Three major clusters could be discerned. Isolates in cluster 1 (red) generally were lacking in the traits examined, members of cluster 2 (green) were generally found to possess the plasmid-associated traits but lack the chromosome-associated traits, and isolates in cluster 3 (blue) possessed a combination of plasmid-associated and chromosome-associated traits. All but 40 AFEC isolates fell into cluster 1, with the remaining 40 AFEC isolates falling into cluster 2; no AFEC isolates fell into cluster 3. Notably, the 40 AFEC isolates falling into cluster 2 each had some, but not all, of the plasmid-associated genes. Thus, the assignment of an isolate to cluster 2 was due to the presence of only some of these genes. By contrast, most APEC isolates contained the plasmid pathogenicity-associated island (PAI) genes that previously were identified as being highly conserved among APEC isolates, including sitA, iutA, hlyF, episomal ompT, etsAB, episomal iss, iroN, and cvaABC (12, 13, 22, 27, 36, 46, 48). In addition to these plasmid genes, members of cluster 3, which were exclusively APEC isolates, also were characterized by the possession of certain chromosomal genes, including fyuA, ireA, the pap operon genes, vat, capsular biosynthesis genes (K1 and K2 capsule types), and other PAI markers (malX, ibeA, and gimB). The most commonly occurring serogroups among the APEC isolates examined were O78 (18.5%) and O2 (13.1%) (Table 5). However, 22.3% of the isolates examined were nontypeable, and a high degree of diversity was found among the remaining isolates. Because 68.4% of the APEC isolates examined did not belong to the O2 or O78 serogroup and no other serogroup was prominent among APEC isolates, no discernible patterns could be identified with regard to serogroup and virulence potential.
TABLE 4.
Extended virulence genotyping of APEC (n = 794) and AFEC (n = 200) isolates
| Genea | No. of APEC and AFEC isolates carrying (+) or lacking (−) the gene
|
P value | |||
|---|---|---|---|---|---|
| APEC + | APEC − | AFEC + | AFEC − | ||
| iroN* | 677 | 117 | 42 | 158 | <0.0001 |
| Episomal ompT* | 624 | 170 | 42 | 158 | <0.0001 |
| hlyF* | 621 | 173 | 48 | 152 | <0.0001 |
| Episomal iss* | 639 | 155 | 60 | 140 | <0.0001 |
| cvaB5′ | 594 | 200 | 44 | 156 | <0.0001 |
| cvaA | 587 | 207 | 42 | 158 | <0.0001 |
| etsA | 561 | 233 | 43 | 157 | <0.0001 |
| iutA* | 641 | 153 | 71 | 129 | <0.0001 |
| etsB | 560 | 234 | 44 | 156 | <0.0001 |
| cvaC | 485 | 309 | 24 | 176 | <0.0001 |
| cvaB3′ | 485 | 309 | 33 | 167 | <0.0001 |
| papGI | 4 | 790 | 34 | 166 | <0.0001 |
| Chromosomal ompT | 497 | 297 | 47 | 153 | <0.0001 |
| ireA | 352 | 442 | 23 | 177 | <0.0001 |
| papEF | 270 | 524 | 16 | 184 | <0.0001 |
| papC | 289 | 505 | 21 | 179 | <0.0001 |
| papGII | 286 | 508 | 23 | 177 | <0.0001 |
| cbi | 278 | 516 | 23 | 177 | <0.0001 |
| vat | 262 | 532 | 22 | 178 | <0.0001 |
| papG23 | 256 | 538 | 21 | 179 | <0.0001 |
| fyuA | 413 | 381 | 60 | 140 | <0.0001 |
| cma | 217 | 577 | 19 | 181 | <0.0001 |
| eitB | 323 | 471 | 43 | 157 | <0.0001 |
| eitA | 323 | 471 | 43 | 157 | <0.0001 |
| papA | 79 | 715 | 2 | 198 | <0.0001 |
| gimB | 75 | 719 | 3 | 197 | 0.0002 |
| afa | 43 | 751 | 0 | 200 | 0.0008 |
| sfa/foc | 29 | 765 | 0 | 200 | 0.0061 |
| fliCH7 | 37 | 757 | 19 | 181 | 0.0080 |
| cnf1 | 11 | 783 | 8 | 192 | 0.0158 |
| sfaS | 20 | 774 | 1 | 199 | 0.0760 |
| kpsMT2 | 179 | 615 | 35 | 165 | 0.1209 |
| kpsMT3 | 9 | 785 | 0 | 200 | 0.1304 |
| papG1 | 7 | 787 | 0 | 200 | 0.1827 |
| malPAI | 125 | 669 | 24 | 176 | 0.1851 |
| hlyD | 5 | 789 | 0 | 200 | 0.2606 |
| bmaE | 4 | 790 | 0 | 200 | 0.3145 |
| papGIII | 3 | 791 | 0 | 200 | 0.3840 |
| rfc | 3 | 791 | 0 | 200 | 0.3840 |
| kpsMT1 | 125 | 669 | 27 | 173 | 0.4308 |
| gafD | 2 | 792 | 0 | 200 | 0.4774 |
| iha | 18 | 776 | 3 | 197 | 0.5002 |
| cdtB | 7 | 787 | 1 | 199 | 0.5893 |
| ibeA | 94 | 700 | 21 | 179 | 0.5968 |
| papG I′ | 0 | 794 | 0 | 200 | 1.0000 |
| focG | 0 | 794 | 0 | 200 | 1.0000 |
Asterisks indicate genes selected for a pentaplex typing scheme based upon this analysis, LCA, and the MCA plot (Fig. 2).
FIG. 2.

Left-most portion of this figure is the dendrogram resulting from the cluster analysis. There appears to be three main clusters of isolates. Cluster 1 (highlighted in red) contains most of the AFEC isolates. The majority of isolates in cluster 2 (highlighted in green) are APEC isolates, and cluster 3 (highlighted in blue) consists entirely of APEC isolates. Just to the right of the dendrogram is column 1, which identifies an isolate as APEC (green) or AFEC (pink). Columns 2 to 47 show the virulence genotype of each isolate tested. Each column in this group shows the results for a single gene or trait. The identity of each gene tested is shown in the horizontal bar at the top of the diagram, with those in blue being plasmid mediated and those in yellow being chromosomally located. Black indicates that a gene is present, and pale green indicates that a gene is absent. Column 48 shows the phylogenetic group of each isolate: blue, group A; orange, B1; brown, B2; and green, D. ompTp, episomal ompT; ompTc, chromosomal ompT; iss, episomal iss.
TABLE 5.
Most commonly occurring serogroups among APEC isolates (n = 794)
| Serogroup | Frequency | % Positive | Cumulative frequency | Cumulative % |
|---|---|---|---|---|
| NTa | 175 | 22.3 | 175 | 22.3 |
| 78 | 145 | 18.5 | 320 | 40.8 |
| 2 | 103 | 13.1 | 423 | 53.9 |
| Y | 29 | 3.7 | 452 | 57.6 |
| 1 | 19 | 2.4 | 471 | 60 |
| 8 | 16 | 2 | 487 | 62 |
| 35 | 15 | 1.9 | 502 | 64 |
| 111 | 14 | 1.8 | 516 | 65.7 |
| 18 | 12 | 1.5 | 528 | 67.3 |
| 36 | 12 | 1.5 | 540 | 68.8 |
| R | 10 | 1.3 | 550 | 70.1 |
| 11 | 9 | 1.2 | 559 | 71.2 |
| 20 | 9 | 1.2 | 568 | 72.4 |
| 19 | 8 | 1 | 576 | 73.4 |
| 9 | 8 | 1 | 584 | 74.4 |
| 25 | 7 | 0.9 | 591 | 75.3 |
NT, nontypeable.
An analysis of the distribution of virulence genes among APEC isolates of the four phylogenetic groups revealed that most of the genes were differentially distributed (Table 6). In fact, the only genes without significantly different distributions across phylogenetic groups (P < 0.05) were those that had very low prevalence among all populations, such as cdtB, rfc, papG1, papG3, bmaE, gafD, kpsMT3, and hlyD. Among the AFEC isolates examined, only nine genes displayed significant differences across phylogenetic types. These included plasmid-associated genes, such as episomal iss and genes of the ColV operon, and PAI-associated genes, such as fyuA, ibeA, and the mal PAI marker (Table 7).
TABLE 6.
Relationship between an APEC isolate's (n = 794) phylogenetic group and gene prevalence
| Gene (n = 44) | No. of isolates in a phylogenetic group carrying (+) or lacking (−) the gene
|
Probability | |||||||
|---|---|---|---|---|---|---|---|---|---|
| A + | A − | B1 + | B1 − | B2 + | B2 − | D + | D − | ||
| afa | 9 | 274 | 9 | 126 | 1 | 143 | 24 | 208 | <.0001 |
| cbi | 94 | 189 | 86 | 49 | 36 | 108 | 62 | 170 | <.0001 |
| cma | 73 | 210 | 60 | 75 | 27 | 117 | 57 | 175 | <.0001 |
| cvaB3 | 164 | 119 | 66 | 69 | 108 | 36 | 147 | 85 | <.0001 |
| cvaC | 151 | 132 | 74 | 61 | 106 | 38 | 154 | 78 | <.0001 |
| etsA | 171 | 112 | 101 | 34 | 111 | 33 | 178 | 54 | <.0001 |
| etsB | 167 | 116 | 101 | 34 | 114 | 30 | 178 | 54 | <.0001 |
| fliCH7 | 4 | 279 | 6 | 129 | 25 | 119 | 2 | 230 | <.0001 |
| fyuA | 130 | 153 | 30 | 105 | 113 | 31 | 140 | 92 | <.0001 |
| gimB | 2 | 281 | 3 | 132 | 65 | 79 | 5 | 227 | <.0001 |
| ibeA | 9 | 274 | 1 | 134 | 68 | 76 | 16 | 216 | <.0001 |
| ireA | 75 | 208 | 44 | 91 | 68 | 76 | 165 | 67 | <.0001 |
| Episomal iss | 206 | 77 | 107 | 28 | 130 | 14 | 196 | 36 | <.0001 |
| iutA | 203 | 80 | 107 | 28 | 127 | 17 | 204 | 28 | <.0001 |
| kpsMT1 | 13 | 270 | 6 | 129 | 91 | 53 | 15 | 217 | <.0001 |
| kpsMT2 | 22 | 261 | 14 | 121 | 108 | 36 | 35 | 197 | <.0001 |
| malX | 9 | 274 | 7 | 128 | 97 | 47 | 12 | 220 | <.0001 |
| Chromosomal ompT | 140 | 143 | 56 | 79 | 111 | 33 | 190 | 42 | <.0001 |
| papA | 14 | 269 | 26 | 109 | 28 | 116 | 11 | 221 | <.0001 |
| papC | 68 | 215 | 54 | 81 | 47 | 97 | 120 | 112 | <.0001 |
| papEF | 62 | 221 | 54 | 81 | 41 | 103 | 113 | 119 | <.0001 |
| papG23 | 61 | 222 | 39 | 96 | 43 | 101 | 113 | 119 | <.0001 |
| papGII | 69 | 214 | 49 | 86 | 55 | 89 | 113 | 119 | <.0001 |
| sfaS | 2 | 281 | 2 | 133 | 16 | 128 | 0 | 232 | <.0001 |
| sfafoc | 3 | 280 | 2 | 133 | 23 | 121 | 1 | 231 | <.0001 |
| vat | 12 | 271 | 8 | 127 | 107 | 37 | 135 | 97 | <.0001 |
| iroN | 221 | 62 | 116 | 19 | 129 | 15 | 212 | 20 | 0.0001 |
| cvaA | 190 | 93 | 98 | 37 | 123 | 21 | 176 | 56 | 0.0005 |
| cvaB5 | 192 | 91 | 99 | 36 | 123 | 21 | 180 | 52 | 0.0006 |
| Episomal ompT | 201 | 82 | 106 | 29 | 122 | 22 | 195 | 37 | 0.0008 |
| papG1 | 0 | 283 | 0 | 135 | 4 | 140 | 0 | 232 | 0.0019 |
| hlyF | 202 | 81 | 113 | 22 | 116 | 28 | 191 | 41 | 0.0058 |
| iha | 3 | 280 | 7 | 128 | 6 | 138 | 2 | 230 | 0.009 |
| cnf1 | 2 | 281 | 2 | 133 | 6 | 138 | 1 | 231 | 0.0228 |
| eitA | 104 | 179 | 67 | 68 | 66 | 78 | 86 | 146 | 0.0282 |
| eitB | 104 | 179 | 67 | 68 | 66 | 78 | 86 | 146 | 0.0282 |
| cdtB | 1 | 282 | 1 | 134 | 4 | 140 | 1 | 231 | 0.0829 |
| papGI | 2 | 281 | 0 | 135 | 0 | 144 | 5 | 227 | 0.1241 |
| rfc | 1 | 282 | 0 | 135 | 2 | 142 | 0 | 232 | 0.1876 |
| bmaE | 1 | 282 | 2 | 133 | 0 | 144 | 1 | 231 | 0.4303 |
| kpsMT3 | 4 | 279 | 1 | 134 | 3 | 141 | 1 | 231 | 0.4483 |
| papGIII | 1 | 282 | 1 | 134 | 1 | 143 | 0 | 232 | 0.5078 |
| gafD | 1 | 282 | 1 | 134 | 0 | 144 | 0 | 232 | 0.5353 |
| hlyD | 1 | 282 | 1 | 134 | 2 | 142 | 1 | 231 | 0.5906 |
TABLE 7.
Relationship between an AFEC isolate's (n = 200) phylogenetic group and gene prevalence
| Genea | No. of isolates in a phylogenetic group carrying (+) or lacking (−) the gene
|
Probabilityb | |||||||
|---|---|---|---|---|---|---|---|---|---|
| A + | A − | B1 + | B1 − | B2 + | B2 − | D + | D − | ||
| fyuA | 13 | 64 | 19 | 41 | 22 | 16 | 6 | 19 | 0.0001 |
| ibeA | 5 | 72 | 5 | 55 | 11 | 27 | 0 | 25 | 0.0012 |
| malPAI | 7 | 70 | 4 | 56 | 12 | 26 | 1 | 24 | 0.002 |
| Chromosomal ompT | 10 | 67 | 13 | 47 | 17 | 21 | 7 | 18 | 0.0026 |
| cvaC | 4 | 73 | 7 | 53 | 11 | 27 | 2 | 23 | 0.0048 |
| ireA | 11 | 66 | 1 | 59 | 5 | 33 | 6 | 19 | 0.0061 |
| iroN | 10 | 67 | 13 | 47 | 15 | 23 | 4 | 21 | 0.0148 |
| cvaB5 | 12 | 65 | 12 | 48 | 16 | 22 | 4 | 21 | 0.0159 |
| Episomal iss | 20 | 57 | 16 | 44 | 19 | 19 | 5 | 20 | 0.033 |
| Episomal ompT | 9 | 68 | 15 | 45 | 11 | 27 | 7 | 18 | 0.0592 |
| papG23 | 5 | 72 | 4 | 56 | 7 | 31 | 5 | 20 | 0.0649 |
| cvaA | 12 | 65 | 12 | 48 | 14 | 24 | 4 | 21 | 0.0733 |
| etsB | 11 | 66 | 14 | 46 | 13 | 25 | 6 | 19 | 0.1047 |
| kpsMT2 | 10 | 67 | 9 | 51 | 12 | 26 | 4 | 21 | 0.1078 |
| kpsMT1 | 8 | 69 | 6 | 54 | 10 | 28 | 3 | 22 | 0.1173 |
| gimB | 0 | 77 | 1 | 59 | 2 | 36 | 0 | 25 | 0.1197 |
| papG1 | 19 | 58 | 6 | 54 | 6 | 32 | 3 | 22 | 0.1354 |
| etsA | 12 | 65 | 13 | 47 | 13 | 25 | 5 | 20 | 0.1615 |
| papEF | 6 | 71 | 2 | 58 | 6 | 32 | 2 | 23 | 0.1804 |
| papC | 8 | 69 | 3 | 57 | 7 | 31 | 3 | 22 | 0.1996 |
| eitA | 14 | 63 | 12 | 48 | 13 | 25 | 4 | 21 | 0.2257 |
| eitB | 14 | 63 | 12 | 48 | 13 | 25 | 4 | 21 | 0.2257 |
| fliCH7 | 8 | 69 | 4 | 56 | 2 | 36 | 5 | 20 | 0.2281 |
| papGII | 6 | 71 | 7 | 53 | 7 | 31 | 3 | 22 | 0.3843 |
| iha | 2 | 75 | 0 | 60 | 0 | 38 | 1 | 24 | 0.4563 |
| hlyF | 16 | 61 | 13 | 47 | 11 | 27 | 8 | 17 | 0.5609 |
| cdtB | 0 | 77 | 1 | 59 | 0 | 38 | 0 | 25 | 0.615 |
| cma | 6 | 71 | 6 | 54 | 3 | 35 | 4 | 21 | 0.6291 |
| cbi | 7 | 70 | 9 | 51 | 5 | 33 | 2 | 23 | 0.6773 |
| cvaB3 | 11 | 66 | 11 | 49 | 8 | 30 | 3 | 22 | 0.7566 |
| papA | 2 | 75 | 0 | 60 | 0 | 38 | 0 | 25 | 0.7678 |
| cnf1 | 4 | 73 | 3 | 57 | 1 | 37 | 0 | 25 | 0.8742 |
| sfaS | 1 | 76 | 0 | 60 | 0 | 38 | 0 | 25 | 1 |
| iutA | 20 | 57 | 16 | 44 | 29 | 9 | 6 | 19 | <.0001 |
| vat | 0 | 77 | 1 | 59 | 16 | 22 | 5 | 20 | <.0001 |
The probability column represents the P value for Fisher's Exact test of the homogeneity of prevalence rates for each gene across the 4 phylogenetic groups. Note that there are only 35 genes in the table, even though testing has been done for 46 genes; no occurrences of kpsMT3, bmaE, sfa/foc, papGIII, hlyD, rfc, papG I′, gafD, focG, papG1, and afa were found among these isolates.
The probability column represents the P value for Fisher's Exact test of the homogeneity of prevalence rates for each gene across the four phylogenetic groups.
In an attempt to exploit these data to identify a minimum number of traits that could be used to distinguish an APEC from an AFEC isolate, further LCA was done (Table 8). This analysis identified a subset of genes, iutA, hlyF, episomal iss, iroN, and episomal ompT, which showed correspondence to APEC pathotypes and appeared to be capable of discriminating APEC from AFEC isolates to nearly the same degree as virulence genotyping for 46 genes. Using this subset of genes, a pentaplex PCR procedure targeting these genes was designed and validated using E. coli strains known to lack or possess these genes. In all cases, amplicons occurred as predicted, were of the size predicted (Table 2), and were confirmed as to their identities by DNA sequencing. Using this multiplex procedure, the 794 APEC and 200 AFEC isolates described above (Fig. 3) were analyzed, and the data generated were plotted in another cluster diagram. As seen previously in the cluster diagram using 46 genes, this cluster analysis showed a sharp demarcation between AFEC and APEC isolates, with the APEC isolates on average possessing 4.0 of the 5 genes and the AFEC averaging only 1.3 genes. These results suggest that screening for these genes is a useful tool in APEC diagnostics. Also, when the pentaplex results for the 200 AFEC and 124 APEC isolates assigned to pathotypes were plotted against one another (Fig. 4), the average number of genes possessed decreased from high (4.6) to medium (4.3) to low (3.9) for AFEC groups. However, despite strong differences in the distribution of these genes between APEC and AFEC, every gene studied could be found in both APEC and AFEC populations.
TABLE 8.
Genes useful in predicting APEC (n = 794) or AFEC (n = 200) membership
| Model | No. (%) correctly identified as APEC | No. (%) correctly identified as AFEC |
|---|---|---|
| All 46 genes | 685 (86.3) | 168 (84.0) |
| Stepwise (17-plex) | 686 (86.4) | 169 (84.5) |
| Best fivea | 678 (85.4) | 158 (79.0) |
The genes in the best five model were iutA, hlyF, episomal iss, iroN, and episomal ompT.
FIG. 3.
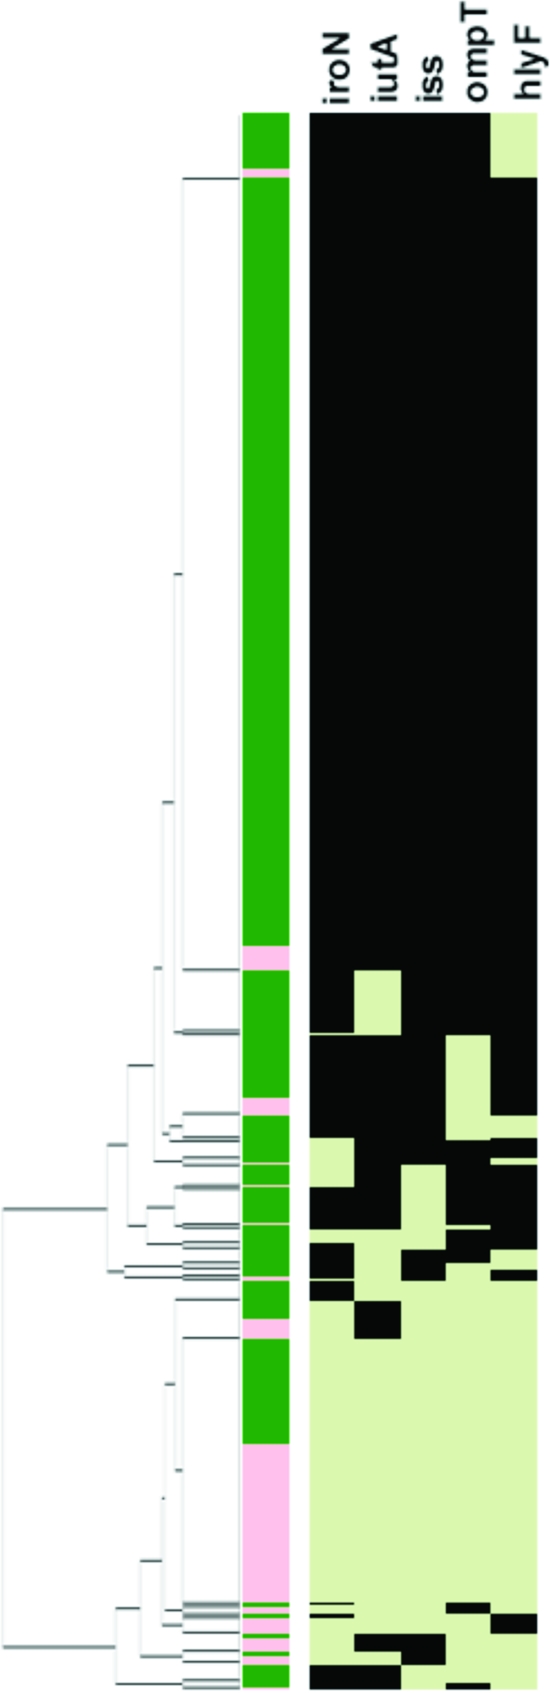
Results using the pentaplex panel for the 994 avian E. coli isolates. The left-most portion of this figure is the dendrogram resulting from the cluster analysis. Just to the right of the dendrogram is column 1, which identifies an isolate as APEC (green) or AFEC (pink). Columns 2 to 6 show the virulence genotype of each isolate tested for iroN, iutA, iss, ompTp, and hlyF. Each column in this group shows the results for a single gene. Black indicates that the gene is present, and light green indicates that the gene is absent.
FIG. 4.
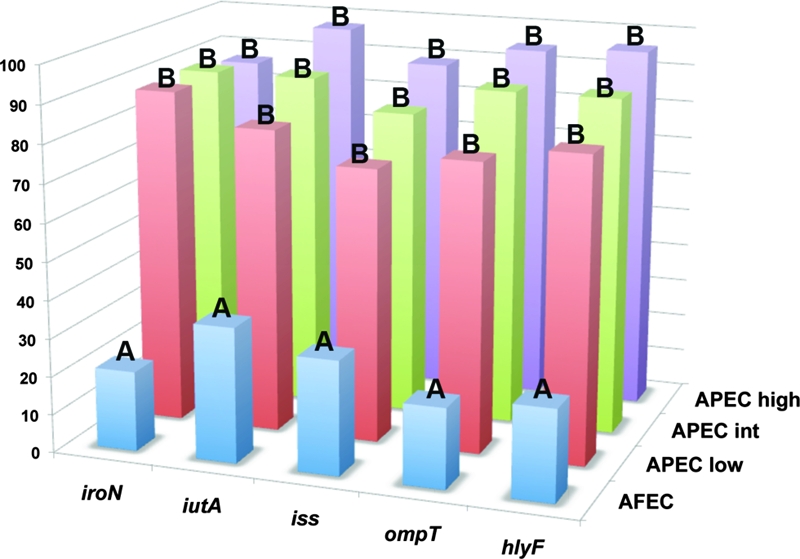
Histogram comparing the prevalence of the genes targeted in the pentaplex procedure among APEC isolates of known pathogenicity (APEC high, high pathogenicity [n = 73]; APEC int, intermediate pathogenicity [n = 26]; APEC low, low pathogenicity [n = 25]). Also shown is the gene prevalence among 200 AFEC isolates. Letters above bars indicate levels of statistical significance according to Fisher's exact test (P < 0.05 is considered statistically significant).
DISCUSSION
This study validates a refined multiplex PCR scheme to be used for the prediction of virulence of avian E. coli. This scheme is based on extensive virulence genotyping on a large number of isolates from a variety of sources; takes advantage of recent advances in plasmid genomics; and correlates the presence of five genes with the ability of an APEC isolate to cause disease in 1-day-old chicks. A cluster analysis of multiplex PCR results of nearly 1,000 isolates, screened for the presence of more than 40 ExPEC-associated traits, showed that the majority of APEC isolates fall into two distinct clusters: those with plasmid-associated virulence genes but lacking chromosome-associated virulence genes and those possessing both plasmid- and chromosome-associated virulence genes. Although some APEC isolates lacked the plasmid genes studied here, the vast majority of APEC isolates were distinguished from AFEC isolates by their possession of plasmid-linked PAI genes. In fact, the sharp demarcation between most APEC isolates and most AFEC isolates due to their plasmid gene content suggests that APEC isolates are well equipped for a pathogenic lifestyle, which is contrary to the widely held belief that they are opportunistic pathogens. Perhaps APEC isolates assigned to cluster 1, which are characterized by a dearth of the genes tested, are opportunistic pathogens, while those of clusters 2 and 3 are frank pathogens. Indeed, an APEC isolate in this study was defined as an E. coli strain isolated from the lesions of birds with colibacillosis with no regard to any host factors that might have predisposed the birds to infection, including infection with commensal strains of E. coli. Thus, we speculate that APEC isolates falling into cluster 1 actually are commensal E. coli strains taking advantage of an immunocompromised host. A further examination of the APEC isolate of this cluster in a range of immunocompetent and immunocompromised hosts would be helpful in resolving this issue. Regardless, it is evident from this study that a distinction can be made between the majority of APEC and AFEC isolates examined here by their possession of ColV virulence plasmids.
Besides confirming that virulence plasmids are a defining trait of the APEC pathotype, these results help explain the assignment of APEC isolates to phylogenetic types that are not typically associated with ExPEC isolates of human beings. While the majority of human ExPEC isolates belong to phylogenetic type B2 and, to a lesser degree, D, the majority of APEC isolates belong to the A, B1, and D phylogenetic types (5, 36). Phylogenetic grouping, which relies on identifying certain chromosomal markers, does not account for virulence due to plasmid-mediated PAIs and other extrachromosomal and mobile elements. Since such extrachromosomally located PAIs are a defining trait of the APEC pathotype and appear to be critical to APEC virulence (8, 9, 42, 43, 45), PCR-based phylogenetic typing is not a clear predictor of avian E. coli virulence. However, the literature provides evidence that no absolute definition of an APEC or a human ExPEC isolate is possible (4, 13, 18, 19, 29, 31, 33). Overlap among all ExPEC subtypes in terms of serogroups, phylogenetic types, and virulence genotypes exists to some degree (13, 33, 36). However, because most APEC isolates fall into phylogenetic groups other than the B2 group and possess ColV or ColBM virulence plasmid, one can conclude that these plasmids and/or some other genetic elements common to avian E. coli of the non-B2 types provide these strains with an enhanced ability to cause avian colibacillosis.
In summary, plasmid-linked PAIs are common among APEC isolates and provide a useful target for identifying these organisms. By exploiting this characteristic trait of APEC, we have developed and validated a pentaplex PCR panel that can distinguish most APEC isolates from AFEC isolates. Since APEC isolates remain an important concern for poultry producers and a potential one for public health professionals, such a diagnostic tool may be used to detect APEC-like strains occurring in poultry production, along the food chain, and in human disease, helping to clarify the role of APEC in human disease and identify targets for improved colibacillosis control.
Acknowledgments
We gratefully acknowledge Chitrita Debroy (Pennsylvania State University) and Catherine Logue (North Dakota State University) for providing strains used for this study.
This study was supported by Iowa State University's College of Veterinary Medicine.
Footnotes
Published ahead of print on 8 October 2008.
REFERENCES
- 1.Arp, L. H. 1982. Effect of passive immunization on phagocytosis of blood-borne Escherichia coli in spleen and liver of turkeys. Am. J. Vet. Res. 431034-1040. [PubMed] [Google Scholar]
- 2.Barnes, H. J., L. K. Nolan, and J. F. Vaillancourt. 2008. Colibacillosis, p. 691-732. In Y. M. Saif et al., Diseases of poultry, 12th ed. Blackwell Publishing, Arres, IA.
- 3.Bolin, C. A., and A. E. Jensen. 1987. Passive immunization with antibodies against iron-regulated outer membrane proteins protects turkeys from Escherichia coli septicemia. Infect. Immun. 551239-1242. [DOI] [PMC free article] [PubMed] [Google Scholar]
- 4.Brzuszkiewicz, E., H. Bruggemann, H. Liesegang, M. Emmerth, T. Olschlager, G. Nagy, K. Albermann, C. Wagner, C. Buchrieser, L. Emody, G. Gottschalk, J. Hacker, and U. Dobrindt. 2006. How to become a uropathogen: comparative genomic analysis of extraintestinal pathogenic Escherichia coli strains. Proc. Natl. Acad. Sci. USA 10312879-12884. [DOI] [PMC free article] [PubMed] [Google Scholar]
- 5.Clermont, O., S. Bonacorsi, and E. Bingen. 2000. Rapid and simple determination of the Escherichia coli phylogenetic group. Appl. Environ. Microbiol. 664555-4558. [DOI] [PMC free article] [PubMed] [Google Scholar]
- 6.Cloud, S. S., J. K. Rosenberger, P. A. Fries, R. A. Wilson, and E. M. Odor. 1985. In vitro and in vivo characterization of avian Escherichia coli. I. Serotypes, metabolic activity, and antibiotic sensitivity. Avian Dis. 291084-1093. [PubMed] [Google Scholar]
- 7.Deb, J. R., and E. G. Harry. 1978. Laboratory trials with inactivated vaccines against Escherichia coli (O2:K1) infection in fowls. Res. Vet. Sci. 24308-313. [PubMed] [Google Scholar]
- 8.Dozois, C. M., F. Daigle, and R. Curtiss III. 2003. Identification of pathogen-specific and conserved genes expressed in vivo by an avian pathogenic Escherichia coli strain. Proc. Natl. Acad. Sci. USA 100247-252. [DOI] [PMC free article] [PubMed] [Google Scholar]
- 9.Dozois, C. M., M. Dho-Moulin, A. Bree, J. M. Fairbrother, C. Desautels, and R. Curtiss III. 2000. Relationship between the Tsh autotransporter and pathogenicity of avian Escherichia coli and localization and analysis of the Tsh genetic region. Infect. Immun. 684145-4154. [DOI] [PMC free article] [PubMed] [Google Scholar]
- 10.Eisen, M. B., P. T. Spellman, P. O. Brown, and D. Botstein. 1998. Cluster analysis and display of genome-wide expression patterns. Proc. Natl. Acad. Sci. USA 9514863-14868. [DOI] [PMC free article] [PubMed] [Google Scholar]
- 11.Ewers, C., T. Janben, S. Kiebling, H. C. Philipp, and L. H. Wieler. 2005. Rapid detection of virulence-associated genes in avian pathogenic Escherichia coli by multiplex polymerase chain reaction. Avian Dis. 49269-273. [DOI] [PubMed] [Google Scholar]
- 12.Ewers, C., T. Janssen, S. Kiessling, H. C. Philipp, and L. H. Wieler. 2004. Molecular epidemiology of avian pathogenic Escherichia coli (APEC) isolated from colisepticemia in poultry. Vet. Microbiol. 10491-101. [DOI] [PubMed] [Google Scholar]
- 13.Ewers, C., G. Li, H. Wilking, S. Kiessling, K. Alt, E. M. Antao, C. Laturnus, I. Diehl, S. Glodde, T. Homeier, U. Bohnke, H. Steinruck, H. C. Philipp, and L. H. Wieler. 2007. Avian pathogenic, uropathogenic, and newborn meningitis-causing Escherichia coli: how closely related are they? Int. J. Med. Microbiol. 297163-176. [DOI] [PubMed] [Google Scholar]
- 14.Foley, S. L., S. M. Horne, C. W. Giddings, M. Robinson, and L. K. Nolan. 2000. Iss from a virulent avian Escherichia coli. Avian Dis. 44185-191. [PubMed] [Google Scholar]
- 15.Huberty, C. J. 1994. Applied discriminant analysis. Wiley, New York, NY.
- 16.Johnson, J. R., O. Clermont, M. Menard, M. A. Kuskowski, B. Picard, and E. Denamur. 2006. Experimental mouse lethality of Escherichia coli isolates, in relation to accessory traits, phylogenetic group, and ecological source. J. Infect. Dis. 1941141-1150. [DOI] [PubMed] [Google Scholar]
- 17.Johnson, J. R., M. A. Kuskowski, K. Smith, T. T. O'Bryan, and S. Tatini. 2005. Antimicrobial-resistant and extraintestinal pathogenic Escherichia coli in retail foods. J. Infect. Dis. 1911040-1049. [DOI] [PubMed] [Google Scholar]
- 18.Johnson, J. R., and T. A. Russo. 2002. Extraintestinal pathogenic Escherichia coli: the other bad E. coli. J. Lab. Clin. Med. 139155-162. [DOI] [PubMed] [Google Scholar]
- 19.Johnson, J. R., and T. A. Russo. 2005. Molecular epidemiology of extraintestinal pathogenic (uropathogenic) Escherichia coli. Int. J. Med. Microbiol. 295383-404. [DOI] [PubMed] [Google Scholar]
- 20.Johnson, J. R., and A. L. Stell. 2000. Extended virulence genotypes of Escherichia coli strains from patients with urosepsis in relation to phylogeny and host compromise. J. Infect. Dis. 181261-272. [DOI] [PubMed] [Google Scholar]
- 21.Johnson, T. J., S. J. Johnson, and L. K. Nolan. 2006. Complete DNA sequence of a ColBM plasmid from avian pathogenic Escherichia coli suggests that it evolved from closely related ColV virulence plasmids. J. Bacteriol. 1885975-5983. [DOI] [PMC free article] [PubMed] [Google Scholar]
- 22.Johnson, T. J., K. E. Siek, S. J. Johnson, and L. K. Nolan. 2006. DNA sequence of a ColV plasmid and prevalence of selected plasmid-encoded virulence genes among avian Escherichia coli strains. J. Bacteriol. 188745-758. [DOI] [PMC free article] [PubMed] [Google Scholar]
- 23.Johnson, T. J., J. Skyberg, and L. K. Nolan. 2004. Multiple antimicrobial resistance region of a putative virulence plasmid from an Escherichia coli isolate incriminated in avian colibacillosis. Avian Dis. 48351-360. [DOI] [PubMed] [Google Scholar]
- 24.Johnson, T. J., Y. M. Wannemuehler, and L. K. Nolan. 2008. Evolution of the iss gene in Escherichia coli. Appl. Environ. Microbiol. 742360-2369. [DOI] [PMC free article] [PubMed] [Google Scholar]
- 25.Kariyawasam, S., B. N. Wilkie, and C. L. Gyles. 2004. Construction, characterization, and evaluation of the vaccine potential of three genetically defined mutants of avian pathogenic Escherichia coli. Avian Dis. 48287-299. [DOI] [PubMed] [Google Scholar]
- 26.Kwaga, J. K., B. J. Allan, J. V. van der Hurk, H. Seida, and A. A. Potter. 1994. A carAB mutant of avian pathogenic Escherichia coli serogroup O2 is attenuated and effective as a live oral vaccine against colibacillosis in turkeys. Infect. Immun. 623766-3772. [DOI] [PMC free article] [PubMed] [Google Scholar]
- 27.La Ragione, R. M., and M. J. Woodward. 2002. Virulence factors of Escherichia coli serotypes associated with avian colisepticaemia. Res. Vet. Sci. 7327-35. [DOI] [PubMed] [Google Scholar]
- 28.Lynne, A. M., S. L. Foley, and L. K. Nolan. 2006. Immune response to recombinant Escherichia coli Iss protein in poultry. Avian Dis. 50273-276. [DOI] [PubMed] [Google Scholar]
- 29.Maynard, C., S. Bekal, F. Sanschagrin, R. C. Levesque, R. Brousseau, L. Masson, S. Lariviere, and J. Harel. 2004. Heterogeneity among virulence and antimicrobial resistance gene profiles of extraintestinal Escherichia coli isolates of animal and human origin. J. Clin. Microbiol. 425444-5452. [DOI] [PMC free article] [PubMed] [Google Scholar]
- 30.McLachlan, G. J. 1992. Discriminant analysis and statistical pattern recognition. Wiley, New York, NY.
- 31.Mokady, D., U. Gophna, and E. Z. Ron. 2005. Extensive gene diversity in septicemic Escherichia coli strains. J. Clin. Microbiol. 4366-73. [DOI] [PMC free article] [PubMed] [Google Scholar]
- 32.Morales, C., M. D. Lee, C. Hofacre, and J. J. Maurer. 2004. Detection of a novel virulence gene and a Salmonella virulence homologue among Escherichia coli isolated from broiler chickens. Foodborne Pathog. Dis. 1160-165. [DOI] [PubMed] [Google Scholar]
- 33.Moulin-Schouleur, M., M. Reperant, S. Laurent, A. Bree, S. Mignon-Grasteau, P. Germon, D. Rasschaert, and C. Schouler. 2007. Extraintestinal pathogenic Escherichia coli strains of avian and human origin: link between phylogenetic relationships and common virulence patterns. J. Clin. Microbiol. 453366-3376. [DOI] [PMC free article] [PubMed] [Google Scholar]
- 34.Peighambari, S. M., D. B. Hunter, P. E. Shewen, and C. L. Gyles. 2002. Safety, immunogenicity, and efficacy of two Escherichia coli cya crp mutants as vaccines for broilers. Avian Dis. 46287-297. [DOI] [PubMed] [Google Scholar]
- 35.Pfaff-McDonough, S. J., S. M. Horne, C. W. Giddings, J. O. Ebert, C. Doetkott, M. H. Smith, and L. K. Nolan. 2000. Complement resistance-related traits among Escherichia coli isolates from apparently healthy birds and birds with colibacillosis. Avian Dis. 4423-33. [PubMed] [Google Scholar]
- 36.Rodriguez-Siek, K. E., C. W. Giddings, C. Doetkott, T. J. Johnson, M. K. Fakhr, and L. K. Nolan. 2005. Comparison of Escherichia coli isolates implicated in human urinary tract infection and avian colibacillosis. Microbiology 1512097-2110. [DOI] [PubMed] [Google Scholar]
- 37.Rodriguez-Siek, K. E., C. W. Giddings, C. Doetkott, T. J. Johnson, and L. K. Nolan. 2005. Characterizing the APEC pathotype. Vet. Res. 36241-256. [DOI] [PubMed] [Google Scholar]
- 38.Roland, K., K. Karaca, and D. Sizemore. 2004. Expression of Escherichia coli antigens in Salmonella typhimurium as a vaccine to prevent airsacculitis in chickens. Avian Dis. 48595-605. [DOI] [PubMed] [Google Scholar]
- 39.Rosenberger, J. K., P. A. Fries, and S. S. Cloud. 1985. In vitro and in vivo characterization of avian Escherichia coli. III. Immunization. Avian Dis. 291108-1117. [PubMed] [Google Scholar]
- 40.Rosenberger, J. K., P. A. Fries, S. S. Cloud, and R. A. Wilson. 1985. In vitro and in vivo characterization of avian Escherichia coli. II. Factors associated with pathogenicity. Avian Dis. 291094-1107. [PubMed] [Google Scholar]
- 41.Skyberg, J. A., S. M. Horne, C. W. Giddings, R. E. Wooley, P. S. Gibbs, and L. K. Nolan. 2003. Characterizing avian Escherichia coli isolates with multiplex polymerase chain reaction. Avian Dis. 471441-1447. [DOI] [PubMed] [Google Scholar]
- 42.Skyberg, J. A., T. J. Johnson, J. R. Johnson, C. Clabots, C. M. Logue, and L. K. Nolan. 2006. Acquisition of avian pathogenic Escherichia coli plasmids by a commensal E. coli isolate enhances its abilities to kill chicken embryos, grow in human urine, and colonize the murine kidney. Infect. Immun. 746287-6292. [DOI] [PMC free article] [PubMed] [Google Scholar]
- 43.Skyberg, J. A., T. J. Johnson, and L. K. Nolan. 2008. Mutational and transcriptional analyses of an avian pathogenic Escherichia coli ColV plasmid. BMC Microbiol. 824. [DOI] [PMC free article] [PubMed] [Google Scholar]
- 44.Snedecor, G. W., and W. G. Cochran. 1989. Statistical methods. Iowa State University Press, Ames, IA.
- 45.Tivendale, K. A., J. L. Allen, C. A. Ginns, B. S. Crabb, and G. F. Browning. 2004. Association of iss and iucA, but not tsh, with plasmid-mediated virulence of avian pathogenic Escherichia coli. Infect. Immun. 726554-6560. [DOI] [PMC free article] [PubMed] [Google Scholar]
- 46.Vandekerchove, D., F. Vandemaele, C. Adriaensen, M. Zaleska, J. P. Hernalsteens, L. D. Baets, P. Butaye, F. V. Immerseel, P. Wattiau, H. Laevens, J. Mast, B. Goddeeris, and F. Pasmans. 2005. Virulence-associated traits in avian Escherichia coli: comparison between isolates from colibacillosis-affected and clinically healthy layer flocks. Vet. Microbiol. 10875-87. [DOI] [PubMed] [Google Scholar]
- 47.Yang, H., S. Chen, D. G. White, S. Zhao, P. McDermott, R. Walker, and J. Meng. 2004. Characterization of multiple-antimicrobial-resistant Escherichia coli isolates from diseased chickens and swine in China. J. Clin. Microbiol. 423483-3489. [DOI] [PMC free article] [PubMed] [Google Scholar]
- 48.Zhao, S., J. J. Maurer, S. Hubert, J. F. De Villena, P. F. McDermott, J. Meng, S. Ayers, L. English, and D. G. White. 2005. Antimicrobial susceptibility and molecular characterization of avian pathogenic Escherichia coli isolates. Vet. Microbiol. 107215-224. [DOI] [PubMed] [Google Scholar]