

Abstract
Erythroid Krüppel-like factor (EKLF) is a Krüppel-like transcription factor identified as a transcriptional activator and chromatin modifier in erythroid cells. EKLF-deficient (Eklf−/−) mice die at day 14.5 of gestation from severe anemia. In this study, we demonstrate that early progenitor cells fail to undergo terminal erythroid differentiation in Eklf−/− embryos. To discover potential EKLF target genes responsible for the failure of erythropoiesis, transcriptional profiling was performed with RNA from wild-type and Eklf−/− early erythroid progenitor cells. These analyses identified significant perturbation of a network of genes involved in cell cycle regulation, with the critical regulator of the cell cycle, E2f2, at a hub. E2f2 mRNA and protein levels were markedly decreased in Eklf−/− early erythroid progenitor cells, which showed a delay in the G1-to-S-phase transition. Chromatin immunoprecipitation analysis demonstrated EKLF occupancy at the proximal E2f2 promoter in vivo. Consistent with the role of EKLF as a chromatin modifier, EKLF binding sites in the E2f2 promoter were located in a region of EKLF-dependent DNase I sensitivity in early erythroid progenitor cells. We propose a model in which EKLF-dependent activation and modification of the E2f2 locus is required for cell cycle progression preceding terminal erythroid differentiation.
Erythroid Krüppel-like factor (EKLF; KLF1) is the founding, erythroid-specific member of the mammalian Krüppel-like family of zinc-finger transcription factors (6, 7, 24). The functions of EKLF during erythropoiesis (the differentiation of red blood cells) include the activation of the β-globin gene during development (10, 13, 19, 27, 33, 37, 38); chromatin remodeling, including the formation of DNase I hypersensitive sites (4, 8, 9, 25, 28, 38, 41, 42); and the establishment of an active chromatin hub (15). In Eklf knockout mice (Eklf−/−), definitive fetal liver erythropoiesis is disrupted, leading to lethality by embryonic day 14.5 (E14.5) to E15 (32, 34). The rare circulating definitive Eklf−/− erythrocytes exhibit membrane defects and retain nuclei (31, 32, 34). In Eklf−/− erythroid cells, the chromatin domains of the proximal β-globin promoter and distal locus control region do not form the active chromatin hub seen in wild-type erythroid cells (15, 18, 38), resulting in significant decreases in β-globin mRNA and protein production.
Studies of global gene expression using RNA extracted from whole E13.5 wild-type and Eklf−/− fetal liver cells (16, 20, 31, 35) demonstrated that expression of the membrane structural protein mRNAs ankyrin, β-spectrin, dematin, and band 3 are significantly downregulated in EKLF-deficient fetal liver, as is the globin chaperone, alpha-hemoglobin stabilizing protein. The pleiotropic defects observed in Eklf−/− embryos led us to hypothesize that the defect in Eklf−/− embryos was the result of a primary failure of definitive erythropoiesis, as opposed to individual defects in the mature erythrocytes themselves. In this report, we demonstrate that E13.5 Eklf−/− erythroid progenitor cells fail to undergo terminal differentiation due to a failure of cell cycle progression. To identify potential EKLF target genes responsible for the block in erythropoiesis, we performed transcriptional profiling with RNA extracted from homogeneous populations of wild-type and Eklf−/− fetal liver early erythroid progenitor cells. Our analysis revealed significant dysregulation of >3,000 genes. Ingenuity Pathways Analysis (IPA; Ingenuity Systems, Mountain View, CA) of the transcriptional profiles identified significant perturbation of a cell cycle and DNA replication pathway and identified the transcription factor, E2F2, which regulates the G1-to-S-phase transition, as the most significantly affected gene in the pathway. We confirmed that Eklf−/− early erythroid progenitor cells were perturbed at the G1-to-S-phase transition. Chromatin immunoprecipitation (ChIP) analysis demonstrated EKLF occupancy at the proximal E2f2 promoter in vivo. EKLF was required to confer DNase I sensitivity across the E2f2 locus. These results demonstrate that E2f2 is a direct target of EKLF and that EKLF deficiency leads to cell cycle perturbation and defective terminal erythroid differentiation.
MATERIALS AND METHODS
EKLF-deficient mice.
Eklf−/− mice were previously generated via gene targeting by Perkins et al. (34). Genotyping of Eklf−/− and wild-type fetal livers was performed as described previously using a 3′-flanking DNA Eklf probe. In HindIII-digested genomic DNA, this probe identifies wild-type (4.2-kb) and Eklf-knockout (10-kb) alleles. Eklf−/− E13.5 embryos were easily detectable by pallor.
Flow cytometric analyses.
Fetal livers from E13.5 wild-type and Eklf−/− embryos were dissociated to a single cell suspension and stained with 7-amino-actinomycin D and anti-CD71 and Ter119 antibodies (BD Pharmingen, San Jose, CA). Cell populations were isolated by using a FACSAria flow cytometer running FACSDiva software (BD Biosciences, San Jose, CA). Cell cycle analysis was performed by using propidium iodide staining solution (BD Pharmingen) on a FACSCalibur flow cytometer (BD Biosciences) running FlowJo software (TreeStar, Inc., Ashland, OR). Each experiment was performed a minimum of four times, and the data were analyzed by using a Student t test.
Colony-forming assays.
Sorted R1-R5 cells from E13.5 wild-type fetal livers and R1 and R2 cells from E13.5 Eklf−/− fetal livers were suspended at 106 or 104 cells/ml and plated in duplicate in either 1.5 ml of Methocult M3334 (CFU-E) or 1.5 ml of Methocult GF M3434 (BFU-E and CFU-GM; Stem Cell Technologies, Vancouver, British Columbia, Canada). CFU-E colonies containing 12 to 20 cells were counted 2 to 3 days postplating (wild type) or 3 to 5 days postplating (Eklf−/−). BFU-E colonies containing 10,000 to 20,000 cells were counted 10 to 12 days postplating (wild type) and 13 to 15 days postplating (Eklf−/−). CFU-GM colonies were counted from the same plates 10 to 12 days postplating for both the wild-type and Eklf−/− cell populations. Each experiment was performed a minimum of four times, and the data were analyzed by using a Student t test.
Microarray analyses.
RNA was prepared from R1 and R2 cells sorted from E13.5 wild-type and Eklf−/− fetal liver cells using TRIzol reagent (Invitrogen, Carlsbad, CA) according to the manufacturer's instructions. RNA quality was verified with an Agilent 2100 bioanalyzer (Agilent Technologies, Santa Clara, CA). GeneChip (Affymetrix, Santa Clara, CA) target probes from three independent Eklf−/− and three wild-type RNA samples were prepared according to Affymetrix instructions starting with 10 μg of RNA. Double-stranded cDNA was synthesized by using a T7-linked oligo(dT) primer, followed by second-strand synthesis. Biotin-labeled cRNA, produced by in vitro transcription, was synthesized and subsequently fragmented. The fragmented cRNA was hybridized to Affymetrix GeneChip Mouse Genome 430 2.0 arrays at 45°C for 16 h, followed by washing and staining with streptavidin-phycoerythrin (Molecular Probes, Carlsbad, CA). Signal amplification was performed with a biotinylated anti-streptavidin antibody (Vector Laboratories, Burlingame, CA). Arrays were scanned with an Affymetrix GeneChip Scanner, and hybridization patterns were detected as light emitted from the fluorescent reporter groups incorporated into the target and hybridized to oligonucleotide probes. Signal intensity measurements computed in the Affymetrix Microarray Analysis Suite 5.0 served as a relative indicator of the level of expression. Scaling factors were also computed for each array based on an arbitrary target intensity of 500. All raw data files (CEL) are available (http://data.genome.duke.edu/EKLFDef) and have been submitted to the GEO database. These experiments comply with MIAME (Minimum Information About a Microarray Experiment) standards.
Genespring 6.1 (Agilent) was used to perform initial data analysis. Affymetrix MAS 5.0 signal intensities were normalized per chip and per gene by taking each measurement divided by the 50th percentile of all measurements in that sample, and each gene was divided by the median of its measurements in all samples. Based on the data from three independent analyses of each condition and a threshold of twofold change in expression relative to the control, a two-way analysis of variance with a P value cutoff of 0.05 (applying a Bonferroni correction) was performed. The expression of each gene was reported as the ratio of the value obtained for each condition relative to control conditions after data normalization. Affymetrix probe identifications were imported into the IPA software and categorized based on location; cellular components; and the reported or suggested biochemical, biologic, and molecular functions. Genes were also mapped to networks in the Ingenuity database and ranked by score. The score is the probability that a collection of genes equal to or greater than the number in a network could be achieved by chance alone.
Expression analyses.
Quantitative real-time PCR was performed to confirm the levels of mRNA observed in the transcriptional profiling using sequence-specific oligonucleotide primers (see Table S1 in the supplemental material) designed to amplify ∼150-bp fragments, each spanning an intron. PCRs were performed with Sybr green in an iCycler (Bio-Rad, Hercules, CA) to measure the fluorescence intensity. The values obtained for target gene expression were normalized to beta-actin and were expressed relative to the expression in control samples. For the threshold cycle (CT) calculations, the 2−ΔΔCT formula was used: ΔΔCT = [CT(target) − CT(actin)]experimental sample - [CT(target) − CT(actin)]control sample.
Western blot analysis was performed with wild-type and Eklf−/− E13.5 total fetal liver proteins as described previously (35). Blots were probed with a rat anti-mouse E2F2 polyclonal antibody (sc-633) and a goat anti-human actin polyclonal antibody (sc-1616), both from Santa Cruz Biotechnology (Santa Cruz, CA). Western blots were exposed to an imaging plate, scanned using a Storm 860 scanner, and quantified by using scanning densitometry with ImageQuant software (both from Molecular Dynamics, Inc., Sunnyvale, CA).
ChIP analysis.
We performed ChIP on chromatin obtained from sorted R1+R2 fetal liver cells from E13.5 HA-EKLF-TAP-tagged mice (43). Cross-linked cells were processed by using the Magna ChIP A assay kit (catalog no. 17-610; Millipore, Billerica, MA) according to the manufacturer's instructions. Chromatin was immunoprecipitated with a mouse monoclonal anti-HA probe (F-7, sc-7329X; Santa Cruz). Nonimmune control samples were incubated with protein A beads but without antibody. The PCR primers are listed in Table S2 in the supplemental material. We performed the analyses on five independent chromatin preparations from sorted cells. Each sample was analyzed in triplicate.
DNase I sensitivity assay.
A DNase I sensitivity assay of the E2f2 locus was performed by using the PCR-based method described by Bernat et al. (5) and Dorschner et al. (14). Chromatin was prepared from ∼107 nuclei from sorted R1+R2 fetal liver cells obtained from E13.5 wild-type or Eklf−/− embryos as previously described (39). Nuclei were exposed to increasing amounts of DNase I (0.0 to 4.0 g/ml; Worthington Biochemical Corp., Lakewood, NJ) and incubated at 37°C for 10 min before DNA extraction. Southern blot analysis with a probe for a relatively DNase I resistant region of the keratin locus was performed to identify samples with equivalent levels of DNase I digestion. DNA from untreated, “low DNase” (the first sample with evidence of DNase I activity) and “high DNase” (the first sample with an absence of high-molecular-weight DNA) was analyzed by quantitative real-time PCR using a set of 287 primer pairs (average amplicon size of 280 bp, average gap of 150 bp) covering the E2f2 locus and 50 kb of sequence up- and downstream of the gene. The DNA was amplified on a 384-well format ABI Prism 7900 Fast Real-Time PCR instrument (Applied Biosystems, Foster City, CA). The difference in CT between DNase-treated and untreated template for each primer pair was calculated as ΔCT = CT(treated) − CT(zero), which serves as a measure of the relative DNase sensitivity of the amplified region. Three or four independent chromatin preparations were analyzed for each primer pair in triplicate. The strict statistical criteria described by Bernat et al. (5) and Dorschner et al. (14) were used to compare the DNase I sensitivity of regions. The mean CT and standard deviation for each point in the wild-type and Eklf−/− samples were calculated and analyzed by a Student t test. A DNase I-sensitive region is defined as a region with significantly more digestion (P < 0.01).
RESULTS
The Eklf−/− fetal liver does not contain terminally differentiating erythroid cells.
At E13.5, definitive erythropoiesis is confined to the fetal liver. Discrete populations of cells, enriched for particular stages of erythropoiesis, can be separated by flow cytometry using the cell surface markers CD71 and Ter119 (22, 40). In agreement with previous findings (22), ca. 80% of wild-type cells reside in the R3-R5 populations, with the remaining 20% in the R1-R2 populations. In contrast, 100% of the cells in E13.5 Eklf−/− fetal liver appeared in the R1-R2 populations (Fig. 1A). These observations are in agreement with the original descriptions of unfractionated Eklf−/− fetal liver cells (see Fig. S1 in the supplemental material). To confirm that the Eklf−/− R1 and R2 populations did not contain morphologically mature cells that did not express the Ter119 antigen, we compared the morphology of sorted, Wright-Giemsa-stained cells from each population (Fig. 1B). In E13.5 wild-type fetal liver cells, five populations with distinct morphologies were identified: R1 (CD71LO Ter119NEG, early erythroid progenitor), R2 (CD71HI Ter119LO, erythroid progenitor), R3 (CD71HI Ter119HI, proerythroblast, basophilic erythroblast), R4 (CD71MID Ter119HI, polychromatic erythroblast, orthochromatic erythroblast), and R5 (CD71LO Ter119HI, reticulocyte) (Fig. 1A and B). The R1 and R2 populations of E13.5 Eklf−/− fetal liver cells were homogeneous populations of erythroid progenitor cells with <3% proerythroblasts, basophilic erythroblasts, polychromatic or orthochromatic erythroblasts, or reticulocytes. We conclude that mature (R3 to R5) cells that lack Ter119 expression are not present in the Eklf−/− fetal liver.
FIG. 1.

(A) Fluorescence-activated cell sorting analysis of E13.5 fetal liver cells from wild-type and Eklf−/− embryos. The cells were stained with anti-CD71 (transferrin receptor; y axis) and TER119 (x axis) antibodies. The sorting windows for the R1-R5 populations are indicated by the labeled ovals. (B) Morphology of representative Wright-Giemsa-stained cells in the sorted R1-R5 populations. Wild-type R1 was composed of 98% large blast cells and 2% other cells, wild-type R2 was composed of 99% smaller blast cells and 1% other cells, wild-type R3 was composed of 99% smaller hemoglobin-staining cells with compacted nuclei and 1% other cells, wild-type R4 was composed of 99% cells with dark hemoglobin staining and decentralized nuclei and 1% other cells, and wild-type R5 was composed of 99% reticulocytes and 1% other cells. Eklf−/− R1 was composed of 97.5% large blast cells and 2.5% other cells, while Eklf−/− R2 was composed of 97% smaller blast cells and 3% other cells. WT, wild type.
Eklf−/− fetal liver cells contain increased numbers of erythroid colony forming cells.
The original descriptions of Eklf−/− mice showed that the frequencies of erythroid colony forming cells in unfractionated wild-type and Eklf−/− fetal livers were similar. To determine whether the lack of terminally differentiating erythroid cells in the Eklf−/− fetal liver was due to a deficiency of erythroid colony-forming cells, we compared the frequency and total number of BFU-E and CFU-E in sorted populations of E13.5 wild-type and Eklf−/− fetal liver cells. Wild-type E13.5 fetal livers had significantly more cells than E13.5 Eklf−/− fetal livers (wild type = 2.14 × 10⁷ ± 0.403 × 10⁷ cells per liver; Eklf−/− = 1.38 × 10⁷ ± 0.325 × 10⁷ cells per liver; P = 0.022). BFU-E were concentrated in the R1 population of both wild-type and Eklf−/− fetal liver cells. Consistent with the original observations, the frequency of BFU-E was similar in both wild-type and Eklf−/− R1 fetal liver cells, but we observed a significant increase in the total number of BFU-E in Eklf−/− fetal liver (P < 0.02) that correlated with the relative increase in the number of Eklf−/− R1 fetal liver cells (Fig. 2A). CFU-E were concentrated in R2 and were present at both increased frequency (P < 0.02) and total number (P < 0.01) in Eklf−/− fetal livers (Fig. 2B). The increased total number of CFU-E in Eklf−/− fetal liver cells correlated with the relative increase in the number of R2 cells, while the increased frequency indicates an accumulation of CFU-E in Eklf−/− R2 fetal liver cells. BFU-E and CFU-E from E13.5 wild-type and Eklf−/− fetal liver produced colonies of definitive erythroid cells, as evidenced by the presence of only adult β-globin chains on Triton-acid-urea gels (2, 3) (data not shown). However, Eklf−/− BFU-E and CFU-E contained less hemoglobin and required 24 to 48 h longer to reach the same size as wild-type BFU-E and CFU-E, which may have reduced the number of colonies counted in the original descriptions. In agreement with previous observations, the R3-R5 populations did not contain any colony-forming cells (22, 40). We interpret these results to indicate that erythropoiesis is blocked between the R2 and R3 stages in E13.5 Eklf−/− embryos.
FIG. 2.

Analysis of erythroid colony forming cells in E13.5 fetal liver cells from wild-type and Eklf−/− embryos. Fetal liver cells were sorted using the windows depicted in Fig. 1. The R1 and R2 populations were isolated and suspended in semisolid medium. The black bars represent the average number of colonies from wild-type cells (with the standard deviation), and the open bars represent the average number of colonies from Eklf−/− cells (with the standard deviation). (A) Frequency and total number of BFU-E colonies. BFU-E colonies were counted on days 10 to 12 (wild type) and days 13 to 15 (Eklf−/−) of culture. (B) Frequency and total number of CFU-E colonies. CFU-E colonies were counted on day 2 to 3 (WT) and day 3 to 5 (Eklf−/−) of culture. The P values for the significant differences between wild type and Eklf−/− are shown. NS, not significant. There was no significant difference in the frequency or absolute number of CFU-GM in wild-type and Eklf−/− fetal liver cells. The total numbers of colonies were calculated as follows: (number of colonies/10,000 R1 or R2 cells) × (number of R1 or R2 cells/total fetal liver cells) × the total number fetal liver cells. WT, wild type.
Transcriptional profiling of wild-type and EKLF-deficient fetal liver cells.
Previous comparisons of EKLF-dependent gene expression have utilized mRNA derived from whole fetal livers from wild-type and Eklf−/− embryos (16, 20, 31, 35), which differ significantly in their cellular composition (see above). To gain insight into the mechanism of the arrest of erythropoiesis in Eklf−/− mice, we performed microarray analyses with RNA extracted from cells with identical phenotypes and colony-forming abilities (i.e., sorted E13.5 wild-type and Eklf−/− R1+R2 fetal liver cells). Analysis of Affymetrix GeneChip Mouse Genome 430 2.0 arrays demonstrated that more than 3,000 genes showed significantly dysregulated expression (P < 0.05); 2,534 were downregulated and 665 were upregulated in Eklf−/− fetal liver cells. More than 1,300 genes showed dysregulation at the P < 0.01 level of significance (for the complete data set, see http://data.cgt.duke.edu/EKLF.php). Quantitative reverse transcription-PCR (RT-PCR) analysis of RNA extracted from sorted wild-type R1+R2 and Eklf−/− fetal liver cells using PCR primers spanning introns verified the change in gene expression for 20 of 20 transcripts analyzed.
For an unbiased analysis of our transcript profile, we performed IPA on the more inclusive set of 3,199 genes showing dysregulated expression at the P < 0.05 level. The Affymetrix probe lists were overlaid on a cellular pathway map based on location; cellular components; and reported or suggested biochemical, biologic, and molecular functions in the Ingenuity Systems (Redwood City, CA) Pathways Knowledge Base (winter 2004 release containing 20,000 genes). The genes with significantly altered expression were mapped to genetic networks and then ranked by score. The score is the probability that the collection of probe genes equal to or greater than the number represented in a network could be achieved by chance alone. A score of ≥3 indicates a 1/1,000 chance that the focus genes are in a network due to random chance. The pathway with the highest IPA score was cell cycle and DNA replication, which generated a network involving 35 focus genes with significantly dysregulated expression (score = 27; Fig. 3). At a node of this network was E2F2, a transcription factor and a critical regulator of cell proliferation by its control of genes regulating S-phase entry and DNA synthesis (1, 30), whose expression was significantly decreased in Eklf−/− R1+R2 fetal liver cells (P < 0.037). In four paired, independent RNA samples, RT-PCR analysis verified that the level of E2f2 mRNA in Eklf−/− R1+R2 cells was decreased to 4.8% ± 3.5% of the level seen in wild-type R1+R2 cells (P < 0.001) (Fig. 4A). Consistent with the mRNA levels, Western blot analysis demonstrated that E2F2 protein was undetectable in Eklf−/− R1+R2 fetal liver cells (Fig. 4B; the band immediately beneath the E2F2 band is a nonspecific band recognized by the SC-633 antibody as described in the original reference) (29). PhosphorImager analysis of these data confirmed a fivefold reduction in E2F2 in Eklf−/− R1+R2 fetal liver cells (Fig. 4C). An independent analysis of the microarray data using GeneSifter software (VizX Labs, Seattle, WA) identified the same pathway and target gene.
FIG. 3.

Network of differentially expressed genes in the cell cycle control pathway in sorted R1/R2 Eklf−/− E13.5 fetal liver cells. IPA was performed on microarray data comparing R1 and R2 mRNA isolated from wild-type and Eklf−/− E13.5 fetal liver cells. Using 3,199 differentially expressed genes as the focus gene set, the highest-scoring pathway was cell cycle and DNA replication (score = 27; scores >3 indicate a significant chance that a biologically relevant network has been identified). Red nodes indicate upregulation in Eklf−/− cells; green nodes indicate downregulation in Eklf−/− cells. Arrows and lines denote interactions between specific genes within the network. A, activation; E, expression regulation; P, phosphorylation; PP, protein-protein interaction; PD, protein-DNA interaction; PR, protein-RNA interaction; RB, regulation of binding; L, proteolysis.
FIG. 4.
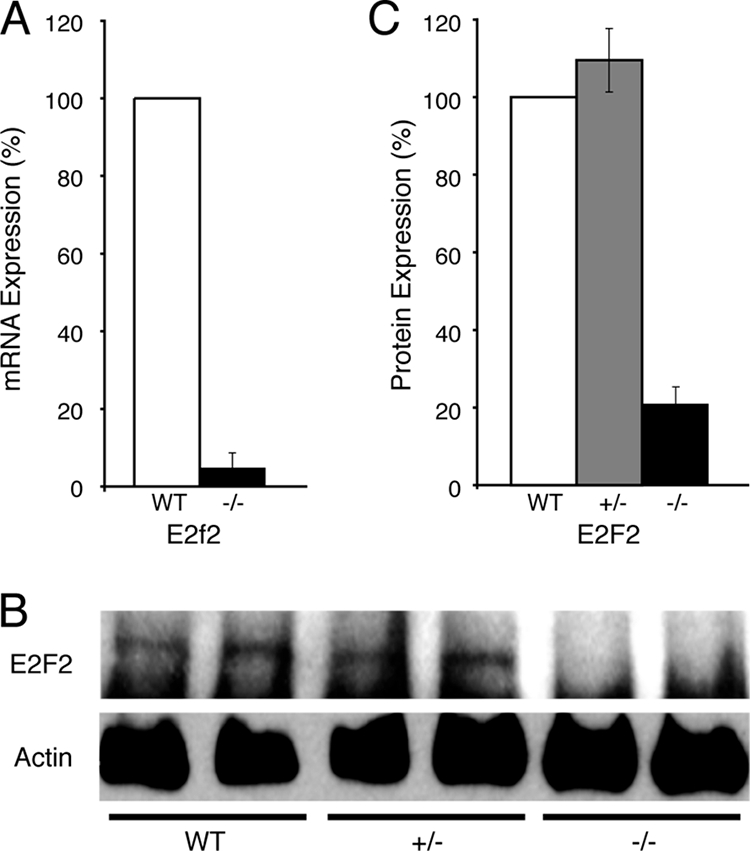
Verification of decreased levels of E2f2 in sorted R1/R2 cells from E13.5 wild-type and Eklf−/− fetal livers. (A) Quantitative RT-PCR analysis of E2f2 mRNA in sorted R1/R2 cells from E13.5 wild-type and Eklf−/− (−/−) embryos. The mean mRNA levels (with the standard deviation) are related to the level in wild-type cells (designated 100%). (B) Representative Western blot of E2F2 protein levels in sorted R1/R2 cells from E13.5 wild-type, heterozygous Eklf+/− (+/−) and Eklf−/− (−/−) embryos. Actin levels are shown as controls. (C) Relative E2F2 protein levels (with the standard deviation) in sorted R1/R2 cells from E13.5 wild-type, heterozygous Eklf+/− (+/−), and Eklf−/− (−/−) embryos. The mean protein levels of each genotype were quantified by using a Molecular Dynamics Storm 860 scanner and are normalized to the level in wild-type cells (designated 100%). WT, wild type.
Based on these data, we hypothesized that Eklf−/− R1 and R2 fetal liver cells would display an abnormal cell cycle profile. Sorted E13.5 wild-type and Eklf−/− R1 and R2 fetal liver cells were stained with propidium iodide to measure nuclear DNA content (see Fig. S2 in the supplemental material). Compared to wild-type fetal liver cells, we observed a significant increase in the percentage of Eklf−/− cells with G0/G1 (2N) DNA content in both the R1 (P < 0.001) and the R2 (P < 0.002) populations. We also observed significant corresponding decreases in the percentage of Eklf−/− R1 and R2 fetal liver cells containing S-phase (>2N) DNA content (R1, P < 0.001; R2, P < 0.0004) or G2/M (4N) DNA content (R1, P < 0.001; R2, P < 0.0445) (Fig. 5). We conclude that EKLF deficiency impairs cell cycle progression from G1 into S phase in erythroid progenitor and precursor cells.
FIG. 5.
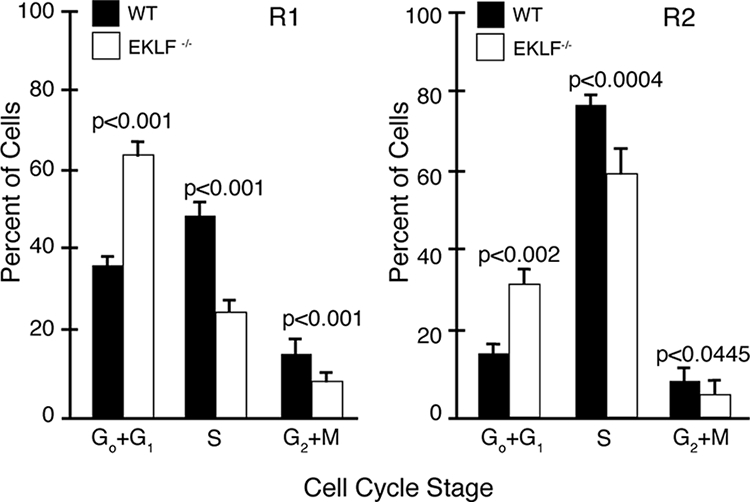
Analysis of cell cycle in sorted R1 and R2 E13.5 fetal liver cells from wild-type and Eklf−/− embryos. Fetal liver cells were sorted into R1 and R2 populations using the windows depicted in Fig. 1 and analyzed for DNA content with propidium iodide. The bars represent the average percentage of cells (with the standard deviation; y axis) at each stage of the cell cycle (x axis). Black bars represent cells sorted from wild-type fetal liver, and the open bars represent cells sorted from Eklf−/− fetal liver. (Left panel) Cell cycle analysis of R1 cells; (right panel) cell cycle analysis of R2 cells. WT, wild type.
E2f2 is a direct target of EKLF.
Both the IPA and GeneSifter analyses of the transcript profile identified E2f2 as the gene most affected by EKLF deficiency. We hypothesized that the E2f2 locus was a direct target of EKLF and that the E2f2 locus required EKLF for expression in erythroid progenitor cells. The sequence of the E2f2 locus, including the coding region and 5-kb of sequence flanking the 5′ and 3′ ends of the coding region, contains >48 KLF consensus binding motifs (NCNCNCCCN), including 11 within 2.5 kb of the transcription start site (+1). HA-EKLF mice express fully functional EKLF protein bearing a hemagglutinin (HA) tag to facilitate immunoprecipitation with a highly specific and sensitive anti-HA antibody (43). To assay for direct association of EKLF with the E2f2 promoter, we performed ChIP analyses on five independent chromatin preparations from sorted R1 and R2 fetal liver cells from E13.5 HA-EKLF embryos. Real-time PCR analysis using primers from the 2.5-kb E2f2 promoter region was performed to measure the enrichment of anti-HA immunoprecipitated chromatin. A total of six regions were analyzed: one that does not contain any NCNCNCCCN motifs (-C, Fig. 6) and five others that contain between one and three NCNCNCCCN motifs. The -C region showed the same level of enrichment as the mouse α-globin and keratin promoters (data not shown). Regions 1 to 3 contain three (region 1), two overlapping (region 2), or two distinct (region 3) NCNCNCCCN motifs. These regions were significantly more enriched than the -C region (P < 0.002), indicating EKLF occupancy. The two most proximal regions (region 4, containing one NCNCNCCCN motif, and region 5, containing two overlapping NCNCNCCCN motifs) were significantly enriched compared to both the -C region and regions 1 to 3 (all P < 0.008), demonstrating higher levels of EKLF occupancy (Fig. 6).
FIG. 6.

ChIP analysis of the E2f2 promoter region in sorted R1/R2 E13.5 fetal liver cells from wild-type embryos expressing HA-EKLF. Chromatin fragments were precipitated with anti-HA antibody and amplified with six sets of primers from the E2f2 promoter region. Regions 1 to 5 contain one or more consensus EKLF binding motifs (NCNCNCCCN). The negative control region (-C) does not contain an EKLF binding motif. The location of the primers flanking each region is indicated. The dark gray bars represent the enrichment of each sequence relative to the -C region (gray bar; designated as 1.0).
EKLF participates in chromatin remodeling as evidenced by DNase I hypersensitive site formation in both in vitro and in vivo systems (4), (35). We hypothesized that EKLF binding is required to remodel the E2f2 locus in early erythroid progenitor cells. We designed a set of 287 PCR primers that cover the E2f2 locus and 50 kb of DNA upstream (including the Id3 locus) and downstream (including the Ddefl1 locus) of the E2f2 gene to compare the sensitivity to DNase I digestion of chromatin from E13.5 wild-type and Eklf−/− R1 and R2 fetal liver cells. In Fig. 7, the blue (wild type) and black (Eklf−/−) bars represent the degree of digestion by DNase I for the corresponding region. Blue and black bars of the same height indicate small differences between wild-type and Eklf−/− R1 and R2 fetal liver chromatin. In the region between Id3 and E2f2, wild-type and Eklf−/− chromatin do not differ significantly in their sensitivity to DNase digestion (Fig. 7, bracket A). In wild-type R1 and R2 fetal liver cells, which express E2F2 protein, the E2f2 locus (including the promoter region) and 10 kb of chromatin between E2f2 and Ddefl1 was sensitive to DNase digestion, while in Eklf−/− R1 and R2 fetal liver cells, which do not express E2F2 protein, the E2f2 locus was insensitive to DNase digestion (Fig. 7, bracket B; P = 6.04 × 10⁻¹⁸).
FIG. 7.

DNase I sensitivity analysis of the mouse E2f2 locus in sorted R1/R2 E13.5 fetal liver cells from wild-type and Eklf−/− embryos. DNA was extracted from the nuclei of sorted cells treated with or without DNase I. The DNA was amplified with a series of 287 primers spanning the E2f2 gene plus 50 kb of 5′ and 3′ flanking DNA by using a real-time PCR assay. The top of the figure shows the location of the E2f2 and the flanking loci on mouse chromosome 4. The paired vertical bars represent the DNase I sensitivity at each point in this region. DNase I sensitivity was calculated by subtracting the average number of cycles needed to amplify a specific amount of product in untreated DNA from the average number of cycles needed to amplify the same amount of product in the DNase-treated DNA. The results are the means of triplicate analyses of each point in a composite of three or four (depending on the region) independent experiments. The blue bars represent the signals in DNA extracted from wild-type chromatin. The black bars represent the signals in DNA extracted from Eklf−/− chromatin. The mean level of DNase digestion in the region indicated by bracket A is similar in wild-type and Eklf−/− chromatin. The mean level of DNase digestion in the region indicated by bracket B is significantly greater in wild-type chromatin compared to Eklf−/− chromatin (P < 0.001). WT, wild type.
DISCUSSION
Our microarray analyses differ significantly from previously published gene expression profiles comparing Eklf−/− and wild-type fetal liver cells that used custom arrays that either are not compatible with analysis programs (16), are not publicly available, or had single replicates (20). Our array experiments included three biologic and two technical replicates each of wild-type and Eklf−/− fetal liver RNA. Most importantly, the previous reports compared total fetal liver cells, which likely introduced a bias into the expression profiling, obscuring EKLF-dependent effects with differences between terminally differentiating erythroid cells and erythroid progenitors and precursors. Confirming this hypothesis in preliminary studies, we demonstrated that many genes (including Ahsp, Ank1, and Slc4a1) with ≥2-fold differences in expression between unfractionated wild-type and Eklf−/− fetal liver mRNA were expressed at ≥4-fold-higher levels in wild-type R3+R4+R5 cells compared to wild-type R1+R2 cells.
Our observations support a model of defective definitive erythropoiesis in Eklf−/− embryos, resulting in the limited production of abnormal erythrocytes at insufficient numbers to support fetal development. With quantitatively more BFU-E and CFU-E than wild type, the severe anemia of E13.5 Eklf−/− embryos is not due to a deficit of erythroid progenitor cells. Our unbiased analysis of the entire gene expression profile suggested that cell cycle defects were the major contributor to the failure of definitive erythropoiesis and that the block in cell cycle progression was in part due to a lack of E2F2. During early G1, an unphosphorylated retinoblastoma tumor suppressor protein (pRb) sequesters E2F proteins in the cytosol, preventing E2F from transactivating target genes, such as the G1 cyclins A and E. Cyclins A and E associate with cyclin-dependent kinases to phosphorylate pRb, causing a release of E2F. Free E2F then transactivates target gene transcription, stimulating a feed-forward mechanism of cyclin-cyclin-dependent kinase activation and pRb phosphorylation, pushing the cell cycle into S phase (17). Dirlam et al. (12) have demonstrated that E2F2 is the major pRb-associated member of the E2F family active during terminal erythroid maturation.
Our model predicts that EKLF acts upstream of E2f2. Consistent with this model, we also observed significant decreases in the mRNA level of Rbl1, Rbl2, E2f4, E2f1, and the E2F target genes cyclin A and cyclin E in Eklf−/− R1 and R2 fetal liver cells. Additional evidence is provided by the observation that E2f1−/− E2f2−/− mice have impaired erythropoiesis due to delayed S-phase progression coupled with a severe decrease in the level of β-globin mRNA (30), similar to Eklf−/− embryos. Rb−/− mice also exhibit defective definitive erythropoiesis, marked by impaired cell cycle exit and failure to enucleate (11, 23, 36), whereas E2f4−/− mice have an abnormal expansion of erythroid progenitors and abnormal cell cycle progression (21, 26). Although E2F2 is expressed in many cell types, its role(s) in erythropoiesis appears to be especially critical. We propose that EKLF binding is responsible for maintaining the E2f2 locus in an active chromatin state for transcription in early erythroid cells. In turn, E2F2 protein transactivates other pathway members, allowing progression of early erythroid progenitor cells, including BFU-E and/or CFU-E, through the G1/S transition in the divisions prior to terminal erythroid differentiation.
Supplementary Material
Acknowledgments
This study was supported by grants RO1 DK62039 and RO1 HL65448 (P.G.G.) and T32 HD07094 (J.I.S.) and by NHGRI intramural funds.
Footnotes
Published ahead of print on 13 October 2008.
Supplemental material for this article may be found at http://mcb.asm.org/.
REFERENCES
- 1.Adams, P. D., and W. G. Kaelin, Jr. 1995. Transcriptional control by E2F. Semin. Cancer Biol. 699-108. [DOI] [PubMed] [Google Scholar]
- 2.Alter, B. P., S. C. Goff, G. D. Efremov, M. E. Gravely, and T. H. Huisman. 1980. Globin chain electrophoresis: a new approach to the determination of the G gamma/A gamma ratio in fetal haemoglobin and to studies of globin synthesis. Br. J. Haematol 44527-534. [DOI] [PubMed] [Google Scholar]
- 3.Alter, B. P., B. T. Jackson, J. M. Lipton, G. J. Piasecki, P. L. Jackson, M. Kudisch, and D. G. Nathan. 1981. Control of the simian fetal hemoglobin switch at the progenitor cell level. J. Clin. Investig. 67458-466. [DOI] [PMC free article] [PubMed] [Google Scholar]
- 4.Armstrong, J. A., J. J. Bieker, and B. M. Emerson. 1998. A SWI/SNF-related chromatin remodeling complex, E-RC1, is required for tissue-specific transcriptional regulation by EKLF in vitro. Cell 9593-104. [DOI] [PubMed] [Google Scholar]
- 5.Bernat, J. A., G. E. Crawford, A. Y. Ogurtsov, F. S. Collins, D. Ginsburg, and A. S. Kondrashov. 2006. Distant conserved sequences flanking endothelial-specific promoters contain tissue-specific DNase-hypersensitive sites and over-represented motifs. Hum. Mol. Genet. 152098-2105. [DOI] [PubMed] [Google Scholar]
- 6.Bieker, J. J. 2001. Kruppel-like factors: three fingers in many pies. J. Biol. Chem. 27634355-34358. [DOI] [PubMed] [Google Scholar]
- 7.Bieker, J. J., and C. M. Southwood. 1995. The erythroid Kruppel-like factor transactivation domain is a critical component for cell-specific inducibility of a beta-globin promoter. Mol. Cell. Biol. 15852-860. [DOI] [PMC free article] [PubMed] [Google Scholar]
- 8.Blobel, G. A., T. Nakajima, R. Eckner, M. Montminy, and S. H. Orkin. 1998. CREB-binding protein cooperates with transcription factor GATA-1 and is required for erythroid differentiation. Proc. Natl. Acad. Sci. USA 952061-2066. [DOI] [PMC free article] [PubMed] [Google Scholar]
- 9.Brown, R. C., S. Pattison, J. van Ree, E. Coghill, A. Perkins, S. M. Jane, and J. M. Cunningham. 2002. Distinct domains of erythroid Kruppel-like factor modulate chromatin remodeling and transactivation at the endogenous beta-globin gene promoter. Mol. Cell. Biol. 22161-170. [DOI] [PMC free article] [PubMed] [Google Scholar]
- 10.Cantor, A. B., and S. H. Orkin. 2002. Transcriptional regulation of erythropoiesis: an affair involving multiple partners. Oncogene 213368-3376. [DOI] [PubMed] [Google Scholar]
- 11.Clark, A. J., K. M. Doyle, and P. O. Humbert. 2004. Cell-intrinsic requirement for pRb in erythropoiesis. Blood 1041324-1326. [DOI] [PubMed] [Google Scholar]
- 12.Dirlam, A., B. T. Spike, and K. F. Macleod. 2007. Deregulated E2f-2 underlies cell cycle and maturation defects in retinoblastoma null erythroblasts. Mol. Cell. Biol. 278713-8728. [DOI] [PMC free article] [PubMed] [Google Scholar]
- 13.Donze, D., T. M. Townes, and J. J. Bieker. 1995. Role of erythroid Kruppel-like factor in human gamma- to beta-globin gene switching. J. Biol. Chem. 2701955-1959. [DOI] [PubMed] [Google Scholar]
- 14.Dorschner, M. O., M. Hawrylycz, R. Humbert, J. C. Wallace, A. Shafer, J. Kawamoto, J. Mack, R. Hall, J. Goldy, P. J. Sabo, A. Kohli, Q. Li, M. McArthur, and J. A. Stamatoyannopoulos. 2004. High-throughput localization of functional elements by quantitative chromatin profiling. Nat. Methods 1219-225. [DOI] [PubMed] [Google Scholar]
- 15.Drissen, R., R. J. Palstra, N. Gillemans, E. Splinter, F. Grosveld, S. Philipsen, and W. de Laat. 2004. The active spatial organization of the beta-globin locus requires the transcription factor EKLF. Genes Dev. 182485-2490. [DOI] [PMC free article] [PubMed] [Google Scholar]
- 16.Drissen, R., M. von Lindern, A. Kolbus, S. Driegen, P. Steinlein, H. Beug, F. Grosveld, and S. Philipsen. 2005. The erythroid phenotype of EKLF-null mice: defects in hemoglobin metabolism and membrane stability. Mol. Cell. Biol. 255205-5214. [DOI] [PMC free article] [PubMed] [Google Scholar]
- 17.Giacinti, C., and A. Giordano. 2006. RB and cell cycle progression. Oncogene 255220-5227. [DOI] [PubMed] [Google Scholar]
- 18.Gillemans, N., R. Tewari, F. Lindeboom, R. Rottier, T. de Wit, M. Wijgerde, F. Grosveld, and S. Philipsen. 1998. Altered DNA-binding specificity mutants of EKLF and Sp1 show that EKLF is an activator of the beta-globin locus control region in vivo. Genes Dev. 122863-2873. [DOI] [PMC free article] [PubMed] [Google Scholar]
- 19.Harju, S., K. J. McQueen, and K. R. Peterson. 2002. Chromatin structure and control of beta-like globin gene switching. Exp. Biol. Med. 227683-700. [DOI] [PubMed] [Google Scholar]
- 20.Hodge, D., E. Coghill, J. Keys, T. Maguire, B. Hartmann, A. McDowall, M. Weiss, S. Grimmond, and A. Perkins. 2006. A global role for EKLF in definitive and primitive erythropoiesis. Blood 1073359-3370. [DOI] [PMC free article] [PubMed] [Google Scholar]
- 21.Humbert, P. O., C. Rogers, S. Ganiatsas, R. L. Landsberg, J. M. Trimarchi, S. Dandapani, C. Brugnara, S. Erdman, M. Schrenzel, R. T. Bronson, and J. A. Lees. 2000. E2F4 is essential for normal erythrocyte maturation and neonatal viability. Mol. Cell 6281-291. [DOI] [PubMed] [Google Scholar]
- 22.Ikuta, K., T. Kina, I. MacNeil, N. Uchida, B. Peault, Y. H. Chien, and I. L. Weissman. 1990. A developmental switch in thymic lymphocyte maturation potential occurs at the level of hematopoietic stem cells. Cell 62863-874. [DOI] [PubMed] [Google Scholar]
- 23.Jacks, T., A. Fazeli, E. M. Schmitt, R. T. Bronson, M. A. Goodell, and R. A. Weinberg. 1992. Effects of an Rb mutation in the mouse. Nature 359295-300. [DOI] [PubMed] [Google Scholar]
- 24.Kaczynski, J., T. Cook, and R. Urrutia. 2003. Sp1- and Kruppel-like transcription factors. Genome Biol. 4206. [DOI] [PMC free article] [PubMed] [Google Scholar]
- 25.Kadam, S., G. S. McAlpine, M. L. Phelan, R. E. Kingston, K. A. Jones, and B. M. Emerson. 2000. Functional selectivity of recombinant mammalian SWI/SNF subunits. Genes Dev. 142441-2451. [DOI] [PMC free article] [PubMed] [Google Scholar]
- 26.Kinross, K. M., A. J. Clark, R. M. Iazzolino, and P. O. Humbert. 2006. E2f4 regulates fetal erythropoiesis through the promotion of cellular proliferation. Blood 108886-895. [DOI] [PubMed] [Google Scholar]
- 27.Koury, M. J., S. T. Sawyer, and S. J. Brandt. 2002. New insights into erythropoiesis. Curr. Opin. Hematol. 993-100. [DOI] [PubMed] [Google Scholar]
- 28.Lee, C. H., M. R. Murphy, J. S. Lee, and J. H. Chung. 1999. Targeting a SWI/SNF-related chromatin remodeling complex to the beta-globin promoter in erythroid cells. Proc. Natl. Acad. Sci. USA 9612311-12315. [DOI] [PMC free article] [PubMed] [Google Scholar]
- 29.Leone, G., R. Sears, E. Huang, R. Rempel, F. Nuckolls, C. H. Park, P. Giangrande, L. Wu, H. I. Saavedra, S. J. Field, M. A. Thompson, H. Yang, Y. Fujiwara, M. E. Greenberg, S. Orkin, C. Smith, and J. R. Nevins. 2001. Myc requires distinct E2F activities to induce S phase and apoptosis. Mol. Cell 8105-113. [DOI] [PubMed] [Google Scholar]
- 30.Li, F. X., J. W. Zhu, C. J. Hogan, and J. DeGregori. 2003. Defective gene expression, S phase progression, and maturation during hematopoiesis in E2F1/E2F2 mutant mice. Mol. Cell. Biol. 233607-3622. [DOI] [PMC free article] [PubMed] [Google Scholar]
- 31.Nilson, D. G., D. E. Sabatino, D. M. Bodine, and P. G. Gallagher. 2006. Major erythrocyte membrane protein genes in EKLF-deficient mice. Exp. Hematol. 34705-712. [DOI] [PubMed] [Google Scholar]
- 32.Nuez, B., D. Michalovich, A. Bygrave, R. Ploemacher, and F. Grosveld. 1995. Defective haematopoiesis in fetal liver resulting from inactivation of the EKLF gene. Nature 375316-318. [DOI] [PubMed] [Google Scholar]
- 33.Perkins, A. C., K. M. Gaensler, and S. H. Orkin. 1996. Silencing of human fetal globin expression is impaired in the absence of the adult beta-globin gene activator protein EKLF. Proc. Natl. Acad. Sci. USA 9312267-12271. [DOI] [PMC free article] [PubMed] [Google Scholar]
- 34.Perkins, A. C., A. H. Sharpe, and S. H. Orkin. 1995. Lethal beta-thalassaemia in mice lacking the erythroid CACCC-transcription factor EKLF. Nature 375318-322. [DOI] [PubMed] [Google Scholar]
- 35.Pilon, A. M., D. G. Nilson, D. Zhou, J. Sangerman, T. M. Townes, D. M. Bodine, and P. G. Gallagher. 2006. Alterations in expression and chromatin configuration of the alpha hemoglobin-stabilizing protein gene in erythroid Kruppel-like factor-deficient mice. Mol. Cell. Biol. 264368-4377. [DOI] [PMC free article] [PubMed] [Google Scholar]
- 36.Spike, B. T., A. Dirlam, B. C. Dibling, J. Marvin, B. O. Williams, T. Jacks, and K. F. Macleod. 2004. The Rb tumor suppressor is required for stress erythropoiesis. EMBO J. 234319-4329. [DOI] [PMC free article] [PubMed] [Google Scholar]
- 37.Tewari, R., N. Gillemans, M. Wijgerde, B. Nuez, M. von Lindern, F. Grosveld, and S. Philipsen. 1998. Erythroid Kruppel-like factor (EKLF) is active in primitive and definitive erythroid cells and is required for the function of 5′HS3 of the beta-globin locus control region. EMBO J. 172334-2341. [DOI] [PMC free article] [PubMed] [Google Scholar]
- 38.Wijgerde, M., J. Gribnau, T. Trimborn, B. Nuez, S. Philipsen, F. Grosveld, and P. Fraser. 1996. The role of EKLF in human beta-globin gene competition. Genes Dev. 102894-2902. [DOI] [PubMed] [Google Scholar]
- 39.Wong, E. Y., J. Lin, B. G. Forget, D. M. Bodine, and P. G. Gallagher. 2004. Sequences downstream of the erythroid promoter are required for high level expression of the human alpha-spectrin gene. J. Biol. Chem. 27955024-55033. [DOI] [PubMed] [Google Scholar]
- 40.Zhang, J., M. Socolovsky, A. W. Gross, and H. F. Lodish. 2003. Role of Ras signaling in erythroid differentiation of mouse fetal liver cells: functional analysis by a flow cytometry-based novel culture system. Blood 1023938-3946. [DOI] [PubMed] [Google Scholar]
- 41.Zhang, W., and J. J. Bieker. 1998. Acetylation and modulation of erythroid Kruppel-like factor (EKLF) activity by interaction with histone acetyltransferases. Proc. Natl. Acad. Sci. USA 959855-9860. [DOI] [PMC free article] [PubMed] [Google Scholar]
- 42.Zhang, W., S. Kadam, B. M. Emerson, and J. J. Bieker. 2001. Site-specific acetylation by p300 or CREB binding protein regulates erythroid Kruppel-like factor transcriptional activity via its interaction with the SWI-SNF complex. Mol. Cell. Biol. 212413-2422. [DOI] [PMC free article] [PubMed] [Google Scholar]
- 43.Zhou, D., J. X. Ren, T. M. Ryan, N. P. Higgins, and T. M. Townes. 2004. Rapid tagging of endogenous mouse genes by recombineering and ES cell complementation of tetraploid blastocysts. Nucleic Acids Res. 32e128. [DOI] [PMC free article] [PubMed] [Google Scholar]
Associated Data
This section collects any data citations, data availability statements, or supplementary materials included in this article.