Abstract
The conformation and dynamics of a single DNA molecule undergoing oscillatory pressure-driven flow in microfluidic channels is studied using Brownian dynamics simulations, accounting for hydrodynamic interactions between segments in the bulk and between the chain and the walls. Oscillatory flow provides a scenario under which the polymers may remain in the channel for an indefinite amount of time as they are stretched and migrate away from the channel walls. We show that by controlling the chain length, flow rate and oscillatory flow frequency, we are able to manipulate the chain extension and the chain migration from the channel walls. The chain stretch and the chain depletion layer thickness near the wall are found to increase as the Weissenberg number increases and as the oscillatory frequency decreases.
I. INTRODUCTION
Advances in photolithography and soft lithography techniques [1, 2] have facilitated the design and development of inexpensive microfluidic devices as biochemical analysis tools [3–9]. The microfluidic platform promises high accuracy/throughput analysis of DNA molecules, and novel microchannel geometries and designs have been invented to achieve particular functionalities such as chain stretching and separation [10–12]. Currently, there is a strong desire to understand how DNA molecules and macromolecules in general interact with the microfluidic confinement, particularly where the confinement dimensions are comparable to the chain radius of gyration (Rg) and the chain contour length (L). More broadly, understanding the conformations and dynamics of macromolecules in a highly confined environments is an interesting problem applicable in problems ranging from the motion of cytoplasm to the mechanical properties of polymer thin films.
Several theoretical and simulation studies in the last few decades have significantly advanced our understanding of the polymer physical properties in confined environments [13–16]. Advances in simulation methods have permitted development of coarse-grained models that capture a wide variety of physical characteristics such as DNA diffusivity in bulk and in confinement [17–25]. Recent Brownian dynamics simulations have examined changes in DNA conformation in extensional flow as a function of the extensional shear rate [24]. The same simulation method was applied to better understand the conformation of DNA molecules when the molecules are in proximity of adsorbing surfaces [17]. Jendrejack and coworkers recently performed Brownian dynamics simulations in free solution and in microchannels with a square cross section. These simulations account for the inter-particle hydrodynamic interactions and perturbations of the hydrodynamic interactions due to the presence of the confining walls [22, 23, 26]. Comparison with experimental measurements of DNA diffusivity (D) showed that hydrodynamic interactions are necessary to accurately predict the chain diffusivity, confirming prior studies [21, 27, 28]. The work of Jendrejack et al. [26] also predicted that the DNA molecules migrate away from the wall in shear flow, leading to the formation of depletion layers in the near wall region. This prediction ha been observed in recent experiments of dilute DNA solutions undergoing pressure-driven flow in microchannels [29–31].
A theoretical approach has recently been developed to describe the behavior of flowing polymer solutions near solid surface using a bead-spring dumbbell model for the polymer molecules [32]. Hydrodynamic interactions between the chains and the wall lead to migration away from the wall in a manner similar to that encountered in suspensions of droplets [33–35]. At steady state, the hydrodynamic effect is balanced by diffusion, and with some simplifying assumptions, an analytical expression for the resulting concentration profile can be found. The depletion layer thickness (Ld) is determined primarily by the first normal stress difference of the flowing fluid, which is governed by the degree of chain stretching in the flow direction. In flow where the chain is strongly stretched, Ld becomes much larger than the equilibrium size of the polymer chain. For finitely extensible dumbbell models, the model predicts that Ld/Rg ~ We2/3 for We ≫ 1, where Rg is the equilibrium radius of gyration of the chain and We = γ̇τrelax is the Weissenberg number. Here γ̇ is the effective shear rate and τrelax is the longest relaxation time. The model also predicts that the chain density profile reaches steady state over a timescale
One of the consequences of chain migration is that in pressure-driven flow, chain molecules travel faster than the average fluid velocity. This is due to chain molecules migrating toward the center region of the channel where the velocity is the highest. A significant obstacle in directly comparing simulations and experiments in microfluidic channels is the difficulty in attaining fully developed concentration profile of chain molecules at high shear rates. In a microfluidic channels of height (H) on the order of 100 µm, the average flow velocity may be as fast as 1 m/s for aqueous flow with Reynolds number Re ~ 1! Typical microfluidic flows are several orders of magnitude slower with Re ≪ 1, and the flow residence time in the microchannel (for performing bio-chemical analysis or other experiments) ranges from a few seconds to a few minutes. In contrast, the time required for the chain molecule concentration profile to fully develop scales as For lambda phase DNA (λ-DNA) in water and D ≈ 0.43µm2/s [36], the molecule diffuses a distance of O(10) µm in O(102) s. In order for the chain concentration profile to fully develop, the chain molecules need to diffuse for a much longer time than the typical residence time. To resolve this problem, we propose the use of oscillatory flow in microfluidic devices. Oscillatory flow will allow the molecules to remain in the channel as long as needed in order for the chain density profile in the channel to attain steady state. At the same time, the flow oscillatory frequency may also be used to control the chain deformation and manipulate the chain dynamic properties.
In this work, we investigate the conformation and dynamics of DNA molecules undergoing oscillatory pressure-driven flow in microfluidic channels. We employ advanced simulation methods recently shown to accurately capture the dynamics of DNA molecules in bulk and in microfluidic confinement [21, 37]. Our simulation method is summarized in Section II. Results describing how flow may be used to manipulate the behavior of DNA molecules are presented in section III.
II. SIMULATION METHOD
We investigate the conformation and dynamics of chain molecules corresponding to λ-DNA, concatenated 3λ-DNA, and T2-DNA in a 40 µm × 40 µm square microchannel under oscillatory flow. In bulk solution, the radii of gyration for Ns=10, 30, and 34 chains (Ns = the number of springs) are Rg = 0.76, 1.5, and 1.6 µm, the contour lengths are L=21.2, 63.6, and 72.1 µm, and the longest relaxation times are τrelax = 0.095, 0.65, and 0.80 s, respectively. An oscillatory Poiseuille flow in the x-direction with the velocity profile in the channel cross section U⃗(y, z, t) = U⃗(y, z)cos(2πft) is imposed, and U⃗(y, z) is given by [38]
| (1) |
where αn = (2n − 1)π/2. An effective shear rate may be defined as γ̇ = 2Umax/H as in steady flow, where H is the channel height. This allows us to compare the chain deformation and the chain migration in oscillatory flow to those of chains that undergo steady flow.
Brownian dynamics is employed to investigate the conformation and dynamics of one individual DNA molecule modeled as a bead-spring chain. The physical characteristics of the model chain are matched to single molecule experimental measurements of λ-DNA by Smith et al [36, 39]. Specifically, the Kuhn segment length (σk), the hydrodynamic bead radius (a), and the effective volume of the bead (υ) are chosen to fit experimental measurements of the diffusivity, relaxation time, and equilibrium size of λ-DNA [21].
Hydrodynamic interaction between chain segments are accounted for in a continuum fashion (i.e. the solvent is a continuum Newtonian fluid), with the assumption that the diffusion time for solvent molecules is much faster than the shortest relaxation time of the chain. The beads are coarse-grained “blobs”, or interaction sites, each consisting of an ideal random walk of Nk = 19.8 Kuhn segments of length bk = 0.106µm. Two beads at coordinates ri and rj interact with each other through a soft Gaussian excluded volume potential given by [21]
| (2) |
υ = 0.0012µm3 is the excluded volume parameter, and |ri − rj| is the distance between sites i and j. Neighboring beads are linked by worm-like springs, where the spring force is determined from empirical fits to experimental data [40, 41] and given by
| (3) |
The simulation box is periodic in the unconfined flow direction, and the chain segments are repelled from the confining walls through a short ranged cubic potential [23]. The position and momentum for the beads on the chain are evolved in time with an explicit integration scheme according to the Langevin equation [21, 42]
| (4) |
where dt is the time step, and R⃗ is a 3N vector representing the coordinates of all the particles in the system. U⃗ is the unperturbed velocity field, and F⃗ is the force vector composed of the internal (chain conformation) and external (wall and bead excluded volume) forces acting on each bead. The components of dW⃗ are obtained from a real-valued Gaussian with mean zero and variance dt, and the quantity B · dW⃗ is calculated using Fixman’s method. [21] The Brownian forces that appear in the last term of Eq. 4 are coupled to the velocity perturbations through the fluctuation dissipation theorem, given by D = B·BT [42]. D is the diffusion tensor, a 3N × 3N matrix that accounts for intra-chain hydrodynamic interactions between chain segments. It may be separated into the bead self diffusion, the inter-bead hydrodynamic interaction tensor (Green’s function) in the bulk, and the perturbation due to the walls. It is given by
| (5) |
where I is the identity matrix, η is the solvent viscosity, a = 0.077µm is the bead hydrodynamic radius, and Ω is the hydrodynamic interaction tensor. The hydrodynamic interactions between the beads are included by considering a moving bead (or “blob”) as a point force on the surrounding fluid. The point force affects the motion of other beads through the fluid motion it induces. The Green’s function generated by the point force may be written as a superposition of the free space perturbations (Ωfs) and the perturbations due to the confined geometry (Ωw). An analytic expression for Ωfs is given by the Oseen-Burgers tensor [42], although in simulations it is commonly replaced with the Rotne-Prager-Yamakawa (RPY) tensor to avoid complications due to the finite size of the beads [43]. The RPY tensor guarantees positive-semidefiniteness for all chain configurations, which permits use of an algorithm for the solution of Eq.4 that scales as N2.25, where N = number of particles in the system [21, 44].
The wall perturbations to the hydrodynamic interactions are determined by solving the incompressible Stokes flow problem subject to the specific channel geometry using the finite element method [26]. In the H > Rg regime, where our chain model is most valid, recent simulations of DNA chains in microfluidic confinement have shown that the BD-HI method with bulk parameters accurately predicts the DNA diffusivity in slit channels [37]. In square microchannels, the hydrodynamic perturbations to the overall velocity field have been found to decay exponentially with the distance from the point force [23].
The steady state deformation of a chain in unidirectional flow results from a balance between the shear experienced by the chain, the chain relaxation due to spring forces, and entropy. This process may be characterized by the Weissenberg number. In steady channel flow (f = 0), significant chain stretching and migration away from the walls has been observed for We > 1 in prior simulations [22, 23]. In oscillatory flow, the strain (γ) experienced by a chain in a half-cycle is given by
| (6) |
Significant chain stretching, and thus migration is expected only when We ≫ 1 and γ ≫ 1. If We is not large, the flow is not strong enough to overcome the tendency of the chains to relax; if γ is small, the chains do not experience a large deformation and thus cannot become highly stretched. At fixed We, therefore, large stretching is expected at low frequencies, where the strain is large. We performed single molecule simulations and calculated the average chain stretch and the averaged standard deviation of the single chain stretch, 〈X〉 and 〈σx〉, respectively. These quantities are given by
| (7) |
| (8) |
where X̄ is the average chain stretch of trial i, is the chain stretch at time tj of trial i, n is the number of data points per trial, and Ntrials = 100 is the total number of simulation trials. A quantitative measure of the depletion layer thickness (Ld) of chains undergoing oscillatory flow in microchannels is the half-maximal-width of the center-of-mass chain distribution. The results are presented in the following section.
III. RESULTS AND DISCUSSION
A. Constant We
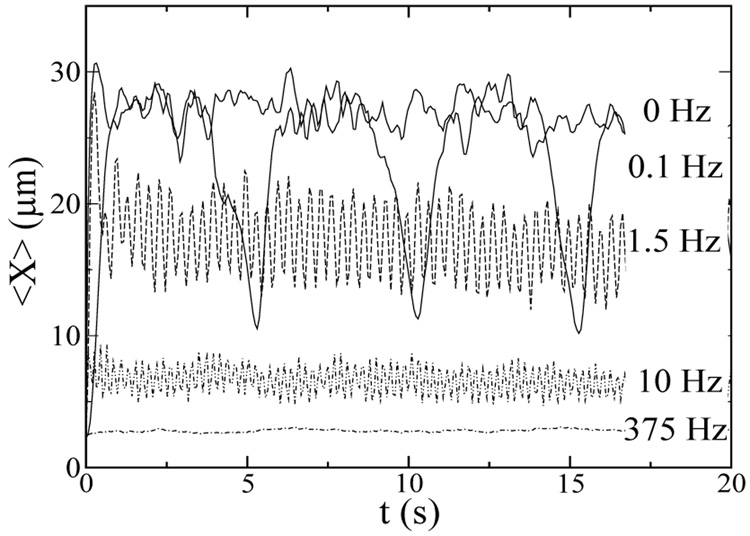
In oscillatory flow, a fluid element is deformed due to the imposed velocity gradient, and the deformation reverses direction every half-cycle. The reversal in the flow direction causes a reversal in the shear experienced by the DNA chain, leading to a smaller chain during the reversal. This effect is shown in Figure 1. In a flow with a long oscillation period, the average chain stretch is indistinguishable from steady flow during each half-cycle, but the chain extension becomes much smaller as the flow reverses direction. During unidirectional flow (f=0), small fluctuations in the chain stretch are due to chain tumbling [20, 45, 46]. In oscillatory flow, these fluctuations are observed when the flow is unidirectional (in the same half-period), but they become largely dominated by the change in the chain stretch due to flow direction reversal, particularly at high frequencies.
FIG. 1.
The average chain stretch for Ns=30 chains undergoing oscillatory flow with γ̇ = 230s−1 in 40 µm × 40 µm microchannels. The frequencies of 0, 0.1, 1.5, 10, and 375 Hz correspond to γ= ∞, 2300, 150, 23, and 0.6.
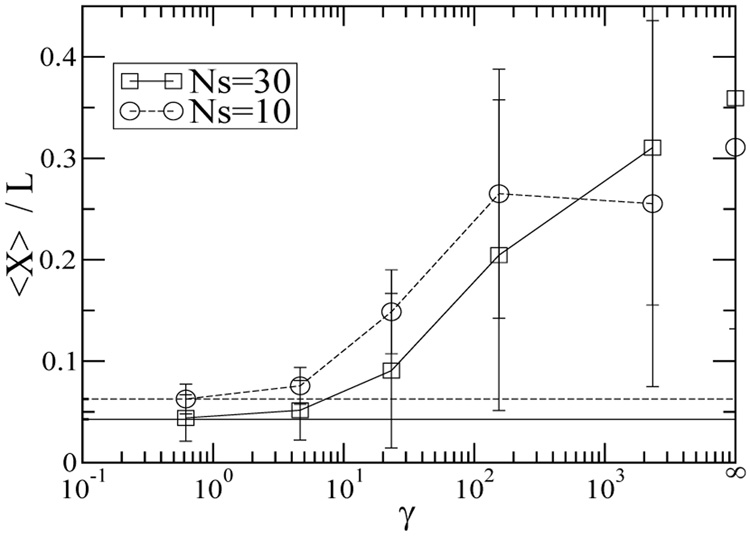
Figure 1 also compares the frequency dependence of chain stretch for chains undergoing constant shear (We = 150). The average chain stretch is found to decrease as the frequency increases, which corresponds to decreasing strain. At sufficiently high frequencies and low strain, the chain conformation is virtually unperturbed by the flow and the chain stretch remains at the equilibrium value. Figure 2 shows the average fractional chain extension (〈X〉 /L) as a function of the strain for Ns = 10 and Ns = 30 chains. In steady flow (f = 0) at a shear rate of 230s−1 (We = 22 for Ns = 10 and We = 150 for Ns = 30), the ensemble averaged chain stretch is 30–35% of the full contour length. This prediction is consistent with experimental measurements of λ-DNA that suggest the highest ensemble averaged fractional chain extension in shear flow is around 40% [45]. In steady flow, fractional chain extension is larger for the Ns = 30 chain because the longer chain undergoes higher We flow at the same shear rate because it has longer relaxation time than the shorter chain. At high strains (low f), 〈X〉 is very weakly dependent on the frequency. Small decreases in 〈X〉 as f increases may be attributed to more frequent drops in 〈X〉 due to flow direction reversal. At low strains (high f), the chain extension reduces dramatically and the chain does not extend at all at very low strains (γ < 10). Interestingly, at low and intermediate strain, the average chain fractional extension is larger for Ns = 10. This can be attributed to (1) smaller fractional stretch of the longer chain at a fixed strain/deformation, (2) less chain migration away from the wall for the shorter chain, and (3) higher chain fractional extension for Ns = 10 at equilibrium (Xeq/L ~ N−2/5 for a self-avoiding chain). Figure 2 shows that the standard deviation of the single chain stretch can be as large as 0.2L at high strain, suggesting that highly stretched molecules (> 0.5L) may be found. Closer inspection of individual λ-DNA molecules at high γ (low f) reveals that the DNA chains may be stretched as much as 70% of their full extension, which has also been observed in steady flow experiments [20, 45].
FIG. 2.
The average fractional chain extension for Ns=30, We = 150 (squares) and Ns=10, We = 22 (circles) chains as a function of γ = γ̇/f (γ̇ = 230s−1). The horizontal lines indicate the equilibrium stretch for Ns=30 (solid lines) and Ns=10 (dashed lines). The average standard deviations for the chain stretch given in eq. (6) are shown. The errors are within the symbol size.
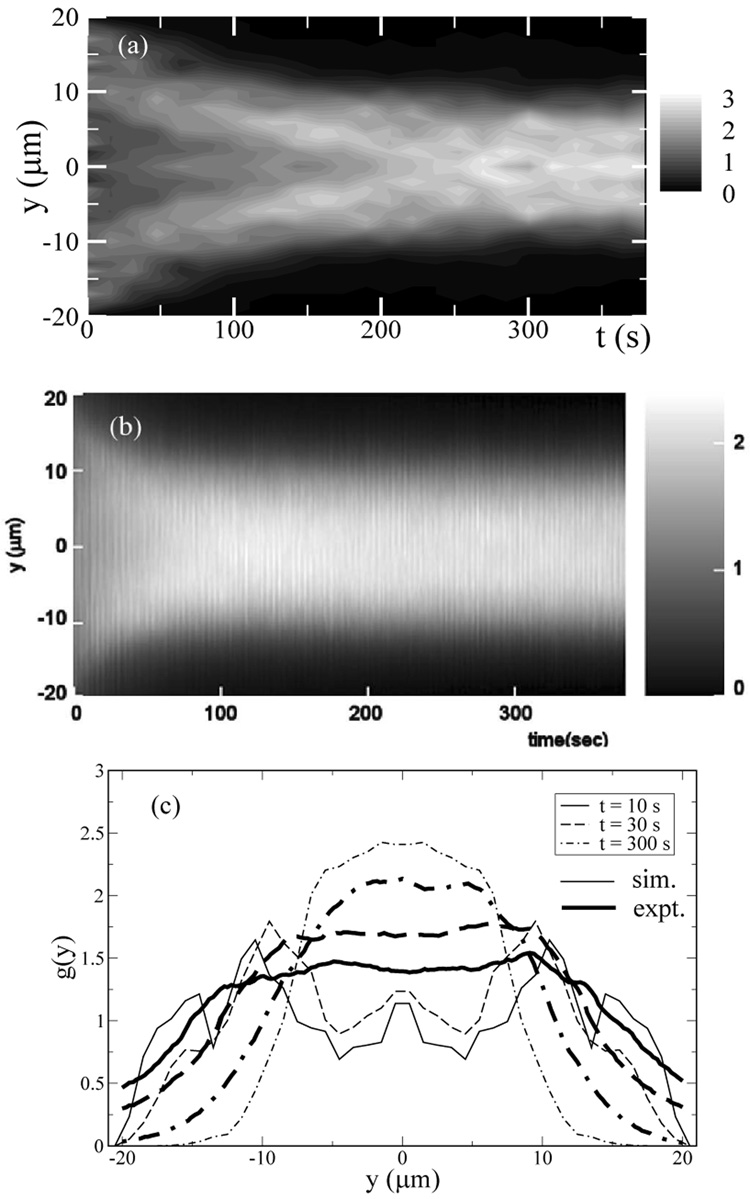
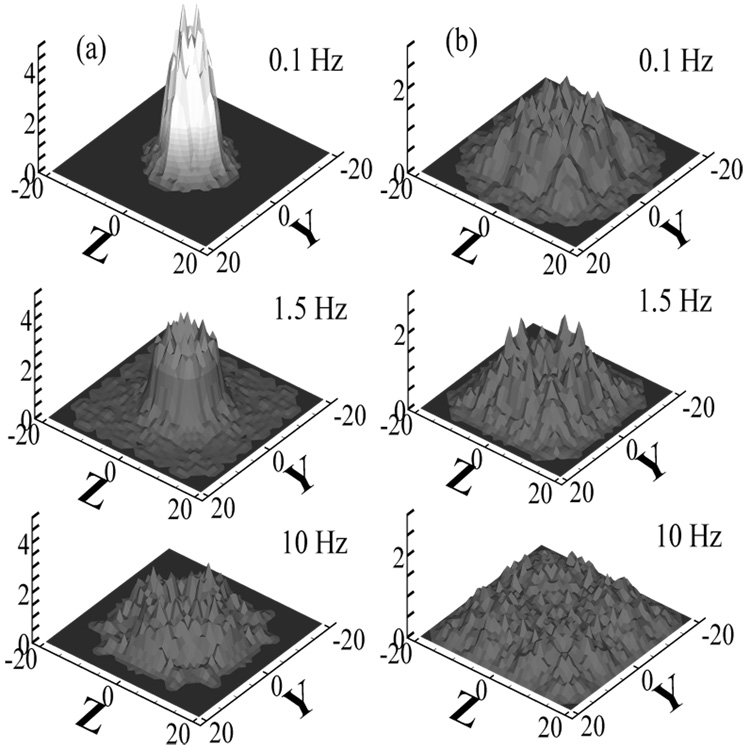
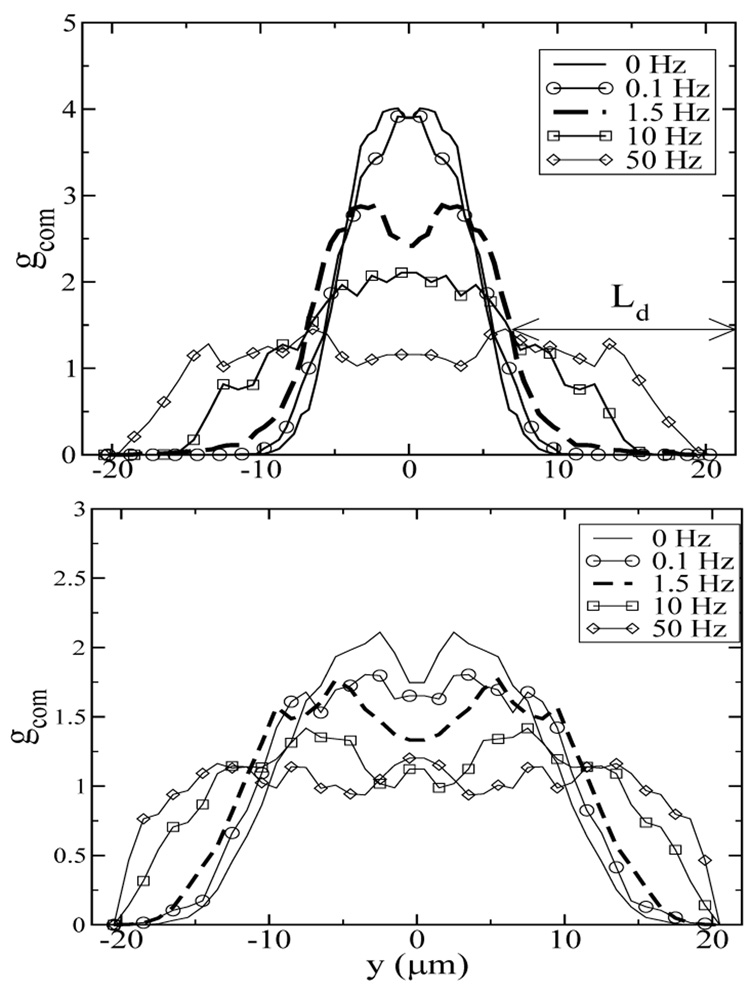
Under steady flow in microchannels, DNA molecules are also found to migrate away from the walls. This effect is due to the hydrodynamic interactions between the chains and the channel walls [26, 32]. As the chain molecule travels through the channel, it moves toward the middle of the channel. Figure 3a shows the ensemble average over 100 trial runs of the bead density distribution of a 34-spring chain, which has a contour length of ≈ 71µm and corresponds to a fluorescently labeled T2-DNA molecule, as a function of the time the chain undergoes oscillatory flow in the channel. The experimental measurements [47] of the fluorescent intensity in the channel cross section for TOTO-labeled T2-DNA molecules undergoing oscillatory flow with the same channel dimensions and flow parameters are shown in Figure 3b. Both the simulations and the experiments show that the DNA chains migrate toward the channel center and the bead density distribution becomes fully developed after ~ 200 s. In Figure 3c, the bead density distribution as a function of the bead distance from the wall found in the simulations is compared to the fluorescent intensity in the channel cross section at short, intermediate, and long times. The results are in semi-quantitative agreement. A smaller depletion layer is found in the experiments that may be due to finite concentration effects and fluorescent smearing. The migration effect can be quantified with the fully developed chain center-of-mass distribution in the channel cross section (gcom), as shown in Figure 4 for Ns = 10 and 30 chains at several We and f. At the same We and γ, the longer chains are found to have a higher distribution near the center of the channel. This is consistent with the observation that longer chains are more stretched and the migration force is stronger. At low f (high strain), the peak of the distribution is off-center as shown in Figure 5 as well as in Figure 4. This has been previously observed in Poiseuille flow [26], and it has been attributed to the competition between the wall hydrodynamic effect that pushes chains away from the walls but cancels exactly at the channel center, and the differences in segment mobility that favor chain motion toward the wall in Poiseuille flow. At high f (low strain), the chains do not migrate away from the wall, in agreement with the observations that chains are not stretched at low strains.
FIG. 3.
(a) The simulation chain distribution in the channel for Ns=34, We=50, and f=0.25 Hz in a 40 µm × 40 µm channel. The distribution is shown as a function of the time the chain has traveled in the channel, averaged over 100 simulations with random initial starting position. Higher chain concentration corresponds to brighter regions. (b) Experimental data [30] for fluorescently labeled T2-DNA, We ≈ 60, and f=0.25 Hz in a 40 µm × 40 µm microchannel. Each tick on the y-axis indicates 10 µm. (c) Chain density distribution as a function of bead distance from the wall from the simulations (lines) and the experiments (thick lines) for t=10 s (solid lines), 30 s (dashed lines), and 300 s (dot-dashed lines).
FIG. 4.
The fully developed center-of-mass distribution gcom in the channel cross section for (a) Ns=30, We = 150 and (b) Ns=10, We = 22. The coordinates in the channel cross section are denoted by y and z. The distributions are normalized to 1 for uniform distribution.
FIG. 5.
The fully developed center-of-mass distribution at the centerline of the yz-plane for (a) Ns=30, We = 150 and (b) Ns=10, We = 23. y denotes the distance between the chain center-of-mass and the channel center. The frequencies are f=0 (solid lines), 0.1 (circles), 1.5 (thick dashed lines), 10 (squares), and 50 (diamonds) Hz, corresponding to γ=∞, 2300, 150, 23, and 4.6. The depletion layer thickness Ld is shown for f=1.5 Hz.
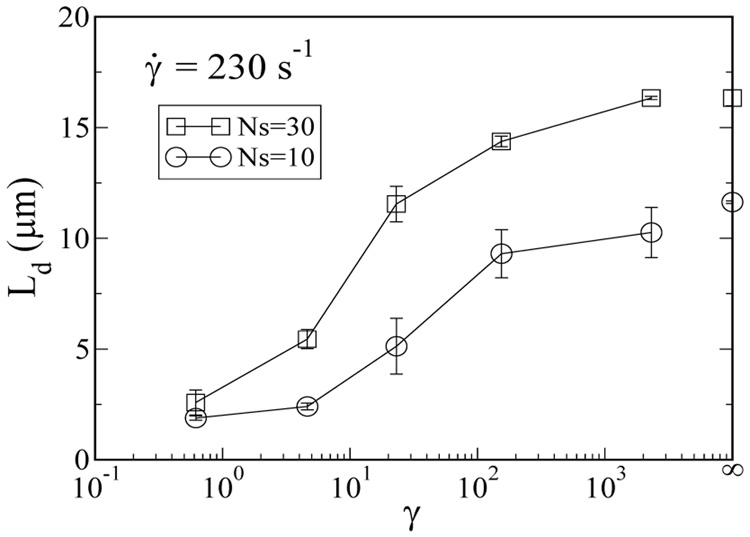
The thickness of the chain depletion zone near the walls at steady state provides a quantitative measure of the migration effect. We define the depletion layer thickness (Ld) as the distance from the wall to the half-maximal-width of the fully developed chain center-of-mass distribution. Figure 6 shows that the depletion layer thickness exhibits similar dependences on strain as the average chain stretch shown in Figure 2. At high γ, Ld is weakly dependent on γ, and is approximately 16µm for Ns = 30 (We = 150) and 10µm for Ns = 10 (We = 22) in the H = 40µm channel. Ld drops dramatically as strain decreases and eventually reaches Rg at very low strain, which is the equilibrium value for the depletion layer thickness.
FIG. 6.
The fully developed depletion layer thickness as a function of strain for Ns=30, We = 150 (squares) and Ns=10, We = 22(circles).
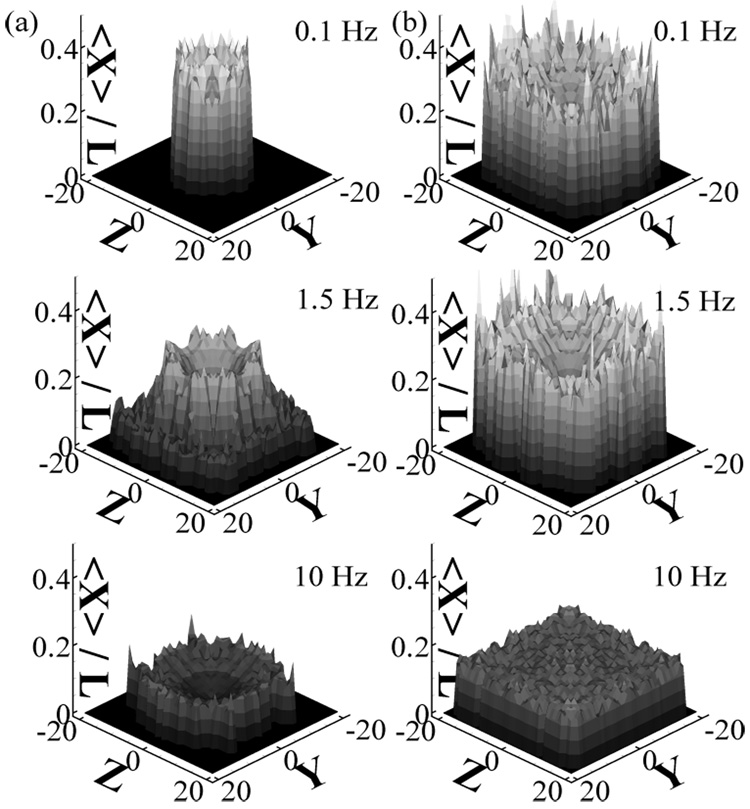
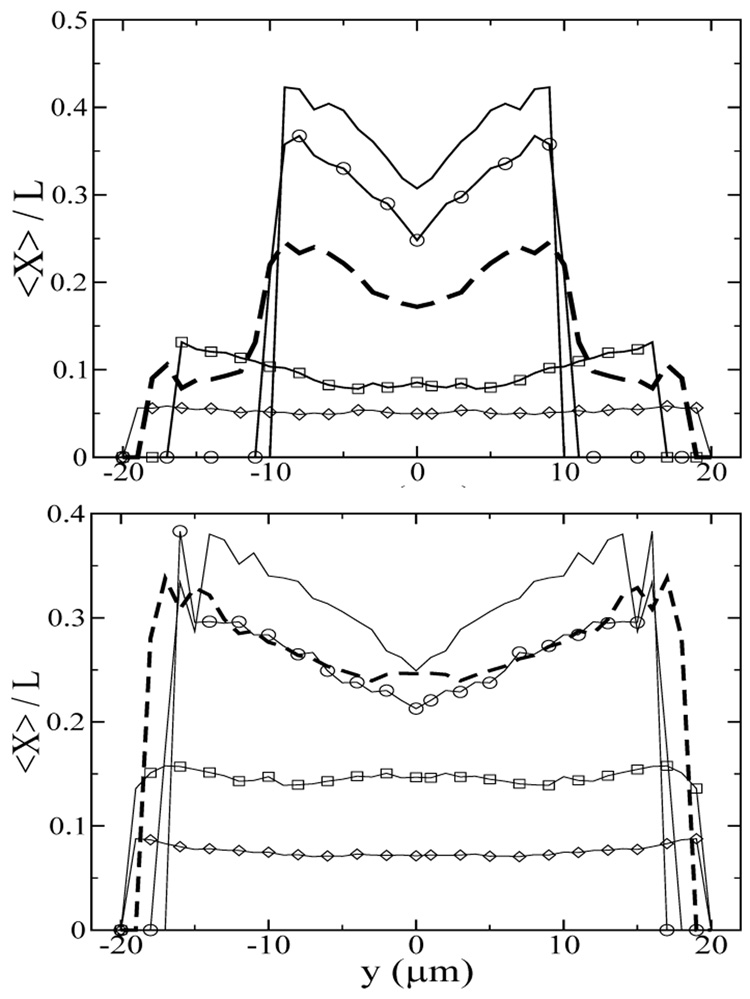
Another interesting phenomenon is that, at steady state, the most extended chains are found in a ring away from both the channel center and the walls, as shown in Figure 7. In Poiseuille flow, the local shear rate is highest near the wall and is zero at the channel center, thus one would expect the most extended chains near the wall. At the same time, the stretched chains migrate away from the wall, leading to the most stretched chains at the border of the depletion zone. Figure 8 shows that at low f (high strain) and an effective shear rate of 230s−1, the fractional chain extension of chains closest to the depletion zone is as much as 50% higher than that of the chains in the channel center. In regions near the wall, there are no chains present because of chain migration. At high f (low strain), the chains do not migrate and the average chain stretch remains the same throughout the channel. For the Ns = 10 chain, the most extended chains are found as close as 4µm from the wall even in steady flow (f = 0), although few chains are found in that region, as suggested by the center-of-mass distribution shown in Figure 5b. As f increases, the strain acting on a chain decreases, leading to lower chain stretch and correspondingly weaker chain migration. In the next section, we investigate how the strain experienced by the chain may be used to manipulate the chain conformation and the migration effect.
FIG. 7.
The fully developed average fractional chain extension distribution in the channel cross section for (a) Ns=30, We = 150 and (b) Ns=10, We = 22. The coordinates in the channel cross section are denoted by y and z.
FIG. 8.
The fully developed average fractional chain extension at the centerline of the yz-plane for (a) Ns=30 and (b) Ns=10 chains at γ̇ = 230s−1. y denotes the distance between the chain center-of-mass and the channel center. The oscillatory frequencies are f=0 (solid lines), 0.1 (circles), 1.5 (thick dashed lines), 10 (squares), and 50 (diamonds) Hz, corresponding to γ = ∞, 2300, 250, 23, 4.6.
B. Constant γ
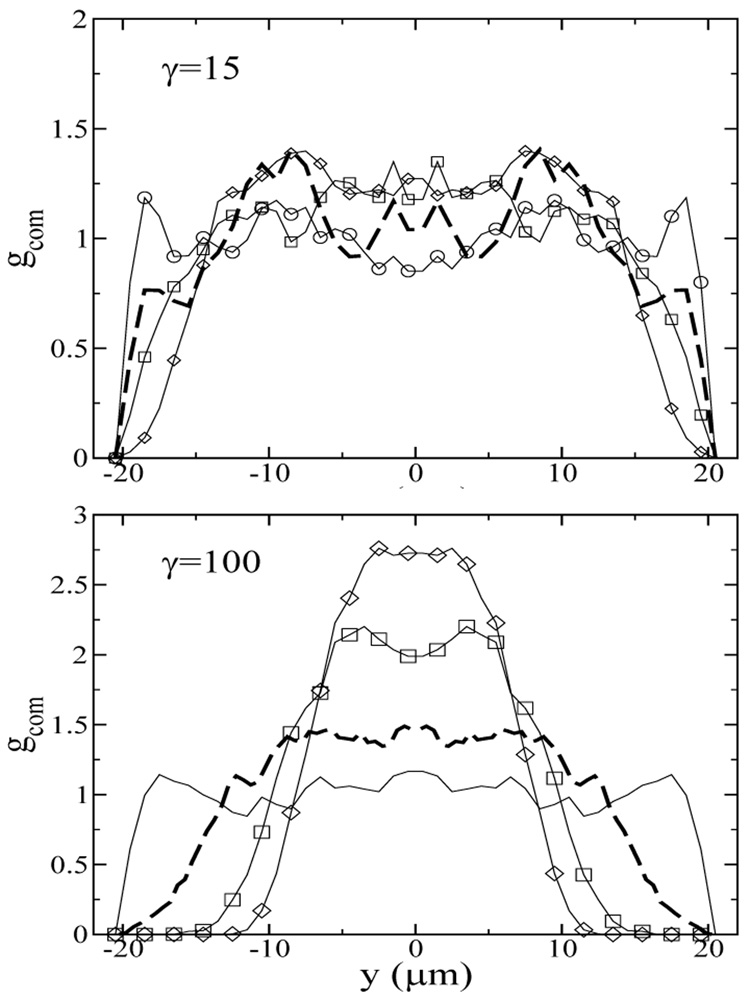
DNA chains in flow undergo deformation due to different segments on the chain sampling the fluid velocity gradient. As shown in Eq. 6, the strain on the chain depends on the shear rate and the oscillation period. In these simulations, γ = γ̇/f is kept at constant values of 15 and 100 for the Ns = 10 chain, and predictions for gcom, 〈X〉, and Ld are calculated as the Weissenberg number is varied.
At the lower strain of γ=15, chain migration is very weakly dependent on the Weissenberg number and the oscillatory frequency. The center-of-mass distribution in Figure 9a appears nearly uniform, with Ld ≈ 7µm, even at a very high shear rate (γ̇ = 750s−1, We = 74). In contrast, in steady flow, a larger depletion layer with Ld ≈ 12µm is found at a lower Weissenberg number of We = 22 for Ns = 10 (Figure 6). This shows that low strain retards chain migration at high shear rate because the frequency is also higher.
FIG. 9.
The fully developed center-of-mass distribution as a function of the center-of-mass coordinates at the centerline of the yz-plane for Ns=10 chains, γ = (a) 15 and (b) 100. y denotes the distance between the chain center-of-mass and the channel center. The oscillatory frequencies are f=0.1 (circles), 1.5 (thick dashed lines), 10 (squares), and 50 (diamonds) Hz, corresponding to We=0.15, 2.3, 15, 74 for γ = 15 and We=1, 15, 100, 500 for γ = 100.
At the higher strain of γ = 100, chain migration is strongly dependent on the Weissenberg number, as shown in Figure 9b. At high strain and low We, or low strain and high We, the center-of-mass distribution remains nearly uniform in the channel cross section. This observation, combined with the results in Figure 2 and Figure 6, where at a moderate Weissenberg number (We = 22) and a very high strain (γ = 2300) the chains are strongly deformed and migrate away from the walls, suggests that both large strain and large We are needed to effect chain stretching and migration.
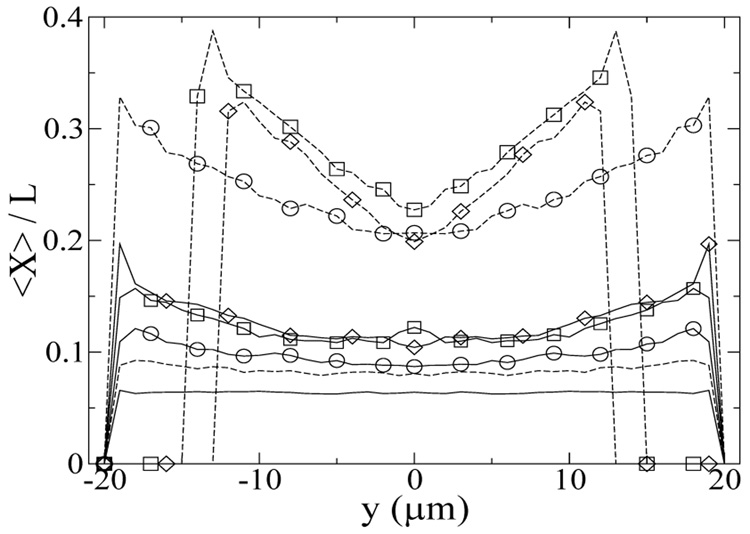
Off-center peaks in the fully developed center-of-mass distribution are also observed in Figure 9, analogous to the results in Figure 5. As observed in the previous section, the most stretched chains are found at the border of the depletion zone, as shown in Figure 10. At the lowest Weissenberg number, the chains are not strongly deformed for both γ =15 and 100, and the steady state chain stretch is the same as at equilibrium (〈Xeq〉 /L=0.07). At γ =15, there is essentially no chain migration (Figure 9a) over the range of We studied, and the most stretched chains are found near the wall. At the highest We, the average chain extension near the wall is approximately 0.2L, roughly 50% more extended than chains in the channel center. At the higher strain of γ=100, the chains do migrate away from the wall at high We, and the average chain extension near the depletion zone is as high as 0.4L, again ≈ 50% more extended than chains in the channel center. At γ=100, the average fractional chain extension appears to decrease as the Weissenberg number increases from 100 to 500. This decrease is due to stronger chain migration towards channel center as the We increases, which reduces the average chain extension because the shear rate decreases towards the channel center, and also the increase in oscillatory frequency (because γ is fixed), which leads to more frequent flow direction reversals. It is of interest to note that the average fractional chain extension at We=100, γ = 100 is similar to the highest chain fractional extension found in Figure 8 for We = 22 in steady flow, despite the retardation of chain relaxation in oscillatory flow. This suggests that the maximum chain stretch is bounded by the finite strain the chains experience in the oscillatory flow.
FIG. 10.
The fully developed average fractional chain extension in the centerline of the yz-plane for Ns=10 chains, γ= 15 (solid lines) and 100 (dashed lines). y denotes the distance between the chain center-of-mass and the channel center. The oscillatory frequencies are f=0.1 (lines), 1.5 (circles), 10 (squares), and 50 (diamonds) Hz, corresponding to We=0.15, 2.3, 15, 74 for γ = 15 and We=1, 15, 100, 500 for γ = 100.
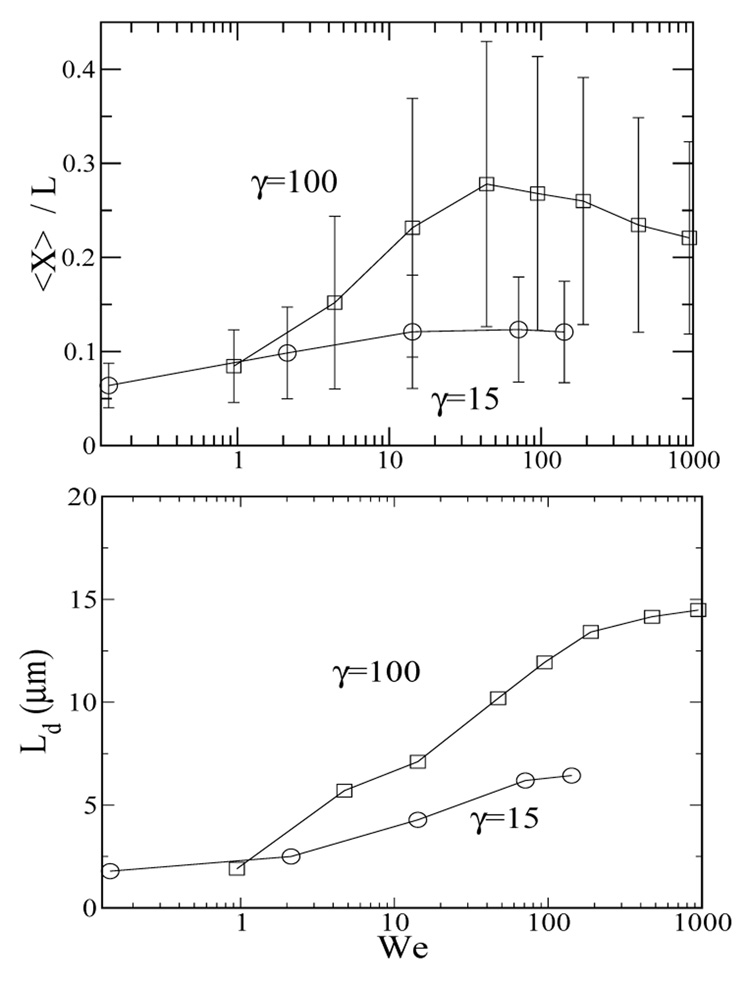
Figure 11 summarizes the overall average fractional chain extension and depletion layer thickness as a function of the Weissenberg number. At low We, the chains neither deform nor migrate away from the walls. As We increases (at fixed γ), both 〈X〉 /L and Ld strongly increase for We > 1 until they reach plateau values at high We (and at the same time high f). Figure 11a shows that at the higher strain rate (γ = 100), the average chain extension reaches a maximum at We ~ 50 and decreases as We further increases. The depletion layer thickness as a function of We (Figure 11b) also undergoes a qualitative change at We ~ 10. The non-monotonic behavior of the average fractional extension may be rationalized by examining the chain center-of-mass and chain stretch distribution for γ = 100, We = 100 and 500 shown in Figure 9 and Figure 10. The figures show that the average chain extension is smaller for We = 500 than We = 100 because the chains have migrated closer to the channel center, where the shear rate is smaller and chains are stretched less.
FIG. 11.
(a) The fully developed average fractional chain extension for Ns=10 chains for γ = 15 (circles) and 100 (squares) as a function of We of all chains in the channel. The average standard deviations for single chain stretch given in eq. (5) are shown. The errors are within the symbol size. (b) The depletion layer thickness for Ns=10 chains for γ = 15 (circles) and 100 (squares) as a function of We. The error bars are smaller than the symbol size in both cases.
Since the role played chain relaxation in chain stretching is retarded by oscillatory flow at high frequencies (as shown in Figure 1), the plateau values at correspondingly high We for 〈X〉 /L are expected to strongly vary with strain. Figure 11a shows that 〈X〉 /L roughly doubles as the strain increases from 15 to 100. This relatively weak dependence is due to (1) chain migration, which leads to non-uniform distribution in the channel cross section, and (2) zero shear rate at the channel center, which leads to less stretched chains near the channel center than near the wall. These two factors combine to dampen the dependence of the average chain extension on strain. When the stretch of an individual chain is examined, the fluctuations in the chain stretch can be quite large. For γ = 100, We = 500, the overall ensemble average chain stretch is only approximately 5 µm, but the stretch of an individual chain fluctuates between 3 and 17 µm. This suggests that oscillatory shear flow may be used to extend chains to nearly the full contour length, and at the same time keeping the chains away from the channel walls, thereby facilitating reactions between the DNA molecule and enzymes or other reactants.
IV. CONCLUSIONS
Our results suggest that in oscillatory microfluidic flow, the dimensionless groups We and γ can be used to manipulate the chain conformation and chain migration, resulting in highly stretched chains away from the channel walls. At a constant effective shear rate of 230 s−1, our simulations predict that at high strain (low f), the average chain stretch and the depletion layer thickness remains roughly constant. As the strain decreases and the oscillation period decreases to times shorter than the chain relaxation time, both 〈X〉 and Ld strongly decrease. For the Ns=30 chain, the depletion layer thickness is found to weakly decrease from 16 µm to 14 µm for an increase from f = 0 Hz (γ = ∞) to f = 1.5 Hz (γ = 100), then drop sharply from 15 µm to 5 µm as f increases from 1.5 Hz to 50 Hz (γ = 4.6).
When the strain is kept constant, the average chain stretch and the depletion layer thickness increases with the effective shear rate and oscillatory frequency until they reach plateau values at high frequencies. At low strain, both chain stretch and migration are weakly dependent on the shear rate and oscillatory frequency. For both γ=15 and 100, the stretch of a given chain is found to depend on the position of the chain in the channel cross section, with the most stretched chains found at the border of the depletion zone and approximately 50% more extended than chains near the channel center. Recent experiments [30] using stained T2-DNA (L=71 µm) undergoing oscillatory shear flow at 150 s−1 in 40 µm × 40 µm microchannels have found that the depletion layer thickness remains roughly constant around 9 to 11 µm for f < 1 Hz and strongly decreases at higher f.
In our simulations, there are several physical limitations due to the coarse-grained chain model. The most important of these are: (i) Phenomena with characteristic time shorter than the bead diffusion time (~ 0.004 s) are not captured by the model, thus placing an upper limit on the frequency at f ≈250 Hz. (ii) Chain conformational changes within one bead radius of the walls are not accurately captured because each bead represents approximately 20 ideal random walk Kuhn segments. Therefore our simulations are most accurate in the regime where H > Rg. Within these constraints, we performed Brownian dynamics simulations to show how oscillatory flow may be used to control the chain conformation, the center-of-mass distribution, and the chain stretch distribution in the channel cross section in fully developed flow. Our findings are qualitatively consistent with the experimental measurements of DNA depletion layer formation in microfluidic flow and motivate more comparisons in the near future.
ACKNOWLEDGMENTS
We gratefully acknowledge support from NIH Grant NHIGRI 5T32HG002760 and NSF-NSEC DMR-0425880. The authors would like thank E. Dimalanta, R. Jendrejack, and H. Ma for many useful discussions.
Contributor Information
Y.-L. Chen, Department of Chemical and Biological Engineering, University of Wisconsin-Madison, Madison, WI 53703
M.D. Graham, Department of Chemical and Biological Engineering, University of Wisconsin-Madison, Madison, WI 53703
J.J. de Pablo, Department of Chemical and Biological Engineering, University of Wisconsin-Madison, Madison, WI 53703
K. Jo, Laboratory for Molecular and Computational Genomics, Department of Chemistry and Laboratory of Genetics, University of Wisconsin-Madison, Madison, WI 53703
D.C. Schwartz, Laboratory for Molecular and Computational Genomics, Department of Chemistry and Laboratory of Genetics, University of Wisconsin-Madison, Madison, WI 53703
References
- 1.Odom TW, Thalladi VR, Love JC, Whitesides GM. J. Am. Chem. Soc. 2002;124:12112. doi: 10.1021/ja0209464. [DOI] [PubMed] [Google Scholar]
- 2.Whitesides GM, Ostuni E, Takayam S, Jiang Z, Ingber DE. Annu. Rev. Biomed. Eng. 2001;3:335. doi: 10.1146/annurev.bioeng.3.1.335. [DOI] [PubMed] [Google Scholar]
- 3.Austin RH, Tegeneldt JO, Cao H, Chou SY, Cox EC. IEEE Trans. Nanotech. 2002;1:12. [Google Scholar]
- 4.Bakajin OB, Duke TAJ, Chou CF, Chan SS, Austin RH, Cox EC. Phys. Rev. Lett. 1998;80:2739. [Google Scholar]
- 5.Burns MA, Johnson BN, Brahmasandra SN, Dandique K, Webster JR, Krishnan M, Sammarco TS, Man PM, Jones D, Heldsinger D, et al. Science. 1998;282:484. doi: 10.1126/science.282.5388.484. [DOI] [PubMed] [Google Scholar]
- 6.Jacobson SC, Ramsey JM. Anal. Chem. 1996;68:720. doi: 10.1021/ac951230c. [DOI] [PubMed] [Google Scholar]
- 7.Krishnan M, Namasivayam V, Lin R, Pal R, Burns MA. Curr. Opin. in Biotech. 2001;12:92. doi: 10.1016/s0958-1669(00)00166-x. [DOI] [PubMed] [Google Scholar]
- 8.Marziali A, Akeson M. Annu. Rev. Biomed. Eng. 2001;3:195. doi: 10.1146/annurev.bioeng.3.1.195. [DOI] [PubMed] [Google Scholar]
- 9.Tegeneldt JO, Prinz C, Cao H, Huang RL, Austin RH, Chou SY, Cox EC, Sturm JC. Anal. Bioanal. Chem. 2004;378:1678. doi: 10.1007/s00216-004-2526-0. [DOI] [PubMed] [Google Scholar]
- 10.Randall GC, Doyle PS. Phys. Rev. Lett. 2004;93:058102. doi: 10.1103/PhysRevLett.93.058102. [DOI] [PubMed] [Google Scholar]
- 11.Shrewsbury PJ, Muller SJ, Liepmann D. 1st Ann. Inter. IEEE-EMBS Special Topic Conference on Microtechnologies in Medicine & Biology; 2001. p. 1. [Google Scholar]
- 12.Stone HA, Stroock AD, Ajdari A. Annu. Rev. Fluid Mech. 2004;26:381. [Google Scholar]
- 13.Brochard F, de Gennes PG. J. Chem. Phys. 1977;67:52. [Google Scholar]
- 14.Daoud M, deGennes PG. J. Phys. (Paris) 1977;38:85. [Google Scholar]
- 15.deGennes PG. Scaling Concepts in Polymer Physics. Ithaca: Cornell University Press; 1979. [Google Scholar]
- 16.Hsu H-P, Grassberger P. J. Chem. Phys. 2004;120:2034. doi: 10.1063/1.1636454. [DOI] [PubMed] [Google Scholar]
- 17.Chopra M, Larson RG. J. Rheol. 2002;46:831. [Google Scholar]
- 18.Hsieh CC, Larson RG. J. Rheol. 2004;48:995. [Google Scholar]
- 19.Hsieh CC, Li L, Larson RG. J. Non-Newtonian Fluid. Mech. 2003;113:147. [Google Scholar]
- 20.Hur J, Shaqfeh ESG, Larson RG. J. Rheol. 2000;44:713. [Google Scholar]
- 21.Jendrejack RM, de Pablo JJ, Graham MD. J. Chem. Phys. 2002;116:7752. doi: 10.1063/1.1637331. [DOI] [PubMed] [Google Scholar]
- 22.Jendrejack RM, Dimalanta ET, Schwartz DC, Graham MD, de Pablo JJ. Phys. Rev. Lett. 2003;91:038102. doi: 10.1103/PhysRevLett.91.038102. [DOI] [PubMed] [Google Scholar]
- 23.Jendrejack RM, Schwartz DC, Graham MD, de Pablo JJ. J. Chem. Phys. 2003;119:1165. doi: 10.1063/1.1637331. [DOI] [PubMed] [Google Scholar]
- 24.Larson RG, Hu H, Smith DE, Chu S. J. Rheol. 1999;43:267. [Google Scholar]
- 25.Woo NJ, Shaqfeh ESG, Khomami B. Journal of Rheology. 2004;48:299. [Google Scholar]
- 26.Jendrejack RM, Schwartz DC, de Pablo JJ, Graham MD. J. Chem. Phys. 2004;120:2513. doi: 10.1063/1.1637331. [DOI] [PubMed] [Google Scholar]
- 27.Doi M, Edwards SF. Theory of Polymer Dynamics. Oxford: Oxford Press; 1986. [Google Scholar]
- 28.Yamakawa H, Fujii M. J. Chem. Phys. 1976;64:5222. [Google Scholar]
- 29.Agarwal US, Dutta A, Mashelkar RA. Chem. Eng. Sci. 1994;49:1693. [Google Scholar]
- 30.Jo K, Schwartz DC. 2004 p. in preparation. [Google Scholar]
- 31.Larson RG. J. Rheology. 2005;49:1. [Google Scholar]
- 32.Ma H, Graham MD. 2004 submitted. [Google Scholar]
- 33.Hudson SD. Phys. Fluids. 2003;15:1106. [Google Scholar]
- 34.Leal LG. Annu. Rev. Fluid Mech. 1980;12:435. [Google Scholar]
- 35.Smart JR, Leighton DT. Phys. Fluids. 1991;3:21. [Google Scholar]
- 36.Smith DE, Perkins TT, Chu S. Macromolecules. 1996;29:1372. [Google Scholar]
- 37.Chen Y-L, Graham MD, de Pablo JJ, Randall GC, Gupta M, Doyle PS. Phys. Rev. E. 2004;70:060901. doi: 10.1103/PhysRevE.70.060901. [DOI] [PubMed] [Google Scholar]
- 38.Pozrikidis C. Introduction to Theoretical and Computational Fluid Dynamics. New York: Oxford; 1997. [Google Scholar]
- 39.Smith DE, Perkins TT, Chu S. Phys. Rev. Lett. 1995;75:4146. doi: 10.1103/PhysRevLett.75.4146. [DOI] [PubMed] [Google Scholar]
- 40.Marko JF, Siggia ED. Macromolecules. 1994;28:8759. [Google Scholar]
- 41.Smith SB, Finzi L, Bustamante C. Science. 1992;258:1122. doi: 10.1126/science.1439819. [DOI] [PubMed] [Google Scholar]
- 42.Bird RB, Curtiss CF, Armstrong RC, Hassager O. Dynamics of Polymeric Liquids. vol. 2. New York: Wiley; 1987. [Google Scholar]
- 43.Rotne J, Prager S. J. Chem. Phys. 1969;50:4831. [Google Scholar]
- 44.Jendrejack RM, Graham MD, de Pablo JJ. J. Chem. Phys. 2000;113:2894. doi: 10.1063/1.1637331. [DOI] [PubMed] [Google Scholar]
- 45.Smith DE, Babcock HP, Chu S. Science. 1999;283:1724. doi: 10.1126/science.283.5408.1724. [DOI] [PubMed] [Google Scholar]
- 46.Doyle PS, Ladoux B, Viovy J-L. Phys. Rev. Lett. 2000;84:4769. doi: 10.1103/PhysRevLett.84.4769. [DOI] [PubMed] [Google Scholar]
- 47.The buffer solution is made of 10 mM Tris and 1 mM EDTA (pH 8.0) with 4% -mercaptoethanol. DNA was stained with YOYO with 6 to 1 ratio of DNA base pairs to YOYO molecules. DNA solution was diluted until tens of molecules are seen in the scope view.


