Abstract
An important goal of human genetics and genomics is to understand the complete spectrum of genetic variation across a specific human haplotype. By combining information from a dense SNP map with fosmid end-sequence pairs (ESPs) aligned to the human genome reference sequence, we have developed a simple method to resolve human haplotypes using a previously developed clone resource. By partitioning ESPs into either haplotype, we have generated a haplotype-specific clone map for eight diploid genomes (four Yoruba African and four non-African samples). On average, 59% of each haploid genome is covered by haplotype-assigned clones with an N50 length of 110 kbp. By comparing this clone-based haplotype map against HapMap phased data sets, we estimate an error rate of 0.71% when trio information is available and 6.6% in its absence. We present these data in the form of an interactive browser that allows clones corresponding to specific haplotypes to be recovered and sequenced within these eight human genomes. As an example, we sequenced 165 fosmid clone inserts to generate 6.8 Mbp of sequenced haplotypes, and demonstrate its utility in uncovering phase-switching errors and for the discovery of novel SNPs especially in Asian and African samples. We discuss the potential application of this resource in understanding the pattern of genetic variation in complex regions of the genome that may not be adequately resolved by next-generation sequencing technology or SNP haplotype imputation.
Next-generation high-throughput sequencing technologies promise to greatly accelerate the pace of genomics research (Mardis 2008). Coupled with methods of “genomic selection,” these technologies allow the acquisition of sequence from a targeted subset of the genome (Albert et al. 2007; Okou et al. 2007; Porreca et al. 2007). The information obtained from these methods, however, is a mixture of the two haplotypes represented in a given sample. Although statistical approaches and pedigree information allow for the imputation of phased haplotypes (Stephens et al. 2001; Stephens and Donnelly 2003), the acquisition of long, contiguous stretches of sequence derived from a single haplotype remains an important goal for human genetics research. Recently, an effort to systematically map and sequence structural variants using a fosmid-based clone-end approach was launched with the goal of resolving structurally variant haplotypes at the sequence level and ultimately incorporating alternative human haplotypes into a more comprehensive reference assembly (Eichler et al. 2007). These clone libraries were derived from diploid genomic DNA from individuals studied as part of the HapMap project (The International HapMap Consortium 2005). Here, by combining the mapping information associated with these clones with HapMap single nucleotide polymorphism (SNP) genotypes, we define a haplotype-specific physical clone map for these eight individuals (corresponding to 16 haploid genomes). As a result, we directly assign a subset of validated sites of structural variation onto defined haplotypes. This set of haplosorted fosmid clones permits the targeted acquisition of haplotype-specific sequence from any genomic interval and will serve as a resource for future studies using next-generation sequencing methods.
Results
Haplotype sorting using end-sequence pairs
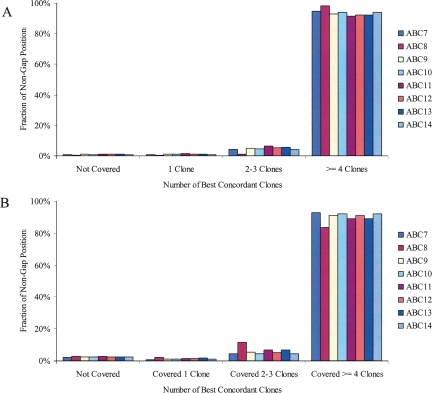
As part of an ongoing effort to identify and sequence sites of structural variation, fosmid libraries made from genomic DNA from eight individuals studied as part of the HapMap project have been created and end sequenced (Kidd et al. 2008). From each individual, a ∼10-fold physical coverage clone library consisting of ∼1 million clones was created. Based on the end-sequence pairs (ESPs), we have previously mapped the clones against the human genome reference assembly (NCBI build35, UCSC hg17) using a heuristic scoring system that favors concordant placements and considers alignment and end-sequence quality (Tuzun et al. 2005). By using the same methodology, we have mapped the fosmid ESPs onto the most recent genome assembly (NCBI build36, UCSC hg18) in order to make comparisons with other existing genome-wide data sets (HapMap, ENCODE). Across the eight individuals, over 99% of the euchromatic, autosomal genome was physically covered by uniquely placed clones with 93% physically covered by four or more clones (Fig. 1). These clones represent a mixture of the two haplotypes present in each diploid genome; however, assuming that each haplotype is equally likely to be cloned, when a region is covered by four clones, there is an 87.5% chance that each haplotype is represented by at least one clone. By using inferred SNP haplotypes obtained for these samples as part of the HapMap project, we assigned a significant subset of these clones to distinct haplotypes (The International HapMap Consortium 2007).
Figure 1.
Physical coverage for each library. The fraction of the non-gap positions covered by zero, one, two to three, and four or more concordant clones is shown for the autosomes (A) and chromosome X (B). The fraction is calculated based on the location of fosmid end-sequence pairs that mapped to a “best” location in the human genome (build36). All libraries were derived from female cell lines with the exception of ABC8 (NA18507).
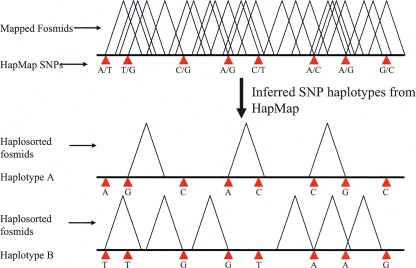
A SNP is informative for haplotype assignment if it is heterozygous in the individual being considered (Fig. 2). In order to make an assignment, we required that the SNP allele be represented in the fosmid end sequence and that it matched one of the two alleles reported in the HapMap data set (HapMap release 22, build36 coordinates). Additionally, if ESPs from a clone intersected with multiple HapMap SNPs, we required that the assigned phase be the same for each SNP (see below). Due to potential errors in the HapMap for the X chromosome, we limited our analysis to the autosomes. Across all eight libraries, 1,602,588 concordant clones were assigned to a specific haplotype. On average, 59% of each haploid genome was covered by haplotype-sorted clones (Table 1) with an average N50 coverage size of 110 kbp. In each individual, an average of 44% of the genome has both haplotypes spanned by an assigned clone, offering the potential of obtaining a truly haplotype resolved genome sequence from these samples through the targeted resequencing of individual clones. ABC8 (NA18507), the sole male sample, was constructed at a higher depth of coverage and has a haplotype-specific N50 size that is 38% greater than the other samples.
Figure 2.
Haplosorting fosmids based on phased HapMap SNP genotypes. Clones that intersect informative genotyped SNPs can be assigned to a distinct haplotype by comparing the allele represented in the clone end sequences with the corresponding phased SNP genotypes.
Table 1.
Physical coverage of concordant clones
The physical coverage of all clones, clones assigned to haplotype A, clones assigned to haplotype B, and regions covered by clones assigned to both haplotypes is given.
aValues are given in Mbp, percentages indicate the total coverage relative to the non-gap size of each assembled chromosome.
bN50 size is the size of the contiguous covered intervals such that 50% of the covered base pairs are in intervals of that size or greater.
HapMap phasing and imputation error rates
For each library, an average of 62,600 clones intersect with multiple informative SNPs.
Such clones offer the opportunity to independently assess the inferred phase assignments of the HapMap genotypes. Since each clone represents a fragment from a single DNA molecule, any clone containing SNP alleles assigned to different haplotypes suggests an error in the SNP genotyping, the inferred haplotype assignments, or the base called in the end-sequence read. To reduce bias caused by errors in the ESP traces, we restricted this analysis to positions with a phred quality of at least Q30 (giving an average of 41,900 informative clones per library) (Ewing and Green 1998).
Across all eight individuals, 2.17% of informative clones (0.71% if samples NA18956 and NA18555 are excluded; see below) showed evidence of discrepant phasing for the autosomes (Table 2) compared with HapMap. As a control for errors in the end sequences, we randomly selected 44 clones encompassing apparent phasing errors and resequenced their ends by capillary sequencing. Analysis of these sequence traces supported the fosmid end-sequence mapping classification for 80% (35/44) of the clones. Of the nine remaining clones, three did not have reads that spanned all of the informative SNP positions used in the initial assessment, and four represented cases where the original ESP trace was of high quality (Q30) but the resequence trace was not.
Table 2.
Fraction of clones inconsistent with inferred HapMap SNP haplotypes
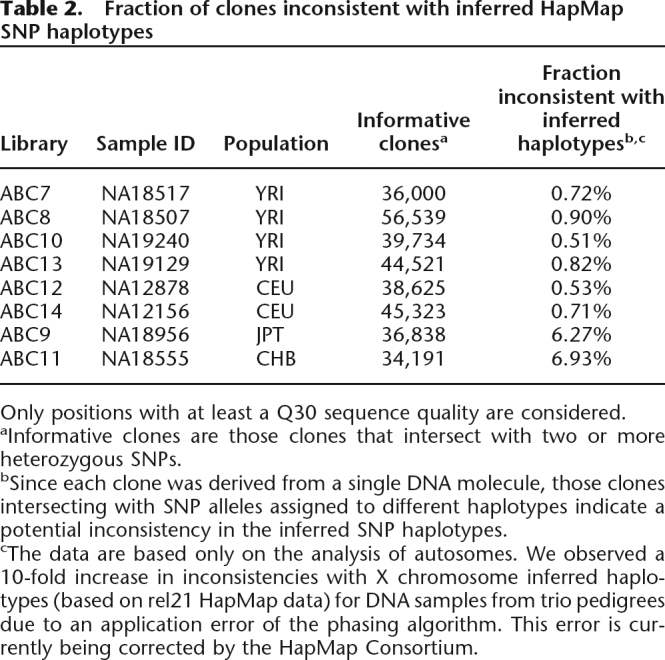
Only positions with at least a Q30 sequence quality are considered.
aInformative clones are those clones that intersect with two or more heterozygous SNPs.
bSince each clone was derived from a single DNA molecule, those clones intersecting with SNP alleles assigned to different haplotypes indicate a potential inconsistency in the inferred SNP haplotypes.
cThe data are based only on the analysis of autosomes. We observed a 10-fold increase in inconsistencies with X chromosome inferred haplotypes (based on rel21 HapMap data) for DNA samples from trio pedigrees due to an application error of the phasing algorithm. This error is currently being corrected by the HapMap Consortium.
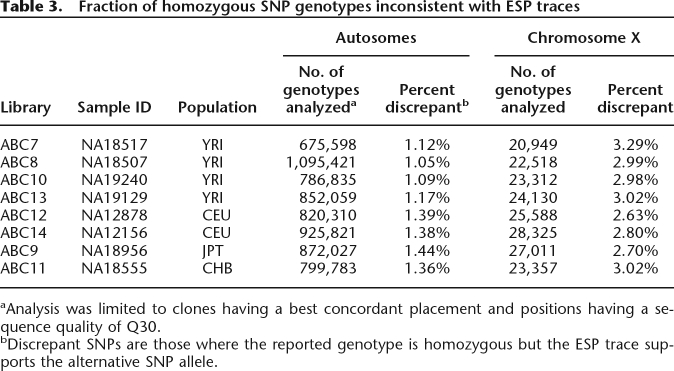
Inferred phase errors could represent a combination of errors in the phase assignment and errors in the HapMap genotypes. We conducted an assessment of HapMap SNP genotype error rates by comparing the ESPs against the reported HapMap diploid genotypes (rel22). We limited this analysis to clones with a concordant best placement and to positions having a quality of Q30 or better. For the autosomes, we found that an average of 1.25% of homozygous genotypes have a SNP derived from the ESP alignment that supports the alternative allele (Table 3). This error rate is in good agreement with previously reported under-calling estimates (The International HapMap Consortium 2007). However, we found that the corresponding error rate on the X chromosome is 2.91%, perhaps as a consequence of reduced sample size for the X chromosome or altered fluorescence clustering characteristics as a result of genotyping hemizygous male samples. This increased genotype error rate for the X chromosome will lead to an increased error rate in the inferred haplotypes.
Table 3.
Fraction of homozygous SNP genotypes inconsistent with ESP traces
aAnalysis was limited to clones having a best concordant placement and positions having a sequence quality of Q30.
bDiscrepant SNPs are those where the reported genotype is homozygous but the ESP trace supports the alternative SNP allele.
As part of the phasing process, missing genotypes are inferred (Stephens and Donnelly 2003; Marchini et al. 2006). High-quality fosmid ESPs intersect with 78,397 sites that have missing genotype data but were imputed to be homozygous (Table 4). The estimated error rate of these imputed genotypes (average of 2.8%) is twice as high as the genotyping error rate, with the four Yoruba samples having nearly as high of an error rate as the Japanese and Chinese samples. Mistakes in SNP genotype imputation explain a higher proportion of phase errors for trios. For the six samples that are part of a trio, 18% of the phase-switch clones (330/1857) intersect with at least one SNP whose genotype was imputed for the relevant sample, and 36% (677/1857) involve missing SNP genotypes for at least one member of the trio. In contrast, for NA18956 and NA18555, only 7.5% (349/4679) of phase-switch clones involve imputed SNP genotypes. When trio information is available, we find that 51% (940/1857) of phase-switch clones exclusively involve SNPs that were successfully genotyped in all members of the relevant trio and where the trio structure dictates the phase assignment (i.e., at least one member of the trio is homozygous). Thus, when trio information is available, roughly half of our estimated errors are likely the result of errors in either the SNP genotypes or in the ESP traces—a finding consistent with our observation that for trios genotype and phase error rates are of comparable magnitude (Tables 2, 3; Marchini et al. 2006).
Table 4.
Fraction of imputed homozygous genotypes inconsistent with ESP traces
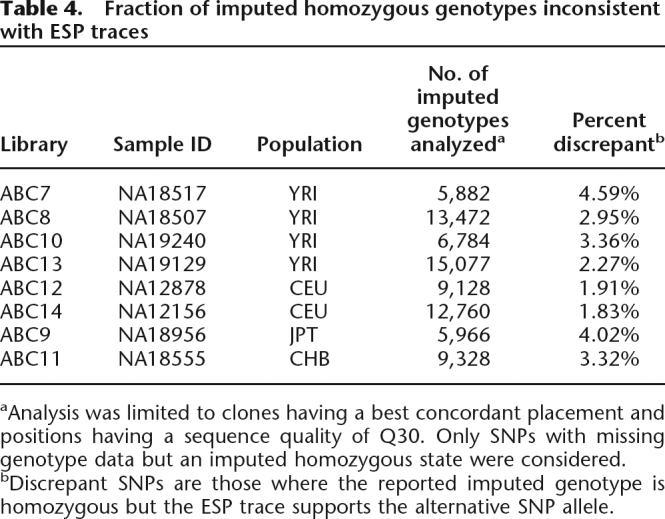
aAnalysis was limited to clones having a best concordant placement and positions having a sequence quality of Q30. Only SNPs with missing genotype data but an imputed homozygous state were considered.
bDiscrepant SNPs are those where the reported imputed genotype is homozygous but the ESP trace supports the alternative SNP allele.
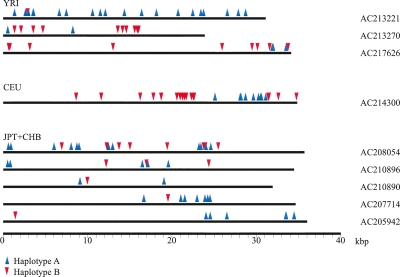
We further investigated potential phase errors by comparing the imputed SNP haplotypes with the insert sequence from 132 fosmids. Each of these fosmids map to the autosomes, do not harbor structural rearrangements (>5 kbp in size), and intersect with at least two informative SNPs. Nine of these clones (Fig. 3) contain SNP genotypes assigned to different haplotypes, providing an estimate of the phase-switch error rate (Lin et al. 2002) for each HapMap sample set of 1.57% for YRI, 0.36% for CEU, and 4.63% for JPT+CHB. Considering the genomic distance enclosed by heterozygous SNPs and the number of observed switches in the analyzed clones (Table 5), we estimate one phase-switch every 138 kbp in YRI, every 501 kbp in CEU, and every 52 kbp in the combined JPT+CHB samples.
Figure 3.
Phase-switching revealed by sequenced fosmid clones. HapMap SNP genotypes were mapped onto finished fosmid clones. Nine clones (as indicated) show patterns of inconsistent SNP phase assignments. The blue arrows correspond to SNPs assigned to haplotype A, and red arrows correspond to haplotype B. Since each clone represents a single chromosomal fragment, each sequence corresponds to a single haplotype.
Table 5.
Switch error rates estimated from fully sequenced clones
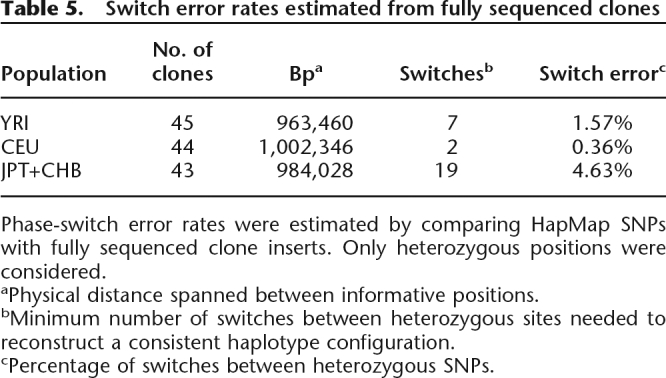
Phase-switch error rates were estimated by comparing HapMap SNPs with fully sequenced clone inserts. Only heterozygous positions were considered.
aPhysical distance spanned between informative positions.
bMinimum number of switches between heterozygous sites needed to reconstruct a consistent haplotype configuration.
cPercentage of switches between heterozygous SNPs.
Interactive browser
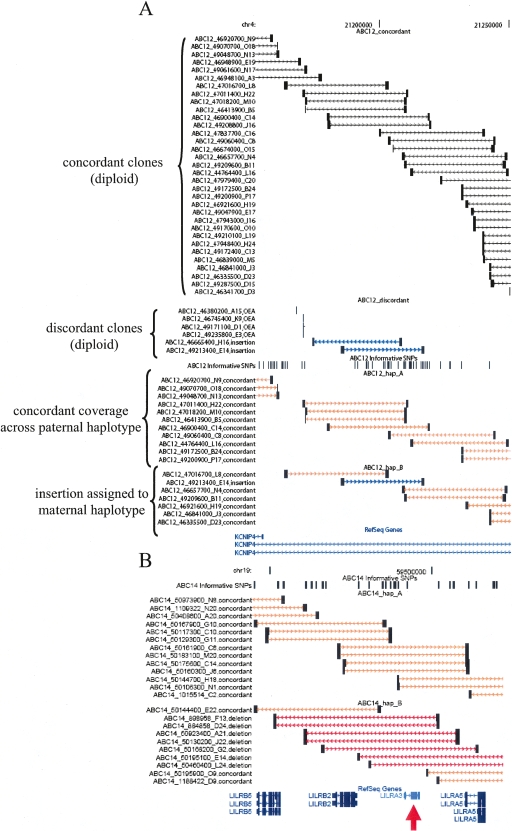
By using the UCSC genome browser model (Kent et al. 2002), we displayed all haplotype-sorted fosmids across the entire genome (http://hgsv.washington.edu/). The browser shows the precise map location and ID of each clone in the context of other standard genomic features (e.g., genes, STS, chromosome band position). In addition to the assignment of clones onto specific haplotypes, the browser also displays the placements of all clones from these libraries, including ESPs supporting structural variation (Fig. 4). The validation status for each of the identified structural variants is also indicated, and the complete sequence of a subset of clones selected for analysis, as well as annotated images of the variant haplotypes, is available. These depictions of sequenced clones represent a first step toward the integration of distinct haplotypes onto the existing genome assemblies. The browser also contains a clone-selection utility. This feature permits users to explore a region of interest and select individual clones. At the conclusion of the browsing session, the list of user-selected clones can be exported as a text file for further analysis or retrieval. Based on previous usage of these libraries to identify and sequence clones spanning sites, we estimate that ∼94% of the clones can be effectively recovered, with the earlier libraries having a substantially lower effective recovery rate because of clone tracking issues in the early stages of the development of this resource (∼86% for ABC7 and ABC8).
Figure 4.
Interactive browser of mapped fosmid clones. Screenshots from an interactive browser (http://hgsv.washington.edu) displaying mapping information for clones from eight fosmid libraries are depicted. (A) The complete concordant clone coverage (black bars) along with two putative insertion clones (blue bars) indicates that ABC12 is heterozygous for an insertion in an intron of the KCNIP4 gene. The presence of four, mapped one-end anchored clones suggests that the insertion may involve sequence not represented elsewhere in the genome assembly. Haplotype sorting of clones from this region indicates that the insertion allele is on the maternal haplotype (haplotype B). The names and classifications of all clones are given on the left side of the image. (B) A deletion impacting the LILRA3 gene is assigned to the nontransmitted haplotype of sample ABC14 (red arrow). A study of a German cohort suggests that deletions of this locus may be associated with risk of multiple sclerosis (Koch et al. 2005). The deletion is known to exist at a high frequency in Japanese populations where haplotypes from this locus form two distinct clades (Hirayasu et al. 2006). The ability to obtain contiguous sequence from haplotypes carrying the deletion and insertion configuration may clarify the role of this locus in human evolution and disease.
Discussion
The most important application of this resource is the ability to sequence a specific haplotype known to carry some variant of interest and to comprehensively capture all variation within that chromosomal region. It is iterative in the sense that once a haplotype is completely sequenced from a clone from a specific individual, additional clones can be recovered based on a reassessment of the end-sequence data. By comparing with the HapMap data, we have shown that this resource provides a robust orthogonal approach to estimate genotyping and phasing errors. Our results suggest that data derived from samples where parental DNA has not been analyzed (i.e., Japanese and Chinese HapMap samples) will be enriched in a variety of systematic errors. Complete sequencing of 165 fosmid clone inserts also provides a direct assessment of the fraction of single-nucleotide variation awaiting discovery especially in Asian and African samples (Table 6). In addition to quality control and discovery, the clone-based haplotype resource we developed has several additional applications to the genomics and sequencing community as discussed below.
Table 6.
Sequence variants identified using fosmid clones
Single-nucleotide differences between sequenced clones and the human genome reference sequence were compared. Identified variants were then compared with existing databases.
Completing ENCODE
Linking haplotype and clone information also provides an opportunity to complete gaps within the ENCODE resequencing project and provides the ability to optimize selection for the most diverse haplotypes. As part of the HapMap and ENCODE projects, for example, 10 genomic regions were resequenced using a directed, PCR-based strategy (The International HapMap Consortium 2005; The ENCODE Project Consortium 2007). Based on the coverage information reported in the UCSC genome browser, 8.5% of the targeted regions were not successfully sequenced in any of the attempted samples. Of these intervals, there are 960 regions that are 100 bp or longer (corresponding to 265 kbp, 5.3% of the total base-pairs targeted by ENCODE). All of these regions are completely covered by clones in at least three of the 16 haplotypes we analyzed, and 868 of these regions (corresponding to a total of 241 kbp) are completely covered in at least eight of the 16 available haplotypes. By limiting the comparison to the 10 haplotypes from the five samples that have a fosmid library and were also part of the ENCODE resequencing project, we find that 80/960 regions (corresponding to 24.5 kbp) are spanned by clones from all 10 haplotypes and that 849/960 regions are completely covered by clones from at least five of the 10 haplotypes (corresponding to 236 kbp). By use of this resource, it is therefore possible to obtain a more complete map of sequence variation present in the ENCODE regions, at least for this subset of eight individuals as well as future HapMap/ENCODE samples currently under construction (http://www.genome.gov/SVP/).
Characterizing structurally variant haplotypes
We recently identified 1695 regions of structural variation (insertions, deletions, and inversions) using a clone-based analysis of nine individuals (the eight HapMap individuals described here plus individual NA15510) (Tuzun et al. 2005; Kidd et al. 2008). All of these regions are currently being sequenced in their entirety to resolve the sequence structure of deletions, inversions, as well as novel insertion sequences that are not represented as part of the current reference assembly. In addition, complete sequence data provides an opportunity to integrate genetic variation at all levels. By intersecting these data with the haplosorted clone map, 56% (900/1,603 autosomal sites including 473/714 deletions, 409/696 insertions, and 18/193 inversions) of the previously identified structural variants mapping to the autosomes can be directly assigned to a specific haplotype. These assignments integrate structural and single-nucleotide variants and can be used to identify potentially recurrent variants. For example, high-quality sequence resolution of seemingly identical structural variants mapping to different SNP haplotype backgrounds can now be generated to determine at the base pair level if the events are identical by descent or independent events.
Assessing unusual patterns of sequence variation
This resource can facilitate the targeted resequencing of any region suspected to play an important role in human variation. To illustrate this approach, we examined 165 sequenced clones to determine the number of SNPs found in comparison to the reference assembly (Table 6). Of the differences found, 8%–20% represent variant positions not reported in dbSNP (build129). The higher rate of SNP discovery in the Yoruba, Japanese, and Chinese samples suggests continuing ascertainment bias in existing SNP databases. Notably, the use of these fosmid clones not only discovered new variants but also unambiguously defined their relationships with each other on a single haplotype—a consideration that may be important in the use of haplotype-matching for sequence analysis in future disease-mapping studies (Spencer et al. 2006).
Of particular interest for further study are regions showing an unusual pattern of sequence diversity as they may represent sites of unusually high mutation rates or of deep coalescence times. Based on an analyses of the individual end-sequence reads, 25 regions (200–800 kbp in size) of unusually high sequence diversity were previously identified (Kidd et al. 2008). On average, these regions were 285 kbp in size. Four of these regions were completely spanned by clones from at least one of the 16 haplotypes and 13 of the 25 regions are at least 75% covered by haplosorted clones from at least four of the 16 examined haplotypes. Thus, a substantial fraction of these regions can be directly resequenced, with additional coverage requiring a clone pooling or iterative sequencing strategy.
In summary, by combining information from a dense SNP map with a 10-fold physical coverage fosmid library constructed from eight samples, we defined a haplotype-specific clone map covering an average of 59% of each haploid genome. Given the depth of the physical libraries, this coverage is largely limited by the availability of informative SNPs. Since the total number of uniquely placed clones greatly exceeds the number of haplosorted clones (Table 1), an iterative or pooled sequencing process using haplosorted clones as seeds may offer an efficient method for obtaining larger segments of haplotype-specific sequence from these individuals. This result illustrates the synergistic value of intensely studying a limited number of reference individuals using a variety of genomic platforms. As other projects (such as the recently announced 1000 Genomes Project, http://1000genomes.org/) proceed, the insights offered by combining information from disparate platforms will greatly expand our understanding of genomic variation. The human genome is now recognized as a patchwork of structurally variant haplotypes, and a complete understanding of genomic variation will require the integration of variants across multiple scales (from single basepair changes to larger structural alterations) into distinct variant haplotypes. New sequencing technologies with vastly lower cost and higher throughput offer the opportunity to obtain the large quantities of sequence required. Combining these new approaches with physical, clone-based maps provides the opportunity to obtain a more complete picture of genomic structure than is otherwise available.
Methods
HapMap Phase II genotypes and phased haplotypes (release 22, based on NCBI genome build36) were obtained from http://www.hapmap.org. The HapMap haplotype naming convention was followed: For parents of trios, the transmitted haplotype is haplotype A and the untransmitted haplotype is haplotype B; for children, the paternally derived haplotype is haplotype A and the maternal haplotype is haplotype B; and and for unrelated individuals, the naming is arbitrary. “Best” fosmid clone placements were determined using a previously described 13-point scoring system that considers alignment length, identity, and quality while favoring concordant over discordant placements (Tuzun et al. 2005). Only reads matching one of the two genotyped alleles reported at informative positions (without regard to sequence quality in the ESP trace) were considered. When possible, both concordant and discordant (deletion, insertion, and inversion) clones were uniquely assigned to a haplotype. In order to reduce coverage inflation and errors caused by paralogous alignments, the coverage estimates and error analysis was limited to only best placed concordant clones. Concordant clones are those clones where the distance between the mapped positions of the paired end sequences is within 3 SD of the library mean with the end sequences placing in an inwardly pointing orientation. The analysis of phase and SNP genotype errors utilized a restricted subset of clones where only high-quality bases (≥Q30) were considered.
Switch error rates were determined by examining 132 sequenced fosmids (Supplemental Table S1) that map to the autosomes, do not harbor structural rearrangements, and intersect with at least two informative SNPs. Genotypes were determined by mapping HapMap SNP positions onto the sequenced clones using BLAT (Kent 2002). Switch error rates were calculated by summing the minimum number of switches between neighboring heterozygous sites needed to construct a consistent haplotype and the total number of heterozygous sites across all clones for a given sample set (Lin et al. 2002). Sequence differences relative to the assembly were determined for 165 completely sequenced fosmid clones from the autosomes (Supplemental Table S2). Single-nucleotide differences were detected using a global alignment constructed between the fosmid sequence and the corresponding fragment from the assembly using ALIGN (Myers and Miller 1988). We omitted clones that harbored structural rearrangements or showed reduced identity over regions of segmental duplication. In order to limit miscalls caused by alignment uncertainty, only differences flanked on each side by two matching alignment columns were considered.
Coverage coordinates from the ENCODE resequencing project were obtained from http://genome.ucsc.edu. Regions of unusual SNP density and validated sites of structural variation mapping to the autosomes were obtained from Kidd et al. (2008). Interval coordinates were transferred between genome assemblies using LiftOver as needed (http://genome.ucsc.edu/cgi-bin/hgLiftOver). Individual clone end-sequence traces are available in the NCBI trace repository (http://www.ncbi.nlm.nih.gov/Traces/trace.cgi?). Clone positions, end-sequence alignments, and an interactive map of clones are available at http://hgsv.washington.edu.
Acknowledgments
We thank Maika Malig, Karen Phelps, the University of Washington Genome Center, and the Washington University Sequence Center for technical assistance. We also thank Tomas Marques-Bonet, Tonia Brown, and three reviewers for comments on this manuscript. J.M.K. is supported by a NSF Graduate Research Fellowship. This work was supported by NIH grant HG004120 to E.E.E. E.E.E. is an investigator of the Howard Hughes Medical Institute.
Footnotes
[Supplemental material is available online at www.genome.org.]
Article published online before print. Article and publication date are at http://www.genome.org/cgi/doi/10.1101/gr.081786.108.
References
- Albert T.J., Molla M.N., Muzny D.M., Nazareth L., Wheeler D., Song X., Richmond T.A., Middle C.M., Rodesch M.J., Packard C.J., et al. Direct selection of human genomic loci by microarray hybridization. Nat. Methods. 2007;4:903–905. doi: 10.1038/nmeth1111. [DOI] [PubMed] [Google Scholar]
- Eichler E.E., Nickerson D.A., Altshuler D., Bowcock A.M., Brooks L.D., Carter N.P., Church D.M., Felsenfeld A., Guyer M., Lee C., et al. Completing the map of human genetic variation. Nature. 2007;447:161–165. doi: 10.1038/447161a. [DOI] [PMC free article] [PubMed] [Google Scholar]
- The ENCODE Project Consortium Identification and analysis of functional elements in 1% of the human genome by the ENCODE pilot project. Nature. 2007;447:799–816. doi: 10.1038/nature05874. [DOI] [PMC free article] [PubMed] [Google Scholar]
- Ewing B., Green P. Base-calling of automated sequencer traces using phred. II. Error probabilities. Genome Res. 1998;8:186–194. [PubMed] [Google Scholar]
- Hirayasu K., Ohashi J., Kashiwase K., Takanashi M., Satake M., Tokunaga K., Yabe T. Long-term persistence of both functional and non-functional alleles at the leukocyte immunoglobulin-like receptor A3 (LILRA3) locus suggests balancing selection. Hum. Genet. 2006;119:436–443. doi: 10.1007/s00439-006-0152-y. [DOI] [PubMed] [Google Scholar]
- The International HapMap Consortium A haplotype map of the human genome. Nature. 2005;437:1299–1320. doi: 10.1038/nature04226. [DOI] [PMC free article] [PubMed] [Google Scholar]
- The International HapMap Consortium A second generation human haplotype map of over 3.1 million SNPs. Nature. 2007;449:851–861. doi: 10.1038/nature06258. [DOI] [PMC free article] [PubMed] [Google Scholar]
- Kent W.J. BLAT—The BLAST-like alignment tool. Genome Res. 2002;12:656–664. doi: 10.1101/gr.229202. [DOI] [PMC free article] [PubMed] [Google Scholar]
- Kent W.J., Sugnet C.W., Furey T.S., Roskin K.M., Pringle T.H., Zahler A.M., Haussler D. The human genome browser at UCSC. Genome Res. 2002;12:996–1006. doi: 10.1101/gr.229102. [DOI] [PMC free article] [PubMed] [Google Scholar]
- Kidd J.M., Cooper G.M., Donahue W.F., Hayden H.S., Sampas N., Graves T., Hansen N., Teague B., Alkan C., Antonacci F., et al. Mapping and sequencing of structural variation from eight human genomes. Nature. 2008;453:56–64. doi: 10.1038/nature06862. [DOI] [PMC free article] [PubMed] [Google Scholar]
- Koch S., Goedde R., Nigmatova V., Epplen J.T., Muller N., de Seze J., Vermersch P., Momot T., Schmidt R.E., Witte T. Association of multiple sclerosis with ILT6 deficiency. Genes Immun. 2005;6:445–447. doi: 10.1038/sj.gene.6364187. [DOI] [PubMed] [Google Scholar]
- Lin S., Cutler D.J., Zwick M.E., Chakravarti A. Haplotype inference in random population samples. Am. J. Hum. Genet. 2002;71:1129–1137. doi: 10.1086/344347. [DOI] [PMC free article] [PubMed] [Google Scholar]
- Marchini J., Cutler D., Patterson N., Stephens M., Eskin E., Halperin E., Lin S., Qin Z.S., Munro H.M., Abecasis G.R., et al. A comparison of phasing algorithms for trios and unrelated individuals. Am. J. Hum. Genet. 2006;78:437–450. doi: 10.1086/500808. [DOI] [PMC free article] [PubMed] [Google Scholar]
- Mardis E.R. The impact of next-generation sequencing technology on genetics. Trends Genet. 2008;24:133–141. doi: 10.1016/j.tig.2007.12.007. [DOI] [PubMed] [Google Scholar]
- Myers E.W., Miller W. Optimal alignments in linear space. Comput. Appl. Biosci. 1988;4:11–17. doi: 10.1093/bioinformatics/4.1.11. [DOI] [PubMed] [Google Scholar]
- Okou D.T., Steinberg K.M., Middle C., Cutler D.J., Albert T.J., Zwick M.E. Microarray-based genomic selection for high-throughput resequencing. Nat. Methods. 2007;4:907–909. doi: 10.1038/nmeth1109. [DOI] [PubMed] [Google Scholar]
- Porreca G.J., Zhang K., Li J.B., Xie B., Austin D., Vassallo S.L., LeProust E.M., Peck B.J., Emig C.J., Dahl F., et al. Multiplex amplification of large sets of human exons. Nat. Methods. 2007;4:931–936. doi: 10.1038/nmeth1110. [DOI] [PubMed] [Google Scholar]
- Spencer D.H., Bubb K.L., Olson M.V. Detecting disease-causing mutations in the human genome by haplotype matching. Am. J. Hum. Genet. 2006;79:958–964. doi: 10.1086/508757. [DOI] [PMC free article] [PubMed] [Google Scholar]
- Stephens M., Donnelly P. A comparison of Bayesian methods for haplotype reconstruction from population genotype data. Am. J. Hum. Genet. 2003;73:1162–1169. doi: 10.1086/379378. [DOI] [PMC free article] [PubMed] [Google Scholar]
- Stephens M., Smith N.J., Donnelly P. A new statistical method for haplotype reconstruction from population data. Am. J. Hum. Genet. 2001;68:978–989. doi: 10.1086/319501. [DOI] [PMC free article] [PubMed] [Google Scholar]
- Tuzun E., Sharp A.J., Bailey J.A., Kaul R., Morrison V.A., Pertz L.M., Haugen E., Hayden H., Albertson D., Pinkel D., et al. Fine-scale structural variation of the human genome. Nat. Genet. 2005;37:727–732. doi: 10.1038/ng1562. [DOI] [PubMed] [Google Scholar]


