

Abstract
The yeast synthetic lethal genetic interaction network contains rich information about underlying pathways and protein complexes as well as new genetic interactions yet to be discovered. We have developed a graph diffusion kernel as a unified framework for inferring complex/pathway membership analogous to “friends” and genetic interactions analogous to “enemies” from the genetic interaction network. When applied to the Saccharomyces cerevisiae synthetic lethal genetic interaction network, we can achieve a precision around 50% with 20% to 50% recall in the genome-wide prediction of new genetic interactions, supported by experimental validation. The kernels show significant improvement over previous best methods for predicting genetic interactions and protein co-complex membership from genetic interaction data.
Genetics establishes links between genotype and phenotype. Many genes are pleiotropic, carrying out multiple functions in different pathways under different environmental conditions and can have partially redundant function with other genes. Genetic buffering can be evolutionarily stable (Nowak et al. 1997). While individual gene perturbations may have little or no effect, combined perturbations can generate a phenotype. This is the rationale of genetic interaction screens, which test for phenotypes from two-gene perturbations that differ from the single-gene effects. Pairwise genetic interaction screens have been valuable in understanding functional relationships between genes and assigning functions to genes in a pathway-dependent manner.
With the completion of the Yeast Knockout deletion collection (Giaever et al. 2002), high-throughput studies of pairwise lethal or growth defect interactions between null or hypomorph alleles of Saccharomyces cerevisiae (budding yeast) have made vast progress in the past few years. “Synthetic growth defect” or “synthetic sickness” describes a genetic interaction between two genes whose individual deletion mutants have minimal growth defects, while the double knockout results in a significant growth defect under a given condition. A subset of those pairs whose double knockouts lead to diminished growth or death are called “synthetic lethal” (Dobzhansky 1946). We will refer to the union of “synthetic sickness” and “synthetic lethal” as a “synthetic fitness or lethal interaction,” or SFL. Multiple studies have screened a subset of deletions or hypomorph alleles against the entire set of viable yeast deletion mutants using methods including synthetic genetic array (SGA) (Tong et al. 2001, 2004), synthetic lethality analyzed by microarray (SLAM), and diploid-based SLAM (dSLAM) (Ooi et al. 2003; Pan et al. 2004, 2006). A second approach, termed an epistatic miniarray profile, searches for both positive and negative interactions among a subset of genes (Collins et al. 2007).
Large-scale yeast genetic interaction networks have proved a valuable resource for understanding gene function and protein complex or pathway organization (Kelley and Ideker 2005; Schuldiner et al. 2005; Ye et al. 2005a, b; Pan et al. 2006; Collins et al. 2007; Ulitsky and Shamir 2007). SFLs tend to connect genes with related, but not identical, functional associations. Instead, components with identical pathway or complex membership tend to have similar genetic interaction partners. These properties of the yeast genetic interaction network have been exploited to predict function and pathway membership for uncharacterized genes (Tong et al. 2004), dissect large protein complexes into functional modules (Collins et al. 2007), and understand organizations of essential pathways (Schuldiner et al. 2005; Pan et al. 2006). To achieve these goals, especially prediction of pathway membership, algorithms have progressed from counting the number of shared neighbors of a gene pair (Tong et al. 2004) to calculating a hypergeometric P-value that corrects for the vertex degrees of the pair (Ye et al. 2005a) and grouping genes into pathways by iteratively finding an interaction motif that maximizes the likelihood of observed data (Qi et al. 2005). These methods have achieved success in analyzing the accruing genetic interaction data sets.
Most analysis of the genetic interaction network has focused on pathway inference; predicting genetic interactions from genetic interactions has received less attention. Previous methods with good performance have required additional input of physical interactions (Kelley and Ideker 2005), which limits predictions for genes whose proteins’ interactions have not been mapped. Improved analysis methods for genetic interactions should also boost performance when integrated with physical interactions and other functional association data (Ulitsky and Shamir 2007; Bandyopadhyay et al. 2008; Ulitsky et al. 2008).
The motivation here is to extract more information from SFL networks, quantified by the number of high-confidence SFLs and pathway/complex memberships that can be predicted. Previous analysis methods for SFL networks have had two main limitations. First, inference was based primarily on shared first neighbors; gene pairs separated by three or more interactions are ignored. Second, most predictions have focused on functional similarities between genes and concordance with protein interactions, rather than the complementary problem of direct prediction of SFLs. The goal of this study is to introduce a method that systematically explores neighborhoods of all distances, and is able to predict both friend-type interactions—genes that are likely to share pathway or complex membership—and enemy-type interactions—genes that are likely to have a direct SFL interaction.
A schematic illustrating our approach is provided (Fig. 1A). Using a social network analogy, {A,B,C} and {D,E,F} correspond to two social groups that dislike each other. In this purely bipartite example, edges always cross between groups. Between-group enemies are connected by only odd-length paths; within-group friends are connected by only even-length paths, as in the aphorism “The enemy of my enemy is my friend” describing length-2 paths. In this example, A and D are connected by one direct link, one length-3 path and two length-5 paths, whereas A and B are connected by only even-length paths. While the SFL network is not purely bipartite, locally bipartite motifs are strongly enriched in the SFL network (Ye et al. 2005b). Previously identified examples include the DNA damage/repair pathway (Fig. 1B) and genes involved in the cell cortex (Fig. 1C; Kelley and Ideker 2005; Pan et al. 2006).
Figure 1.

The parallel pathway model in the synthetic genetic interaction network. (A) A synthetic genetic interaction network is analogous to a social network of enemies. The two branches represent genes in parallel pathways, analogous to people in competing social groups. Nodes within the same branch are friends (or members of the same pathway), while nodes in different branches are enemies (or genes with a synthetic lethal genetic interaction). (B) The functionally overlapping DNA damage checkpoint genes and DNA repair checkpoint genes have enriched between-pathway SFL interactions (Pan et al. 2006). (C) Two groups of cell cortex genes have enriched between-pathway SFL interactions (Kelley and Ideker 2005).
Graph diffusion kernels generalize this idea by counting paths of all lengths between all pairs of vertices in a graph, and adding these path counts to give kernel values for all vertex pairs. Kernels themselves are symmetric, positive semi-definite functions formally equivalent to inner products for input objects mapped to a feature space. Different diffusion kernels correspond to different ways of weighting short paths versus long paths in the sum, and different ways of weighting genes based on their numbers of interaction partners. The term “diffusion” is used because the paths correspond to diffusion of random walkers outward from a source vertex (Fig. 2). Algorithms based on graph diffusion kernels have been used to analyze friendship networks, where edges represent similarity or affinity. It is the basis of the original Google PageRank algorithm (Brin and Page 1998). In biology, diffusion-based methods have been used to propagate gene annotations across a graph of protein physical interactions (Nabieva et al. 2005), improve remote homology detection for proteins (Weston et al. 2004; Kuang et al. 2005), and define functional distances between protein domains (Lerman and Shakhnovich 2007). Diffusion kernels are important base algorithms for statistical learning methods, especially support vector machines, and have been used for protein function prediction and gene annotation (Tsuda and Noble 2004; Ward et al. 2004).
Figure 2.

Diffusion of a hypothetical fluid on a graph. (A) Diffusion with source and sink. Fluid is pumped from the source into a selected set of query nodes and is allowed to leak out from each node into a sink at first-order rate γ. For clarity, an undirected network is shown. (B) Diffusion between two nodes in a directed network. Fluid diffuses in both directions according to the two edge weights between nodes i and j. A directed network is shown for generality.
While some of these examples incorporate the idea of edge weights or connection strengths, edges are always considered to represent affinity or similarity. The work described here provides a natural and novel extension to edges that represent dislike and are largely orthogonal to the affinity edges mentioned above.
The success of advanced graph-theoretic approaches for “friendship” biological networks motivated us to develop graph diffusion kernels for analyzing the SFL network. These methods capture the unique property of the SFL network being an “enemy network” by classifying network paths by parity of the path length, which provide a unified framework for inference of “enemies” or SFL interactions and “friends” or co-complex membership. The odd- and even-parity kernels quantify the association by odd- and even-length paths, respectively, while accounting for the degrees of all nodes on the paths. The odd-parity kernel is a powerful predictor of new SFL interactions, with a precision of 45% when about 3100 interactions (recall = 24%) are correctly predicted. In a prospective experimental validation of the top 100 novel predictions for each of two genes, the odd-parity kernel achieved precisions of 50% with recall of 20%–50%. In predicting protein complex and pathway membership, we explore a family of graph diffusion kernels and show that the even-parity and full graph diffusion kernels achieve significant improvements over the current best algorithms. Finally, we show how the graph diffusion kernels can be integrated with other information sources for improved performance.
Results
Motivation and overview
Given a network in which vertices are genes and edges are synthetic fitness and lethality interactions (SFLs), a graph diffusion kernel sums weighted paths of all lengths between pairs of genes. In addition to a standard diffusion kernel, G, that counts all paths, we introduce two parity-aware diffusion kernels: G−, which counts odd-length paths, and G+, which counts even-length paths, defined in Equation 8. By counting only the odd-length paths, G− should discriminate between SFL and non-SFL pairs. Discrimination was confirmed by analyzing an SFL network extracted from BioGRID (Stark et al. 2006); for known SFL partners, cross-validation was used to suppress the contribution of their direct interaction to the kernel. Known SFL pairs have higher G− scores than non-SFL pairs (Supplemental Fig. 1A). Similarly, the even-length kernel G+ discriminates between co-complexed and non-co-complexed gene products (Supplemental Fig. 1B), with protein complex information taken from MIPS (Mewes et al. 2004).
This discrimination can be improved by optimizing the single adjustable parameter γ, which controls the relative contribution of small paths (large γ) to long paths (small γ). In a network in which every vertex has the same degree, the mean path length is γ−1. Cross-validation was used to optimize this single parameter based primarily on the optimal F-score along the Precision-Recall curve, a balanced measure of precision and recall; the area under the receiver operating characteristic curve was also calculated to investigate performance over the entire range of predictions (see Methods).
The results first present in silico performance evaluations by cross-validation for predicting new SFL interactions from SFL data, followed by in vivo experimental confirmation of novel predictions. Finally, the ability to predict co-complex membership from SFL kernels is assessed. Graph diffusion kernel results are compared with previous methods, including raw counts of paths of length 2 and 3 from elements of the square and cube of the adjacency matrix A and its degree-normalized form (Equation 7).
SFL prediction from SFL data
The source of SFL interactions was BioGRID version 2.0.27 (Stark et al. 2006), containing 18,492 raw interactions involving 2700 genes. After pruning singletons and removing duplicates, these were reduced to 13,022 nonredundant interactions involving 1817 genes. Cross-validated prediction of SFL interactions from these data is optimized with γ ≥ 32 for G−, γ = 1 for G, and γ ≥ 32 for G+ (Supplemental Fig. 2). The odd-parity kernel G− performs the best (Fig. 3). Performance for G− has attained a plateau for γ = 32, which indicates that only the shortest possible paths contribute to the kernel.
Figure 3.

Performance of predicting genetic interactions from BioGRID by three diffusion kernels and the raw counts of length-3 paths. The optimal diffusion parameters used are γ = 32 for G−, γ = 1 for G and γ = 32 for G+. The raw counts of length-3 paths is A3. The odd-parity diffusion kernel G− significantly outperforms all other methods. (A) Precision-recall curves. (B) Receiver operating characteristic curves.
This performance may be surprising because previous investigations concluded that counting length-3 paths was a poor predictor, with precision of only 5% at a threshold of eight length-3 paths and below 20% at a very stringent threshold of 36 paths (Kelley and Ideker 2005). Predictions based on the raw count of length-3 paths, A3, are also presented in Figure 3, and are, indeed, worse than G−. Part of the performance boost for G− is therefore due to the symmetric normalization, which down-weights paths that traverse high-degree vertices. If normalization precedes calculating length-3 paths, the performance is identical to the optimized odd-parity diffusion kernel (Supplemental Fig. 2). Although these results suggest that odd-length paths of length >3 can be ignored, this may be due to a bias in training data that densely maps interactions around functionally related genes used as queries in high-throughput studies. More detailed results (see “Experimental confirmation” below) demonstrate that performance for many genes is optimized by γ ≈ 1, which counts longer paths.
The Precision-Recall curve for G− drops from initial 100% precision down to roughly 45% precision, without degrading much further as recall increases to 30%–40% (Fig. 3A). The drop-off in precision is due to false positives between the 179 high-throughput queries and the remaining 1638 genes (Supplemental Fig. 4). Some of the high-ranked predictions scored as false positives may, in fact, be true SFL interactions missed by the high-throughput experimental screens; evidence for this possibility is provided by experimental validations described below.
For a comparison with previous methods, we reanalyzed a data set of 4812 SFL interactions involving 1434 genes (Kelley and Ideker 2005), with 3930 interactions remaining after pruning genes with a single SFL interaction. Optimal performance was obtained with G− at γ = 64 (Supplemental Fig. 5). As opposed to our method, based solely on SFL interactions, the previous method incorporated physical interactions to improve predictions. At precision = 87%, G− performs at least as well as the previous method, with 39 correct predictions compared to 37 previously (Supplemental Fig. 6).
Returning to performance on the current SFL network, on average, more than 620 SFL interactions out of ∼2600 are correctly predicted (Recall = 24%) in each cross-validation fold, and a total of 3100 SFLs are correctly predicted (Precision = 45%). The current genetic interaction network, although incomplete and doubtless including spurious interactions, already holds great potential for inference of missing SFL edges.
Experimental confirmation of top-ranked novel SFL predictions
We further validated the power of the G− kernel with a simultaneous experimental effort to identify genetic interactions for almost 40 genes involved in histone acetylation and deacetylation that had not previously been used in genome-wide screens in yeast (Lin et al. 2008). High-throughput screens used dSLAM (Pan et al. 2004), with SFL interactions confirmed using random spore analysis or tetrad dissection (Methods). The resulting genetic interaction network from this study contains 2718 SFL genetic interactions involving 763 genes regulating histone modifications, termed the HTS data. Nonessential HTS queries had 42 SFL interactions on average, and hypomorph alleles of essential genes averaged 188 interactions.
In a parallel computational effort, candidate SFL partners for 37 of these queries were predicted using G− calculated from the full BioGRID SFL data, which included 2050 nonessential and 650 essential genes. The motivation for this blinded comparison was to determine how the method performed in practice for genes that had not yet been extensively studied. For two of these queries, the knockout allele of ADA2 and a temperature-sensitive (Ts) allele of ESA1 (esa1-531), the top 100 predictions at γ = 1 (selected prior to the analysis of the optimal γ) were subjected to follow-up experiments to determine whether putative false positive predictions were really false negatives in the HTS data.
Ada2 is a transcriptional coactivator in histone acetylation and part of the ADA and SAGA complexes. Esa1 is the catalytic subunit of the NuA4 complex, the only essential histone acetyltransferase in yeast, which acetylates H2A, H4, and Htz1. The ADA2 gene has 10 known SFL interactions, and ESA1 has four known SFL interactions in the BioGRID training data. These interactions involve prior discovery of ADA2 and ESA1 only as target genes. The HTS data generated 75 new SFL partners for ADA2 and 210 for ESA1, which were compared with the top 100 predictions from G−, excluding the known BioGRID interactions.
For ADA2, 30 of the top 100 predictions were in the 75 HTS partners (40% recall). The maximum possible recall in this case is 84% (= 63/75) because 12 of the HTS partners have no BioGRID SFL interactions. The 70 putative false positives were tested experimentally by random spore analysis and tetrad dissection, identifying 18 as ADA2 partners missed by the high-throughput experiment. Counting these additional positives yields 48% precision and 52% recall (Table 1).
Table 1.
Summary of SFL partner prediction for ADA2
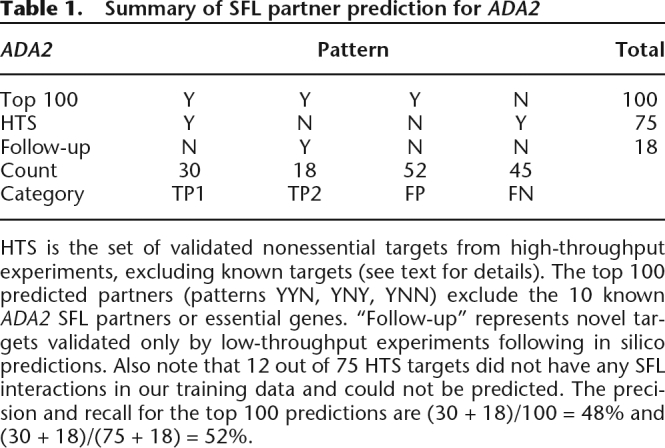
HTS is the set of validated nonessential targets from high-throughput experiments, excluding known targets (see text for details). The top 100 predicted partners (patterns YYN, YNY, YNN) exclude the 10 known ADA2 SFL partners or essential genes. “Follow-up” represents novel targets validated only by low-throughput experiments following in silico predictions. Also note that 12 out of 75 HTS targets did not have any SFL interactions in our training data and could not be predicted. The precision and recall for the top 100 predictions are (30 + 18)/100 = 48% and (30 + 18)/(75 + 18) = 52%.
In Figure 4, predicted and confirmed partners of ADA2 are organized according to known protein complexes (Mewes et al. 2004) and protein–protein interactions (Gavin et al. 2006; Krogan et al. 2006). Correctly predicted partners participate in histone acetylation (SAGA, NuA3, NuA4), deacetylation (Rpd3, Set3), and methylation (COMPASS). ADA2 also has extensive genetic interactions with the transcription machinery including SWI/SNF transcription activator, RNA polymerase II, the Mediator complex, and the Elongator complex. The SFL interactions between ADA2 and these target complexes are consistent with histone acetylation and deacetylation as a dynamic regulator of diverse biological processes including transcription, gene silencing, chromosome condensation, DNA replication, and DNA damage repair (Millar and Grunstein 2006).
Figure 4.

SFL targets of ADA2 were obtained by combining high-throughput screening results and predictions by the odd-parity kernel G−, validated by random spore analysis or tetrad dissection. (Confirmed) Experimentally tested positive. Protein–protein interactions are derived from the MIPS database and Krogan et al. (2006) and Gavin et al. (2006). The SFL targets of ADA2 are most enriched of histone and chromatin modification complexes and the mRNA transcription machinery.
The top 100 predictions for ESA1 overlapped with 34 from the HTS data (16% recall). Here the maximum possible recall is 48% because of the large number of partners in HTS. Additional known positives may be found further down the ranked list (Supplemental Data 1). Experimental tests of the 66 putative false positives in the top 100 revealed 20 as true interactions missed by HTS, yielding a true performance of 54% precision and 23% recall (Table 2). The knockouts of the interaction partners missed by HTS often exhibited slow growth on the haploid-selecting magic medium used by dSLAM, explaining their absence from the HTS data.
Table 2.
Summary of SFL partner prediction for ESA1
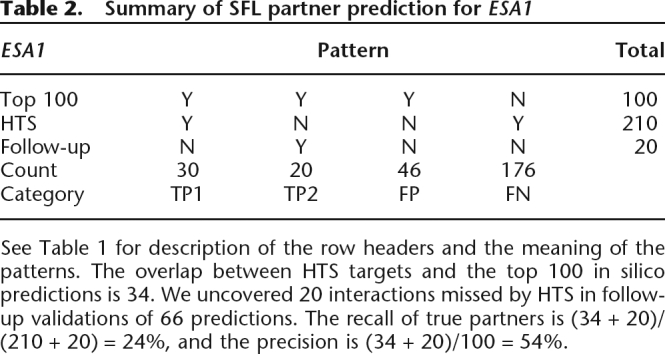
See Table 1 for description of the row headers and the meaning of the patterns. The overlap between HTS targets and the top 100 in silico predictions is 34. We uncovered 20 interactions missed by HTS in follow-up validations of 66 predictions. The recall of true partners is (34 + 20)/(210 + 20) = 24%, and the precision is (34 + 20)/100 = 54%.
The performance of G− for the top 100 predictions of all 37 queries, including ADA2 and ESA1, is heterogeneous (Fig. 5). Some, like ESA1, GCN5, and YNG2, have good precision but low recall. Others, like ELP2,4,6 and SOH1, have very high recall but low precision. And some, like HST1,4, perform poorly by both criteria. Much of the heterogeneity is explained by the number of new partners identified by HTS: More partners correlate with better precision and worse recall in the top 100. Toward the high end is GCN5, with 192 SFL targets in HTS, 28% precision (vs. 192/4700 nonessentials = 4% for a random predictor), and 16% recall. At the other extreme is ELP2, which has 11 SFL targets in HTS. By identifying five in the top 100 predictions, the recall was 46%. The precision of 5% is almost half the maximum possible of 11%, and a 20× improvement over random.
Figure 5.

Precision and recall for the top 100 SFL predictions for 37 query genes at γ = 1 by the G− kernel. Query genes are color coded according to the number of SFL partners from a recent screen (Lin et al. 2008).
Because it is important to know whether good predictions can be made for any specific query gene, we developed a quantitative multiple regression model to relate F-score performance to biological features of a gene and the local topology of the SFL and PPI networks. Sixteen features were entered into a linear model, and an exhaustive search using BIC identified six for a parsimonious model (Supplemental Data 2). The most significant factor was the number of new SFL interactions (num_SFL) discussed above. In order of decreasing significance, the other five factors are the average G− score of the top 100 predictions (score_ top100), the average clustering coefficient of known SFL partners in the SFL network (cc), the clustering coefficient of the query gene in the protein–protein interaction network determined by affinity purification and mass spectrometry (APMS_cc), the ORF size (orf_size), and the downstream conservation (downstream_conservation).
All significant features except the average clustering coefficient of the known SFL partners in the SFL network (cc) are positively correlated with performance (Supplemental Data 2; Supplemental Fig. 7). While the clustering coefficient is often a good measure of local density of interactions, it may not be a good measure for SFL networks because of the enrichment of bipartite motifs. Factors such as the codon adaptation index, number of protein–protein interaction partners, phyletic retention (Gustafson et al. 2006), and essentiality (Tong et al. 2004; Davierwala et al. 2005) were not retained in the model, possibly owing to correlations with retained factors. The adjusted R2 for the final model was 0.69. Excluding the number of new interactions, which would not be known before a screen, the adjusted R2 drops to 0.41, and the only significant factor retained is the average G− score of the top 100 predictions. These results indicate that the G− score is useful in predicting performance.
The sensitivity to the single parameter γ was characterized by calculating the F-score for each of the 37 queries over the range γ = 0.01 to 256. For an individual query, a broad range of γ values can give near-optimal results (Supplemental Fig. 8; complete data in Supplemental Data 3). Across different queries, however, there is wide dispersion of the optimal γ (Fig. 6; Supplemental Fig. 9). The genes for which the F-score is largest, including ADA2 and ESA1, have large optimal γ, similar to the BioGRID training data. Genes, whose partners are predicted less accurately, with optimal F-scores between 0.1 and 0.2, perform best with γ ≈ 1. Genes, whose partners are predicted the least accurately, favor γ < 1.
Figure 6.

Optimal γ parameters for predicting new SFL partners using G− are query-specific. Performance assessed by F-score is positively correlated with γ.
Prediction of protein complex co-membership and direct functional associations
We assessed the ability of kernels generated from only genetic interactions to predict direct functional associations (Fig. 7). Co-membership in a protein complex is a strong indicator of functional association. Using MIPS curated complexes, γ values were optimized for G (γ = 0.1), G+ (γ = 0.25), and G− (γ = 0.05) (Supplemental Fig. 10). Each of these kernels improves substantially over raw counts of length-2 paths and over the P-value for enrichment of length-2 paths, termed the “congruence score” (Ye et al. 2005a). As anticipated, the even-parity kernel, G+, performs better than the odd-parity kernel, G−. The overall best performance, however, is with the full kernel G. Note that all these kernels have small optimal γ values, leading to average path lengths of roughly four steps for G+ to 20 steps for G−. This blurs the distinction between the different kernels, and the disparity be different kernels, and the disparity between G+ and G− is much smaller than when SFL interactions were predicted.
Figure 7.

Performance of co-complex/pathway membership prediction by three diffusion kernels, congruence score, and the raw counts of length-2 paths. Complex data are obtained from the MIPS protein complex database (Mewes et al. 2004). The optimal diffusion parameters used are γ = 0.25 for G+, γ = 0.1 for G and γ = 0.05 for G−. (CS) Congruence score; (A2) raw counts of length-2 paths. (A) Precision-recall curves. (B) Receiver operating characteristic curves.
An alternative measure of functional association is the similarity of database annotations. Semantic similarity (Resnik 1995) was calculated for gene pairs based on Gene Ontology (GO) annotations. Larger kernel scores correspond to greater semantic similarity. Pairs ranked by diffusion kernels are more similar than pairs ranked by the congruence score (Fig. 8). For molecular function, G performs the best, with G− slightly better than G+. For biological process and cellular component, G and G+ provide similar performance, with G− slightly worse.
Figure 8.

Gene Ontology (GO) semantic similarity correlation with score percentile. Cumulative average semantic similarity correlations between score percentile and each of the three GO categories—(A) molecular function, (B) biological process, and (C) cellular component. (CS) Congruence score. GO annotations for yeast genes are downloaded from the Saccharomyces Genome Database (SGD). Diffusion kernel scores optimized for predicting co-complex membership were used (γ + 0.25, 0.1, 0.05 for G+, G, and G−). See text for details.
A convenient property of a diffusion kernel is that ranking based on a multiple gene query is a fast linear operation. Compound queries can improve performance by reinforcing weak lines of evidence (Asthana et al. 2004) and increasing specificity (Myers et al. 2005; Stuart et al. 2007). Compound queries were tested systematically for the MIPS curated protein complexes using the G (γ = 0.1) kernel. Precision and recall were estimated using the position of known members in the ranked list, excluding the self-terms for known members when computing scores (see Supplemental Methods).
Several complexes are recovered with high recall, with additional predicted components not annotated as complex members (Fig. 9). Known protein–protein interactions from BioGRID and other high-throughput studies (Gavin et al. 2006; Krogan et al. 2006; Stark et al. 2006) are overlaid. For clarity, physical interactions between known members of the complexes are not shown. Several themes emerge. First, many high-ranking proteins belong to a parent of the query complex (yellow nodes). Usually, these additional proteins have extensive physical interactions with the proteins in the query complex (Fig. 9A–C,E,J). Second, the automated analysis identifies proteins that have been reported as complex members but not yet updated by MIPS. These include Hrt1 for the SCF–Cdc4 complex (Kamura et al. 1999), Swm1 and Mnd2 for the anaphase promoting complex (Hall et al. 2003), and Ost5 for the oligosaccharyltransferase complex (Fig. 9F–H; Knauer and Lehle 1999). Third are proteins that physically associate with the query complex and function in the same pathway. For example, Cdc20 is an activator of the APC (Visintin et al. 1997), and Sec4, Sec9, and Sro7 associate with the exocyst complex (Fig. 9G,I).
Figure 9.

Modules from complex-based search. Cyan nodes (module) are labeled with the ID of the MIPS complex used as query. Known members of the query complex with no SFL interaction in our training set are not shown. (Blue edges) Physical interactions absent from MIPS but present in high-throughput data (Gavin et al. 2006; Krogan et al. 2006; Stark et al. 2006). Physical interactions between known members are not shown.
In greater detail, the query complex in Figure 9A contains actin-associated motor proteins. Two of the seven proteins in this complex, Smy2 and Myo4, have no SFL interactions and do not appear. Proteins returned by the query include six that belong to a parent complex. Five of those—Bem1, Rvs167, Arp2, Vpr1, and Las17—belong to actin-associated proteins and form a dense physical interaction subnetwork with Myo3 and Myo5. This subnetwork is composed of proteins functioning coherently in actin cytoskeleton dynamics. Las17 is an actin assembly factor that activates the Arp2/3 complex, which is also part of the subnetwork (Li 1997; Winter et al. 1999). Arp2 and Arp3 form actin nucleation centers essential for the integrity of actin patches (Winter et al. 1997; Machesky and Gould 1999). Bzz1 colocalizes with Las17 to actin patches and recruits actin polymerization machinery (Soulard et al. 2002). Hof1 regulates actomyosin ring dynamics and septins (Lippincott and Li 1998). Cmd1 is a regulator of biological processes such as mitosis, bud growth, and endocytosis where actin organization is crucial (Stirling et al. 1994; Geli et al. 1998). Many remaining module members are also closely involved in the above-mentioned processes. Products of two uncharacterized ORFs, YKR074W and NCS2, and one protein with unknown function, Chs7, are predicted to be part of this module, suggesting their potential role in actin cytoskeleton organization.
The kernel-based search can return several protein complexes involved in closely related biological processes (Fig. 9C). The largest connected component retrieved by a nucleosomal protein query includes a histone acetyltransferase, Gcn5, that acetylates histones H2B and H3, and several components of chromatin remodeling complexes: Isw1 and Itc1, Sth1 and Sfh1, and Snf5. The module also contains the elongator complex (Elp2, Elp4, Elp6, and Iki3) and the CBF3 complex (Cep3, Cbf2, and Ctf13). This probably reflects tight coupling between chromatin remodeling, histone modification, and transcription elongation.
Linked processes are also observed for two subgroups of proteins involved in N-linked glycosylation (Fig. 9H). One comprises OST genes that catalyze asparagine-linked glycosylation of newly synthesized proteins. The other subgroup consists of the ALG genes involved in oligosaccharyl synthesis. Using four genes in the OST gene subgroup as query identifies an additional OST gene absent from MIPS and six ALG genes. This module is consistent with a cluster found in EMAP data (Schuldiner et al. 2005).
Discussion
Our results show that diffusion kernels for a genetic interaction network improve over methods that consider only local network information to predict genetic and physical interactions. Odd-parity kernels boost the performance further for predicting new genetic interactions. Even-parity kernels perform somewhat worse than full kernels, however, for predicting physical interactions. The performance of the full kernel for protein co-complex prediction reflects the existence of genetic interactions both within and between pathways. Between-pathway interactions dominate, representing 70%–80% of genetic interactions (Kelley and Ideker 2005; Ulitsky and Shamir 2007). Nevertheless, the remaining 20%–30% of within-pathway interactions are effective in predicting physical interactions. An important motif is a genetic interaction that bridges partially redundant subunits of a protein complex, such as the two subunits of the Ndc80 complex, Nuf2/Spc24 and Tid/Spc25, which form fully-connected SFL and PPI subnetworks. More complicated patterns, such as partial redundancy between three pathways or complexes, can also lead to odd-length paths connecting physically interacting proteins.
The variation of the optimal γ with performance for SFL prediction (Fig. 6) is consistent with network topology predictors of performance. When the known local SFL network around a gene is dense, short length-3 paths are sufficient to find new SFL partners, leading to large optimal γ and good performance. This is the case for many genes in the BioGRID training data. When the local network has been less well mapped, for example, indicated by fewer genes connected to multiple first neighbors, longer paths and smaller γ values are optimal. This was the case for novel queries selected for experimental confirmation. These results indicate a possible benefit for optimizing γ through cross-validation with known partners prior to predicting new partners, which can be readily done by pre-calculating G− over a range of γ (Supplemental Fig. 9). For protein interaction prediction, diffusion kernels that sample longer paths dominate methods that only look at second neighbors.
Other diffusion kernel formulations are possible. In fact, the most widely used formulation may not be the steady-state kernel adopted here but, rather, an exponential kernel simulating transient decay, with a single parameter representing the decay time (see “Exponential kernel” in Supplemental Methods). The exponential kernel has been used for string kernels and support vector machine (Kondor and Lafferty 2002), protein sequence similarity searches (Weston et al. 2004, 2006; Kuang et al. 2005), and protein–protein interaction networks (Lee et al. 2006). The full exponential kernel did not perform as well as the full steady-state kernel in predicting protein complex membership (Supplemental Fig. 12). Although parity-specific exponential kernels can be defined, calculations are far more cumbersome than for steady-state kernels (Supplemental Equation 9).
An important use of kernels is as features in integrative methods that combine heterogeneous data (Schölkopf et al. 2004). By integrating physical interaction data, for example, SFL interactions could be predicted for genes that are absent from genetic interaction training data but present in the physical interaction network. Support vector machines (SVMs) are highly effective classifiers that can make use of integrated kernels (Boser et al. 1992).
We trained SVM classifiers by combining kernels from genetic interactions (G−), physical interactions (GMIPS, GY2H, GAPMS), and Gene Ontology annotations (GOfunc) using radial basis functions. The performance of an SVM with an integrated kernel was only slightly better than the performance of an SVM using just the G− kernel, or ranking by G− itself (Fig. 10; Supplemental Table 1). An SVM that integrated all data except for G− performed much worse. Note that the precision reported here is artificially inflated because, for computational feasibility, training sets were balanced between known positives and known negatives.
Figure 10.

Results of SFL prediction with and without data integration. Four features—three derived from protein–protein interactions and one obtained from Gene Ontology annotations—were used in data integration by the support vector machine (SVM). The G− scores used in direct ranking and for the SVM were obtained with γ = 32. (*) The results of the SVM classification. See text for details. (A) Precision-recall curves of four methods. The SVM classifier that integrates additional features with G− performs the best. (B) Receiver-operator characteristic curves of four methods. The SVM classifier that integrates additional features with G− performs the best.
An SVM combining kernels from protein–protein interaction data, genetic interactions, and amino acid sequence data recently achieved high accuracy for predicting co-complex membership (Qiu and Noble 2008). This method first computed an exponential diffusion kernel K(a,b) between pairs of genes, then used a tensor product kernel (TPK) to define inner products between two gene-pairs, TPK[(a,b), (c,d)] = K(a,c)K(b,d) + K(a,d)K(b,c). Using a full TPK is computationally intensive because it scales as (number of genes)4, as opposed to (number of genes)2 for calculating diffusion kernels or SVMs based on diffusion kernels.
We investigated an alternative approach, motivated by one-class classification, using a TPK to score the similarity of a gene pair (a,b) to all known SFL pairs. Since the pairwise kernel K(a,b) is meant to indicate similarity, G+ is appropriate for this role, leading to a similarity score of
This projection of the TPK, which we term the GAG kernel, is similar to G− in having only odd-number powers of the adjacency matrix A, but has a slightly different normalization. The GAG kernel is inferior to G− according to the F-score, although it does have higher precision in the low recall regime (Supplemental Fig. 13).
These results do suggest, however, that improved kernels for SFL prediction may come from an integrated kernel of the form (I − KAKA)−1KAK, generalizing “two-hop” predictors (Wong et al. 2004). Here, K stands for a pairwise kernel that could combine the even-parity SFL kernel G+ with protein interactions and other positive predictors of functional associations, including pre-integrated data sources such as YeastNet (Lee et al. 2007) and String (von Mering et al. 2007).
Conclusion
Graphs are a useful abstraction for biological networks, and diffusion kernels have been effective for inferring similarities between nodes in a graph. A tacit assumption is that the graph edges themselves represent similarities. This is not necessarily the case for genetic interactions, which are often highly enriched between rather than within pathways and complexes, resulting in bipartite motifs. The same motifs are anticipated to occur in social networks where edges represent antipathy rather than amity.
Extracting just the odd-parity contributions to the diffusion kernel leads to substantial improvements in the ability to predict new genetic interactions from a network of synthetic fitness and synthetic lethal interactions in yeast. Optimal predictors rely on shortest-possible length-3 paths for well-mapped regions of the yeast genetic interaction network and include longer paths for regions that are less well mapped. These methods are effective in identifying candidate interactions that can be confirmed experimentally. The odd-parity kernel performs as well as, if not better than, previous methods that combined genetic and physical interactions to make predictions.
The even-parity kernel is effective in predicting protein interactions and co-complex membership, and much more effective than previous methods based solely on synthetic lethal data. The full kernel performs slightly better than the even-parity kernel, possibly because of the existence of both within-pathway and between-pathway genetic interactions.
These parity-specific kernels provide improved base methods for use with machine learning and data integration strategies. Although tested in yeast, these methods should also be effective for RNAi-based genetic screens in higher organisms, and for chemical-genetic screens where a ligand–target interaction simulates a loss-of-function allele. These methods may also be useful for analyzing social preference networks based on dislike.
Methods
Graph diffusion kernel
A generic directed network (V,E) is defined by nodes V (here genes) and edges E (here SFL interactions). The weights Aji of edges to node j from i define the graph adjacency matrix A. We consider symmetric networks only. A diffusion kernel is the solution to a continuous-time model for the distribution of a hypothetical fluid in this network (Fig. 2A). All nodes contain no fluid initially. Query nodes are then selected to serve as sources, where the hypothetical fluid is pumped in at a constant rate. Fluid diffuses from node to node through the network according to the edge connections and their weights. The source input is balanced by fluid loss out of each node at a constant first-order rate γ. Large γ leads to fast loss, hence short diffusive paths, while small γ allows deep diffusion and places more emphasis on random walks that explore more of the network. At equilibrium, no net flow occurs anywhere in the network. The better connected a node is to the query nodes, the more fluid it will contain at equilibrium.
The amount of fluid contained by node i at time t is denoted pi(t). The dynamics of pi(t) is governed by flow in from the source and i’s neighbors and flow out to the sink and i’s neighbors (Fig. 2B),
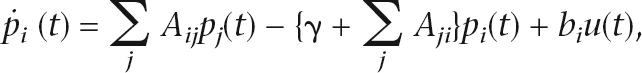 |
where u(t) is a unit step function, bi > 0 if node i is a query node, and bi = 0 otherwise.
Using the usual notation of a linear dynamical system, the diffusion process on the entire network is given by
where S is a diagonal matrix with Sii the sum of the ith column of A and  is a query selection vector.
Letting L = −(A − S − γI) (the graph Laplacian shifted by γ), the full response of the system is
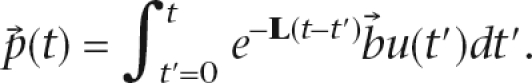 |
As t → ∞, the system reaches a steady state. The equilibrium distribution of fluid density on the graph is
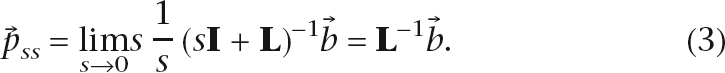 |
If we define G ≡ L−1,  is fully determined by and G, while represents the set of query nodes selected and the amount of source input into each query, and G is a query-independent constant defined by the graph structure.
Assuming that L is nonsingular, the matrix G is given by
 |
This transformation is useful because it changes the matrix inverse problem to an easier matrix multiplication problem. The self-term G0 ≡ (S + γI)−1 is the inverse of a diagonal matrix and hence trivial to calculate. The matrix inverse (I − G0A)−1 can be computed using a power series expansion,
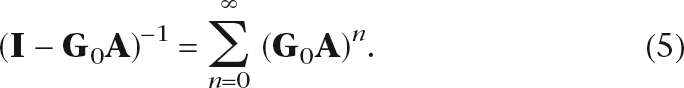 |
The infinite sum in Equation 5 is guaranteed to converge when γ is greater than the largest eigenvalue of A − S (see “Convergence” in Supplemental Methods). When L is close to singular, we can use the pseudo-inverse as an alternative.
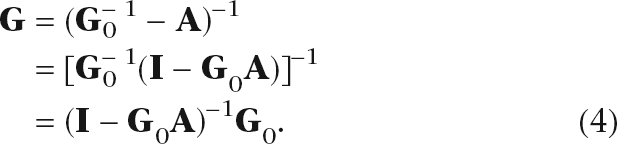
Combining Equations 4 and 5, the matrix G can be written as
When A is symmetric, G is the sum of symmetric matrices and hence also symmetric. When A − S is full-rank, G is positive semi-definite and hence a kernel (Kondor and Lafferty 2002). From here on, we use both matrix and kernel to refer to G.
A kernel function K maps a pair of points in sample space χ to a scalar similarity measure in real space R. When there is a graph structure underlying the data, kernels that capture the global link structure of a graph often outperform algorithms that only use local information in various statistical learning tasks. While many graph diffusion kernels are based on transient properties of random walks on a lattice, equivalent to matrix elements of an exponential time evolution operator (Kondor and Lafferty 2002; Lafferty and Lebanon 2005), ours is instead based on steady-state properties of the same operator. Applications of graph diffusion kernels include but are not limited to ranking, searching, clustering, and classification (Brin and Page 1998; Weston et al. 2004; Zhou et al. 2004; Lee et al. 2006).
In practice, we usually normalize edge weights by node degrees. In an undirected network, we would like to preserve the symmetry of the adjacency matrix after the normalization. One such normalization scheme is to replace A with N(A) = S−1/2AS−1/2 and replace S with the corresponding diagonal matrix S′ whose diagonal elements contain the column sums of N(A) in Equation 2. The (i,j)-th element of the “normalized adjacency matrix” is
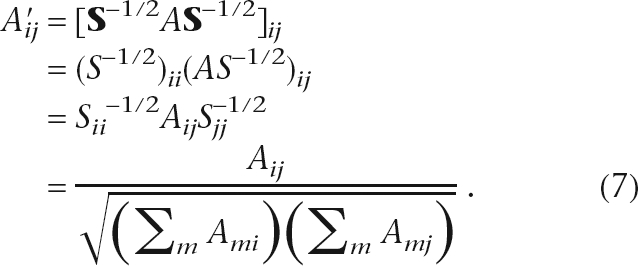 |
It is clear from Equation 7 that the edge weights between nodes i and j are normalized by the degrees of both nodes and hence every path is weighted according to degrees of all the nodes on the path. In all analysis that follows, the symmetric normalization scheme is used. Note that we normalize the adjacency matrix and then calculate the Laplacian, as opposed to a normalized Laplacian defined as I − D−1/2AD−1/2 for diagonal degree matrix D.
Other normalizations are also possible. For example, replacing A with AS−1 gives G0 = (1 + γ)−1 I and an identical transition rate out of each vertex, which has been used for Markov Cluster Linkage (Enright et al. 2002). This does not produce a kernel because kernels are symmetric. Post-symmetrization by geometric mean or harmonic mean with the matrix transpose can be applied, but did not perform as well in practice and does not have a simple interpretation.
The asymmetric normalization is useful, however, in providing intuition about the meaning of the decay parameter γ. Here we interpret the fluid density as the population of discrete particles executing a continuous-time random walk. From Equation 2, the probability that a random walker inserted at time 0 is still present at time t is exp(−γt), giving a mean lifetime of γ−1. The rate of transitions out of each vertex is given by the column sums of A′, all equal to 1 by the A′ = AS−1 normalization. The mean number of transitions is the transition rate times the mean lifetime, also equal to γ−1, and gives the mean length of diffusive paths contributing to the sum.
The matrix elements Gij represent the connectedness between node i and node j due to paths of all lengths between the two nodes. Each multiplication by A represents a one-step transition to an immediate neighbor. Hence each component Gn = (G0A′)nG0 in Equation 6 represents the connectedness contributed by length-n paths. We can group the components with odd and even number of transitions to give
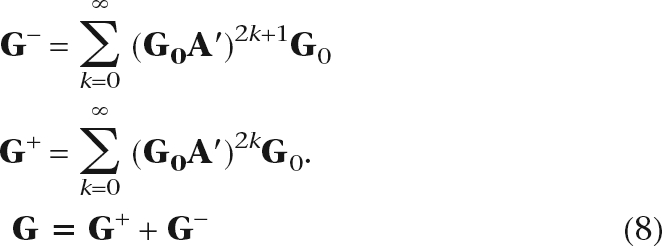 |
The matrices G− and G+ quantify the “reachability” by odd- and even-length paths, respectively. The full kernel G and the even- and odd-parity kernels can be computed by iterative matrix multiplication (Supplemental Code). The estimate of G at iteration k, denoted G(k), can be calculated using the previous estimate G(k − 1) as G(k) = G0 + G0A′G(k − 1), with initial condition G(0) = G0. Iterations continue until each element has converged. The updated equation G+(k) = G0 + G0A′G0A′G+(k − 1) is used for G+, with initial condition G+(0) = G0. The odd-parity kernel G− is obtained from the converged G+ as G− = G+A′G0.
Recall that in a network of enemy-only links, enemies are connected by many odd-length paths, while friends are connected by many even-length paths. Hence G− and G+ are natural choices for predicting enemies and friends. When applied to the synthetic genetic interaction network where nodes are genes and edges are SFL interactions, an undirected network with binary edges is used where Aij = 1 if an SFL interaction exists between genes i and j in at least one direction, and Aij = 0 otherwise.
Kernel scores are additive over queries, with
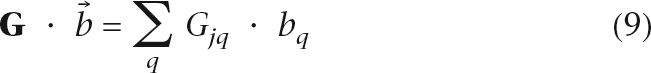 |
for bq = 1 if q ∈ Q and bq = 0, otherwise. This is equivalent to searching a set of keywords in a web search engine. Non-equal weights can indicate that queries are of varying importance. This is the same idea as the “label propagation algorithm” proposed in Zhu et al. (2003) and Zhou et al. (2004) and used by Tsuda et al. (2005) for protein function prediction. Other search mechanisms can be easily implemented by changing the query weight vector . For example, search for “q NOT l” is equivalent to setting bq to be a positive number and bl to be a negative number.
Performance assessment by cross-validation
Optimization relied on standard assessments of performance: Precision, (number of known positives predicted as positive)/(number of predicted positives); Recall or True Positive Rate (TPR), (number of known positives predicted as positive)/(number of known positives); and False Positive Rate (FPR), (number of known negatives predicted as positive)/(number of known negatives). A single summary statistic for the entire Precision-Recall (PR) curve is the maximum value of the F-score, the harmonic mean of Precision and Recall, 2 × Precision × Recall/(Precision + Recall).
A summary statistic for the Receiver Operating Characteristic (ROC) curve of TPR versus FPR is the Area Under the Curve (AUC) (Egan 1975). The AUC is independent of the ratio of known positives to negatives and depends on performance over an entire ranked list of predictions (Fawcett 2003). The F-score provides a better assessment of the ability to enrich true positives among the top-ranked predictions, particularly when positives are much rarer than negatives and misclassifications at the tail of the list have little cost (Davis and Goadrich 2006). The F-score was used to compare performance of different predictors. AUCs from ROC plots are provided as well.
For prediction of SFL interactions, fivefold cross-validation was used to calculate each diffusion kernel at 14 logarithmically spaced γ values ranging from 0.01 to 256. Each kernel was then used to rank the held-out pairs and the known negatives. Cross-validation was not used for protein interaction prediction. In both cases, tests on independent subsets of the data did not yield differences in the single parameter γ found to be optimal.
Algorithms for comparison
Congruence score method
The number of common neighbors in genetic network is a strong predictor of protein interactions (Tong et al. 2004). The hypergeometric P-value for the shared neighbor count (Goldberg and Roth 2003) is an improved predictor termed the congruence score in the context of genetic interactions (Ye et al. 2005a):
 |
Here di and dj are the degrees of genes i and j, k is the number of shared neighbors, and t is the total number of genes in the network, possibly adjusted for the experimental design if a small number of query genes were tested against a complete library of knockout strains.
Other length-2 and length-3 path based methods
A naive-scoring matrix based on length-2 paths is A2 (A is the un-normalized adjacency matrix), whose matrix elements count the number of length-2 paths between every pair of nodes. One may normalize the number of length-2 paths between i and j by the total number of length-2 paths that connects to i or j,
where T is diagonal with Tii = ∑j[A2]ij. Alternatively, one can weight the edge between i and j by the degrees of the two nodes before taking the square, giving a kernel,
where S is a diagonal matrix in which the diagonal elements are the column sums of A. This kernel normalizes the length-2 paths by the degrees of i and j. Similarly, the raw count of length-3 paths is A3, [N(A)]3 is (S−1/2AS−1/2)3, and N(A3) is T′−1/2A3T′−1/2 with diagonal T′ii = ∑j[A3]ij.
Data sources
Genetic interaction data
We obtained 12,237 synthetic lethal interactions and 6255 synthetic growth defect interactions between 2700 yeast genes from the General Repository for Interaction Data sets (BioGRID) version 2.0.27 release (Stark et al. 2006). For SFL interaction prediction, this data set was randomly partitioned into five equal-sized sets for cross-validation (CV). In order for the adjacency matrix in each CV to be nonsingular, we iteratively pruned genes having a single SFL interaction. The pruned data set contained 13,022 nonredundant SFL interactions involving 1817 genes. In each fold of CV, one out of the five sets was held out as the positive test set, while the remaining four sets were used to train diffusion kernels. We also compiled a set of 179 query genes from several large-scale studies (Tong et al. 2001, 2004; Krogan et al. 2003; Pan et al. 2006) and defined the negative test set to contain all double knockouts that were not tested positive in those studies. Note that the negative test set is not perfect in the sense that not every interaction is guaranteed to have been tested, even in the large-scale studies. Since query-target information is not available or applicable for every SFL interaction from BioGRID, the congruence score can be computed only in the target-to-target fashion. For the congruence score, this limits the number of usable SFL interactions to those between the target genes and the 179 query genes we compiled.
Protein co-complex data
The Munich Information Center for Protein Sequences (MIPS) database (Mewes et al. 2004) provides a reliable source of protein complex information curated from many small-scale experiments. Hence we formed our test set based on MIPS complex information, excluding complexes that came solely from high-throughput studies. This test set contains 206 MIPS complexes. We obtain 10,887 protein pairs within the same complex involving 1171 genes, of which 822 genes are present in the genetic interaction network. These 822 genes form 337,431 pairs. Of these pairs, 4291 that are co-complexed in MIPS are taken as known positives, and the remaining 333,140 pairs are used as known negatives. We did not remove pairs based on either colocalization or existence of pairwise interactions in high-throughput data. The full genetic interaction data as described previously are used to generate the graph kernels. The performance of the predictive methods based solely on genetic interactions is likely to be limited by the incomplete overlap between functional associations and physical interactions (Chua et al. 2006).
Data integration with support vector machine for predicting SFL interactions
A gold standard test set for the classification task comprised 13,022 SFL gene pairs from BioGRID and the same number of gene pairs uniformly sampled from all non-SFL gene pairs as defined previously. The balanced test set was used to evaluate the performance of the SVM classifier using different features. We generated five such test sets, each with a different random sample of non-SFL gene pairs and report results averaged across the five data sets.
Note here that each entity to be classified is a pair of genes or proteins and the task is to assign them to the SFL class or non-SFL class. Hence, the features we considered are also for gene/protein pairs rather than for an individual gene or protein. We describe five features and their data sources below.
G− score trained from known SFL interactions in BioGRID. Note that the SFL status of a gene pair is also the class label that we were predicting; to avoid reusing this information in the G− score, we obtained G− scores using a scheme similar to fivefold cross-validation. The SFL data set was randomly divided into five equal-sized subsets, and five G− kernels were obtained, each trained on SFLs with one subset left out. For a SFL gene pair, we used the G− score from SFLs excluding the subset that this gene pair resided in. For a non-SFL gene pair, we used the average of the five G− kernel scores;
GMIPS, diffusion kernel (Equation 6) trained on 10,887 co-complex protein pairs (source: MIPS);
GY2H, diffusion kernel trained on 9888 yeast two-hybrid protein–protein interactions (source: BioGRID);
GAPMS, diffusion kernel trained on 32,808 protein–protein interactions obtained by affinity purification coupled with mass spectrometry (source: BioGRID and Gavin et al. [2006] and Krogan et al. [2006]);
GOfunc, Semantic similarity of the molecular function category of Gene Ontology annotations (source: SGD, the Gene Ontology database).
Values of γ for the diffusion kernels were selected to optimize prediction of SFLs. The G− kernel used γ = 32. The three PPI kernels for predicting SFLs were insensitive to γ, with F-score and AUC performance criteria for each varying by less than 0.01 over the range γ = 0.1 to 2. The SVMs used PPI kernels trained with γ = 1. Missing values were replaced by the mean values of each feature, a standard procedure. In training an SVM, we concatenate all or a subset of the five features, and apply a radial basis kernel to the resulting vectors. The SVM parameters were optimized by grid search with fivefold CV. We evaluated the performance of each method at the optimal SVM parameters by precision-recall and receiver operator characteristic curves averaged across the five folds and then across the five test sets in addition to the classification accuracy. We used the publicly available support vector machine software package libsvm (http://www.csie.ntu.edu.tw/∼cjlin/libsvm) to construct the SVM classifiers.
Experimental validation of new SFL predictions
To validate the target genes of ADA2, the query construct (ada2Δ::URA3 PCR product) was transformed into the individual haploid-convertible heterozygous diploid YKOs of the 100 target genes. Two independent transformants were sporulated on sporulation medium (1% of potassium acetate, 0.005% zinc acetate, 0.3 mM histidine) for 5 d and then tested by random spore analysis (RSA). Haploid progeny were spotted as 10-fold serial dilutions on three selective media: magic medium or MM (selects for single-mutant xxxΔ::kanMX and double-mutant cells), MM-Ura-G418 (selects for single-mutant ada2Δ::URA3 and double-mutant cells), and MM-Ura (selects for double-mutant cells) (Pan et al. 2004). The plates were incubated at 30°C, and the number and size of viable colonies were recorded after 3 and 4 d. SFL interactions were scored when the growth of the double mutant was worse than the growth of both single mutants. To validate the target genes of ESA1, two sequential transformations (first with the query construct esa1::natMX PCR product, then with a CEN plasmid containing the Ts allele esa1-531) were performed to select the appropriate transformants. RSA was instead carried out by comparing the growth of the haploid progenies on MM-Ura+CloNat versus on MM-Ura and MM-Ura-G418+CloNat at 30°C, a semipermissive temperature for esa1-531.
Acknowledgments
J.S.B. acknowledges helpful discussions with Christina Leslie and Bruno Jedynak. Y.Q. thanks Raymond Cheong for critical reading and suggestions on the manuscript. We acknowledge helpful discussions with Daniel Yuan and Pamela Meluh. Y.Q. was supported by a predoctoral fellowship from IBM. J.S.B. acknowledges funding by NIH/NIGMS 1R01GM067761-01, NIH/NIGMS R41GM073492, NIH/NCRR U54RR020839, NSF CAREER 0546446, and the Whitaker Foundation.
Footnotes
[Supplemental material is available online at www.genome.org.]
Article published online before print. Article and publication date are at http://www.genome.org/cgi/doi/10.1101/gr.077693.108.
References
- Asthana S., King O.D., Gibbons F.D., Roth F.P. Predicting protein complex membership using probabilistic network reliability. Genome Res. 2004;14:1170–1175. doi: 10.1101/gr.2203804. [DOI] [PMC free article] [PubMed] [Google Scholar]
- Bandyopadhyay S., Kelley R., Krogan N.J., Ideker T. Functional maps of protein complexes from quantitative genetic interaction data. PLoS Comput. Biol. 2008;4:e1000065. doi: 10.1371/journal.pcbi.1000065. [DOI] [PMC free article] [PubMed] [Google Scholar]
- Boser B.E., Guyon I.M., Vapnik V.N. COLT ’92: Proceedings of the Fifth Annual Workshop on Computational Learning Theory. ACM; New York: 1992. A training algorithm for optimal margin classifiers; pp. 144–152. [Google Scholar]
- Brin S., Page L. The anatomy of a large-scale hypertextual web search engine. Comput. Netw. ISDN Syst. 1998;30:107–117. [Google Scholar]
- Chua H.N., Sung W.K., Wong L. Exploiting indirect neighbours and topological weight to predict protein function from protein–protein interactions. Bioinformatics. 2006;22:1623–1630. doi: 10.1093/bioinformatics/btl145. [DOI] [PubMed] [Google Scholar]
- Collins S.R., Miller K.M., Maas N.L., Roguev A., Fillingham J., Chu C.S., Schuldiner M., Gebbia M., Recht J., Shales M., et al. Functional dissection of protein complexes involved in yeast chromosome biology using a genetic interaction map. Nature. 2007;446:806–810. doi: 10.1038/nature05649. [DOI] [PubMed] [Google Scholar]
- Davierwala A.P., Haynes J., Li Z., Brost R.L., Robinson M.D., Yu L., Mnaimneh S., Ding H., Zhu H., Chen Y., et al. The synthetic genetic interaction spectrum of essential genes. Nat. Genet. 2005;37:1147–1152. doi: 10.1038/ng1640. [DOI] [PubMed] [Google Scholar]
- Davis J., Goadrich M. ICML ’06: Proceedings of the 23rd International Conference on Machine Learning. ACM Press; New York: 2006. The relationship between precision-recall and ROC curves; pp. 233–240. [Google Scholar]
- Dobzhansky T. Genetics of natural populations. XIII. Recombination and variability in populations of Drosophila pseudoobscura. Genetics. 1946;31:269–290. doi: 10.1093/genetics/31.3.269. [DOI] [PMC free article] [PubMed] [Google Scholar]
- Egan J.P. Signal detection theory and ROC-analysis. Academic Press; New York: 1975. [Google Scholar]
- Enright A.J., Dongen S.V., Ouzounis C.A. An efficient algorithm for large-scale detection of protein families. Nucleic Acids Res. 2002;30:1575–1584. doi: 10.1093/nar/30.7.1575. [DOI] [PMC free article] [PubMed] [Google Scholar]
- Fawcett T. ROC graphs: Notes and practical considerations for researchers. Technical Report HPL-2003-4. HP Laboratories; Palo Alto, CA: 2003. [Google Scholar]
- Gavin A.C., Aloy P., Grandi P., Krause R., Boesche M., Marzioch M., Rau C., Jensen L.J., Bastuck S., Dümpelfeld B., et al. Proteome survey reveals modularity of the yeast cell machinery. Nature. 2006;440:631–636. doi: 10.1038/nature04532. [DOI] [PubMed] [Google Scholar]
- Geli M.I., Wesp A., Riezman H. Distinct functions of calmodulin are required for the uptake step of receptor-mediated endocytosis in yeast: The type I myosin myo5p is one of the calmodulin targets. EMBO J. 1998;17:635–647. doi: 10.1093/emboj/17.3.635. [DOI] [PMC free article] [PubMed] [Google Scholar]
- Giaever G., Chu A.M., Ni L., Connelly C., Riles L., Véronneau S., Dow S., Lucau-Danila A., Anderson K., André B., et al. Functional profiling of the Saccharomyces cerevisiae genome. Nature. 2002;418:387–391. doi: 10.1038/nature00935. [DOI] [PubMed] [Google Scholar]
- Goldberg D.S., Roth F.P. Assessing experimentally derived interactions in a small world. Proc. Natl. Acad. Sci. 2003;100:4372–4376. doi: 10.1073/pnas.0735871100. [DOI] [PMC free article] [PubMed] [Google Scholar]
- Gustafson A.M., Snitkin E.S., Parker S.C.J., DeLisi C., Kasif S. Towards the identification of essential genes using targeted genome sequencing and comparative analysis. BMC Genomics. 2006;7:265. doi: 10.1186/1471-2164-7-265. [DOI] [PMC free article] [PubMed] [Google Scholar]
- Hall M.C., Torres M.P., Schroeder G.K., Borchers C.H. Mnd2 and swm1 are core subunits of the Saccharomyces cerevisiae anaphase-promoting complex. J. Biol. Chem. 2003;278:16698–16705. doi: 10.1074/jbc.M213109200. [DOI] [PubMed] [Google Scholar]
- Kamura T., Koepp D.M., Conrad M.N., Skowyra D., Moreland R.J., Iliopoulos O., Lane W.S., Kaelin W.G., Elledge S.J., Conaway R.C., et al. Rbx1, a component of the VHL tumor suppressor complex and SCF ubiquitin ligase. Science. 1999;284:657–661. doi: 10.1126/science.284.5414.657. [DOI] [PubMed] [Google Scholar]
- Kelley R., Ideker T. Systematic interpretation of genetic interactions using protein networks. Nat. Biotechnol. 2005;23:561–566. doi: 10.1038/nbt1096. [DOI] [PMC free article] [PubMed] [Google Scholar]
- Knauer R., Lehle L. The oligosaccharyltransferase complex from yeast. Biochim. Biophys. Acta. 1999;1426:259–273. doi: 10.1016/s0304-4165(98)00128-7. [DOI] [PubMed] [Google Scholar]
- Kondor R., Lafferty J. Proceedings of the International Conference on Machine Learning (ICML) Morgan Kaufman; San Francisco, CA: 2002. Diffusion kernels on graphs and other discrete input spaces; pp. 315–322. [Google Scholar]
- Krogan N.J., Keogh M.C., Datta N., Sawa C., Ryan O.W., Ding H., Haw R.A., Pootoolal J., Tong A., Canadien V., et al. A Snf2 family ATPase complex required for recruitment of the histone H2A variant Htz1. Mol. Cell. 2003;12:1565–1576. doi: 10.1016/s1097-2765(03)00497-0. [DOI] [PubMed] [Google Scholar]
- Krogan N.J., Cagney G., Yu H., Zhong G., Guo X., Ignatchenko A., Li J., Pu S., Datta N., Tikuisis A.P., et al. Global landscape of protein complexes in the yeast Saccharomyces cerevisiae. Nature. 2006;440:637–643. doi: 10.1038/nature04670. [DOI] [PubMed] [Google Scholar]
- Kuang R., Weston J., Noble W.S., Leslie C. Motif-based protein ranking by network propagation. Bioinformatics. 2005;21:3711–3718. doi: 10.1093/bioinformatics/bti608. [DOI] [PubMed] [Google Scholar]
- Lafferty J., Lebanon G. Diffusion kernels on statistical manifolds. J. Mach. Learn. Res. 2005;6:129–163. [Google Scholar]
- Lee H., Tu Z., Deng M., Sun F., Chen T. Diffusion kernel-based logistic regression models for protein function prediction. OMICS. 2006;10:40–55. doi: 10.1089/omi.2006.10.40. [DOI] [PubMed] [Google Scholar]
- Lee I., Li Z., Marcotte E.M. An improved, bias-reduced probabilistic functional gene network of baker’s yeast, Saccharomyces cerevisiae. PLoS One. 2007;2:e988. doi: 10.1371/journal.pone.0000988. [DOI] [PMC free article] [PubMed] [Google Scholar]
- Lerman G., Shakhnovich B.E. Defining functional distance using manifold embeddings of gene ontology annotations. Proc. Natl. Acad. Sci. 2007;104:11334–11339. doi: 10.1073/pnas.0702965104. [DOI] [PMC free article] [PubMed] [Google Scholar]
- Li R. Bee1, a yeast protein with homology to Wiscott-Aldrich syndrome protein, is critical for the assembly of cortical actin cytoskeleton. J. Cell Biol. 1997;136:649–658. doi: 10.1083/jcb.136.3.649. [DOI] [PMC free article] [PubMed] [Google Scholar]
- Lin Y., Qi Y., Lu J., Pan X., Bader J.S., Boeke J.D. A comprehensive synthetic genetic interaction network of genes governing yeast histone acetylation and deacetylation. Genes & Dev. 2008;22:2062–2074. doi: 10.1101/gad.1679508. [DOI] [PMC free article] [PubMed] [Google Scholar]
- Lippincott J., Li R. Dual function of Cyk2, a cdc15/PSTPIP family protein, in regulating actomyosin ring dynamics and septin distribution. J. Cell Biol. 1998;143:1947–1960. doi: 10.1083/jcb.143.7.1947. [DOI] [PMC free article] [PubMed] [Google Scholar]
- Machesky L.M., Gould K.L. The arp2/3 complex: A multifunctional actin organizer. Curr. Opin. Cell Biol. 1999;11:117–121. doi: 10.1016/s0955-0674(99)80014-3. [DOI] [PubMed] [Google Scholar]
- Mewes H.W., Amid C., Arnold R., Frishman D., Güldener U., Mannhaupt G., Münsterkötter M., Pagel P., Strack N., Stümpflen V., et al. Mips: Analysis and annotation of proteins from whole genomes. Nucleic Acids Res. 2004;32:D41–D44. doi: 10.1093/nar/gkh092. [DOI] [PMC free article] [PubMed] [Google Scholar]
- Millar C.B., Grunstein M. Genome-wide patterns of histone modifications in yeast. Nat. Rev. Mol. Cell Biol. 2006;7:657–666. doi: 10.1038/nrm1986. [DOI] [PubMed] [Google Scholar]
- Myers C.L., Robson D., Wible A., Hibbs M.A., Chiriac C., Theesfeld C.L., Dolinski K., Troyanskaya O.G. Discovery of biological networks from diverse functional genomic data. Genome Biol. 2005;6:R114. doi: 10.1186/gb-2005-6-13-r114. [DOI] [PMC free article] [PubMed] [Google Scholar]
- Nabieva E., Jim K., Agarwal A., Chazelle B., Singh M. Whole-proteome prediction of protein function via graph-theoretic analysis of interaction maps. Bioinformatics. 2005;21 (Suppl. 1):i302–i310. doi: 10.1093/bioinformatics/bti1054. [DOI] [PubMed] [Google Scholar]
- Nowak M.A., Boerlijst M.C., Cooke J., Smith J.M. Evolution of genetic redundancy. Nature. 1997;388:167–171. doi: 10.1038/40618. [DOI] [PubMed] [Google Scholar]
- Ooi S.L., Shoemaker D.D., Boeke J.D. DNA helicase gene interaction network defined using synthetic lethality analyzed by microarray. Nat. Genet. 2003;35:277–286. doi: 10.1038/ng1258. [DOI] [PubMed] [Google Scholar]
- Pan X., Yuan D.S., Xiang D., Wang X., Sookhai-Mahadeo S., Bader J.S., Hieter P., Spencer F., Boeke J.D. A robust toolkit for functional profiling of the yeast genome. Mol. Cell. 2004;16:487–496. doi: 10.1016/j.molcel.2004.09.035. [DOI] [PubMed] [Google Scholar]
- Pan X., Ye P., Yuan D.S., Wang X., Bader J.S., Boeke J.D. A DNA integrity network in the yeast Saccharomyces cerevisiae. Cell. 2006;124:1069–1081. doi: 10.1016/j.cell.2005.12.036. [DOI] [PubMed] [Google Scholar]
- Qi Y., Ye P., Bader J.S. Genetic interaction motif finding by expectation maximization—a novel statistical model for inferring gene modules from synthetic lethality. BMC Bioinformatics. 2005;6:288. doi: 10.1186/1471-2105-6-288. [DOI] [PMC free article] [PubMed] [Google Scholar]
- Qiu J., Noble W.S. Predicting co-complexed protein pairs from heterogeneous data. PLoS Comput. Biol. 2008;4:e1000054. doi: 10.1371/journal.pcbi.1000054. [DOI] [PMC free article] [PubMed] [Google Scholar]
- Resnik P. Proceedings of the 14th International Joint Conference on Artificial Intelligence, Montreal, Canada. Morgan Kaufmann; San Francisco, CA: 1995. Using information content to evaluate semantic similarity in a taxonomy; pp. 448–453. [Google Scholar]
- Schölkopf B., Tsuda K., Vert J.P., eds . Kernel methods in computational biology. The MIT Press; Cambridge, MA: 2004. [Google Scholar]
- Schuldiner M., Collins S.R., Thompson N.J., Denic V., Bhamidipati A., Punna T., Ihmels J., Andrews B., Boone C., Greenblatt J.F., et al. Exploration of the function and organization of the yeast early secretory pathway through an epistatic miniarray profile. Cell. 2005;123:507–519. doi: 10.1016/j.cell.2005.08.031. [DOI] [PubMed] [Google Scholar]
- Soulard A., Lechler T., Spiridonov V., Shevchenko A., Shevchenko A., Li R., Winsor B. Saccharomyces cerevisiae bzz1p is implicated with type I myosins in actin patch polarization and is able to recruit actin-polymerizing machinery in vitro. Mol. Cell. Biol. 2002;22:7889–7906. doi: 10.1128/MCB.22.22.7889-7906.2002. [DOI] [PMC free article] [PubMed] [Google Scholar]
- Stark C., Breitkreutz B.J., Reguly T., Boucher L., Breitkreutz A., Tyers M. BioGRID: A general repository for interaction datasets. Nucleic Acids Res. 2006;34:D535–D539. doi: 10.1093/nar/gkj109. [DOI] [PMC free article] [PubMed] [Google Scholar]
- Stirling D.A., Welch K.A., Stark M.J. Interaction with calmodulin is required for the function of spc110p, an essential component of the yeast spindle pole body. EMBO J. 1994;13:4329–4342. doi: 10.1002/j.1460-2075.1994.tb06753.x. [DOI] [PMC free article] [PubMed] [Google Scholar]
- Stuart L.M., Boulais J., Charriere G.M., Hennessy E.J., Brunet S., Jutras I., Goyette G., Rondeau C., Letarte S., Huang H., et al. A systems biology analysis of the Drosophila phagosome. Nature. 2007;445:95–101. doi: 10.1038/nature05380. [DOI] [PubMed] [Google Scholar]
- Tong A.H., Evangelista M., Parsons A.B., Xu H., Bader G.D., Page N., Robinson M., Raghibizadeh S., Hogue C.W., Bussey H., et al. Systematic genetic analysis with ordered arrays of yeast deletion mutants. Science. 2001;294:2364–2368. doi: 10.1126/science.1065810. [DOI] [PubMed] [Google Scholar]
- Tong A.H.Y., Lesage G., Bader G.D., Ding H., Xu H., Xin X., Young J., Berriz G.F., Brost R.L., Chang M., et al. Global mapping of the yeast genetic interaction network. Science. 2004;303:808–813. doi: 10.1126/science.1091317. [DOI] [PubMed] [Google Scholar]
- Tsuda K., Noble W.S. Learning kernels from biological networks by maximizing entropy. Bioinformatics. 2004;20 (Suppl. 1):I326–I333. doi: 10.1093/bioinformatics/bth906. [DOI] [PubMed] [Google Scholar]
- Tsuda K., Shin H., Schölkopf B. Fast protein classification with multiple networks. Bioinformatics. 2005;21 (Suppl. 2):II59–II65. doi: 10.1093/bioinformatics/bti1110. [DOI] [PubMed] [Google Scholar]
- Ulitsky I., Shamir R. Pathway redundancy and protein essentiality revealed in the Saccharomyces cerevisiae interaction networks. Mol. Syst. Biol. 2007;3:104. doi: 10.1038/msb4100144. [DOI] [PMC free article] [PubMed] [Google Scholar]
- Ulitsky I., Shlomi T., Kupiec M., Shamir R. From E-MAPS to module maps: Dissecting quantitative genetic interactions using physical interactions. Mol. Syst. Biol. 2008;4:209. doi: 10.1038/msb.2008.42. [DOI] [PMC free article] [PubMed] [Google Scholar]
- Visintin R., Prinz S., Amon A. CDC20 and CDH1: A family of substrate-specific activators of APC-dependent proteolysis. Science. 1997;278:460–463. doi: 10.1126/science.278.5337.460. [DOI] [PubMed] [Google Scholar]
- von Mering C., Jensen L.J., Kuhn M., Chaffron S., Doerks T., Krüger B., Snel B., Bork P. String 7—recent developments in the integration and prediction of protein interactions. Nucleic Acids Res. 2007;35:D358–D362. doi: 10.1093/nar/gkl825. [DOI] [PMC free article] [PubMed] [Google Scholar]
- Ward J.J., Sodhi J.S., Buxton B.F., Jones D.T. Proceedings of the 2004 IEEE Computational Systems Bioinformatics Conference. IEEE Computer Society; Piscataway, NJ: 2004. Predicting gene ontology annotations from sequence data using kernel-based machine learning algorithms; pp. 529–530. [Google Scholar]
- Weston J., Elisseeff A., Zhou D., Leslie C.S., Noble W.S. Protein ranking: From local to global structure in the protein similarity network. Proc. Natl. Acad. Sci. 2004;101:6559–6563. doi: 10.1073/pnas.0308067101. [DOI] [PMC free article] [PubMed] [Google Scholar]
- Weston J., Kuang R., Leslie C., Noble W.S. Protein ranking by semi-supervised network propagation. BMC Bioinformatics. 2006;7(Suppl 1):S10. doi: 10.1186/1471-2105-7-S1-S10. [DOI] [PMC free article] [PubMed] [Google Scholar]
- Winter D., Podtelejnikov A.V., Mann M., Li R. The complex containing actin-related proteins Arp2 and Arp3 is required for the motility and integrity of yeast actin patches. Curr. Biol. 1997;7:519–529. doi: 10.1016/s0960-9822(06)00223-5. [DOI] [PubMed] [Google Scholar]
- Winter D., Lechler T., Li R. Activation of the yeast Arp2/3 complex by Bee1p, a WASP-family protein. Curr. Biol. 1999;9:501–504. doi: 10.1016/s0960-9822(99)80218-8. [DOI] [PubMed] [Google Scholar]
- Wong S.L., Zhang L.V., Tong A.H.Y., Li Z., Goldberg D.S., King O.D., Lesage G., Vidal M., Andrews B., Bussey H., et al. Combining biological networks to predict genetic interactions. Proc. Natl. Acad. Sci. 2004;101:15682–15687. doi: 10.1073/pnas.0406614101. [DOI] [PMC free article] [PubMed] [Google Scholar]
- Ye P., Peyser B.D., Pan X., Boeke J.D., Spencer F.A., Bader J.S. Gene function prediction from congruent synthetic lethal interactions in yeast. Mol. Syst. Biol. 2005a;1:2005.0026. doi: 10.1038/msb4100034. [DOI] [PMC free article] [PubMed] [Google Scholar]
- Ye P., Peyser B.D., Spencer F.A., Bader J.S. Commensurate distances and similar motifs in genetic congruence and protein interaction networks in yeast. BMC Bioinformatics. 2005b;6:270. doi: 10.1186/1471-2105-6-270. [DOI] [PMC free article] [PubMed] [Google Scholar]
- Zhou D., Weston J., Gretton A., Bousquet O., Schölkopf B. Ranking on data manifolds. Adv. Neural Inf. Process. Syst. 2004;16:169–176. [Google Scholar]
- Zhu X., Ghahramani Z., Lafferty J. Proceedings of the Twentieth International Conference on Machine Learning (ICML-2003), Washington DC, 2003. Morgan Kaufmann; San Francisco, CA: 2003. Semi-supervised learning using Gaussian fields and harmonic functions. [Google Scholar]