

Abstract
Group A streptococci (GAS) primarily cause infection at epithelial tissue sites of its human host. The role of the transcriptional regulator Mga in a humanized mouse model for superficial skin infection was investigated. Inactivation of mga in a skin strain (Alab49) led to loss of virulence. The Δmga mutant displayed >100-fold decrease in emm (pam) transcript levels, and loss of bacterial-bound plasmin activity. A slight decrease in speB transcription, accompanied by a partial decrease in cysteine protease activity but no change in PrtF2 degradation, was also observed. Mga had no effect on transcription of nra, Nra-regulated pilus genes (cpa, fctA) or other FCT-region genes (msmR, prtF2). Combined with findings on other Alab49 mutants, data show that several essential virulence genes are regulated by Mga or Nra, but not both, implying that any coordinated response during skin infection likely operates at a higher level of transcriptional control. Mga was required for bacterial autoaggregation and biofilm-like growth on an abiotic surface; however, aggregation and biofilm formation have only partial overlap with the skin virulence phenotype. Findings on numerous phenotypes for seven mutants constructed on the same genetic background yield a detailed, integrated model for GAS pathogenesis at the skin.
Keywords: streptococcus, impetigo, transcription, virulence, plasminogen, biofilm
1. INTRODUCTION
The primary reservoir for group A streptococcus (GAS) is the superficial epithelium of humans, its only known biological host. GAS are responsible for a minimally estimated 616 million cases of throat infection (pharyngitis) worldwide per year, and 111 million cases of skin infection (primarily impetigo) in children of less developed countries [1]. Infections at superficial tissue sites are an important source for organisms which efficiently transmit to new hosts. Thus, this ecological niche is the environment to which GAS strains adapt for long-term survival. Molecular differences among GAS strains classified according to their predilection for causing throat versus skin infection have been long recognized [2], and are further documented through more recent epidemiological surveys [3–10].
Mga is a transcriptional regulator of numerous genes involved in GAS virulence (reviewed in [11]). Present among all GAS strains are mga alleles belonging to either one of two main lineages exhibiting ~ 28% divergence, whereby the classical throat strains have one lineage form (mga-1) and classical skin strains harbor the other form (mga-2) [12]. The role of Mga in virulence has been examined in numerous animal models for colonization and/or infection of the upper respiratory tract, and for invasive disease involving deeper soft tissue [11, 13–16].
A drawback of many animal models for superficial GAS infection is the large inoculum doses that are employed [15, 17, 18], typically ranging from ≥ 3 ×10⁵ to 108 colony-forming units (cfus), a quantity that is likely in far excess of the physiological doses encountered in a natural setting. In a humanized mouse model for superficial skin infection, doses < 104 cfus of a virulent strain routinely yield infection, and infection can be achieved with as few as ~ 300 cfus [19–22]. In the humanized mouse, human skin engrafted on the back of SCID mice is gently scratched and bacteria are topically applied, mimicking conditions for the natural route of GAS transmission in superficial skin infection in humans. Other animal models for GAS skin infection deliver bacteria by injection and bypass epithelial barriers [23–26]. In addition to its high sensitivity, the humanized mouse model shows high specificity, whereby classical skin strains are significantly more virulent than throat strains [19]. Importantly, histopathologic alterations closely mimic changes observed during natural GAS impetigo in humans [27–29]. Virulent GAS undergo reproductive growth at the engrafted human skin, resulting in a net increase in cfus that can >10,000-fold, a hallmark of evolutionary success.
In this study, the role of Mga in superficial GAS infection at the skin is evaluated. Mga-regulated genes and phenotypes are identified. This new knowledge is combined with data from prior studies to develop a more complete picture of the key steps involved in skin pathogenesis, Relationships between skin virulence and determinants of bacterial cell-to-cell interactions, in the form of autoaggregation and biofilm-like growth, are also defined.
2. RESULTS
2.1. Role of Mga in superficial skin infection
In order to determine the role of Mga-regulated genes in superficial skin infection, a Δmga mutant was generated on the Alab49 strain background; Alab49 was isolated from an impetigo lesion and lacks the gene for serum opacity factor (sof) [30]. The Δmga mutant was compared to Alab49 wt for virulence in the humanized mouse model for impetigo. Net reproductive growth of bacteria at the skin is the primary outcome measure for virulence, and is highly concordant with histological alterations that resemble human cases of impetigo [19–22].
All skin grafts inoculated with Alab49 wt, tested over a wide range of doses, displayed a net increase in colony-forming units (cfus) at 7 d post-inoculation (Figure 1, upper panel). In contrast, 91% (10 of 11) of grafts inoculated with the Δmga mutant exhibited a net loss of cfus by 7 d (Figure 1, lower panel). The difference in bacterial growth at the skin for Alab49 wt versus the Δmga mutant was statistically significant for inoculum cultures grown to the either logarithmic or stationary phase (t = 0.001056 and 0.001098, respectively, using the unpaired t-test, 2-tailed; p < 0.002 for both comparisons, using the Mann Whitney U-test). The data demonstrate that Mga is essential for maximal virulence at the skin.
Figure 1. Effect of Mga on bacterial growth at the skin of the humanized mouse.
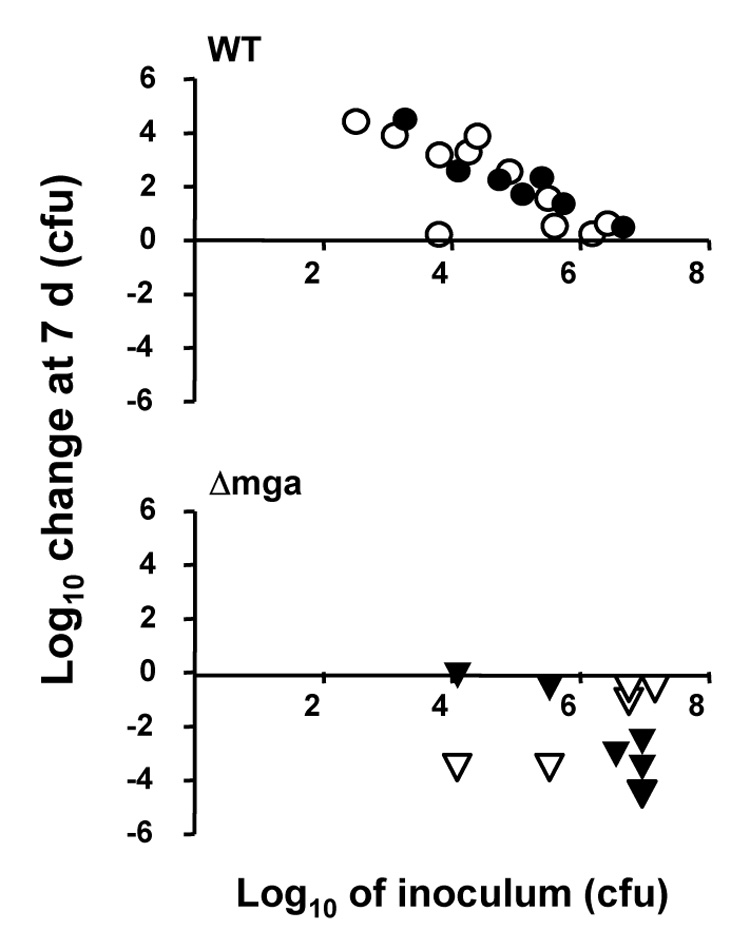
Bacteria grown to either mid-logarithmic (filled symbols) or stationary (open symbols) phase in THY broth culture were used to inoculate scratched human skin engrafted on SCID mice. The inoculum dose (log10 CFUs) is depicted on the x-axis. The net change (increase or decrease) in log10 CFUs recovered from a graft at biopsy at 7 d post-inoculation, relative to the inoculum dose, is shown on the y-axis. Each inoculum dose corresponds to a single skin graft and is represented by a single data point in the plot. Bacteria are Alab49 wt (upper panel) and the Δmga mutant (lower panel). When only those inoculum doses > 105 CFU are considered, the difference in growth at the skin for wt versus the Δmga mutant remain highly significant (t = 0.000149, t-test).
Furthermore, there was no apparent significant difference in growth of bacteria at the skin for inoculums of the Δmga mutant grown to mid-log versus stationary phase (t = 0.76, using the unpaired t-test; p = 0.86, using the Mann-Whitney U-test), suggesting that the attenuated virulence of the Δmga mutant is not growth phase-dependent. Elimination of the Δmga mutant from the skin may be the result of phagocytic clearance, healing of the slightly wounded skin and/or other unknown factors.
2.2. Role of Mga in transcription of virulence genes
The effect of Mga on gene transcription was determined by quantitative real time PCR (qRT-PCR), following growth of wild type (wt) and Δmga mutant organisms to mid-logarithmic or stationary phase in liquid broth. The elimination of the Δmga mutant from the skin (Figure 1B) precludes transcript measurements in situ. RNA was extracted from bacteria grown in enriched THY broth under an atmosphere of 5% CO2, conditions favorable for mga expression in several other GAS strains [11, 31–33]. The genes targeted for analysis are pam (encoding the plasminogen-binding M protein), scpA (C5a peptidase), fbaA (fibronectin-binding protein), ska (streptokinase), speB (secreted cysteine protease), nra (transcriptional regulator), cpa (collagen-binding protein), fctA (main structural subunit of pilus), prtF2 (fibronectin-binding protein), msmR (transcriptional regulator), and sclA (collagen-like surface protein). Several of the genes lie with the FCT-region of the genome and are responsible for expression of surface pili [22, 34]. Some of the genes were previously shown to be essential for virulence at the skin [20–22, 35].
Data show that Mga is a potent activator of pam (emm53) gene transcription in strain Alab49, with a >100-fold decrease in relative transcript abundance in the Δmga mutant as compared to the wt at either stage of growth (Table 1). Mga also had an activating effect on the transcription of scpA and fbaB, with a ≥ 30-fold decrease in relative transcript abundance in the Δmga mutant when tested during logarithmic phase.
Table 1.
qRT-PCR findings on virulence gene transcription for the Alab49 Δmga mutant grown in THY broth.
| Transcript abundance relative to wt * | |||||||||||||
|---|---|---|---|---|---|---|---|---|---|---|---|---|---|
| Construct | Growth phase | pam | ska | speB | nra | cpa | fctA | prtF2 | msmR | sclA | scpA | fbaA | |
| Δmga | mid log | mean average | 0.005 | 1.71 | 0.30 | 0.90 | 0.53 | 0.78 | 0.71 | 1.14 | 0.22 | 0.033 | 0.024 |
| sd | 0.005 | 1.04 | 0.20 | 0.40 | 0.23 | 0.31 | 0.60 | 0.38 | 0.23 | 0.007 | 0.017 | ||
| Δmga | stationary | mean average | 0.009 | 1.89 | 0.79 | 1.00 | 0.77 | 0.64 | 0.93 | 0.89 | 0.61 | n.d. | n.d. |
| sd | 0.003 | 0.78 | 0.55 | 0.73 | 0.12 | 0.17 | 0.86 | 0.51 | 0.42 | ||||
Each value is based on at least 3 different RNA preparations (except for scpA and fba, which are based on two RNA preparations)
Ratios < 0.5-fold are highlighted in bold.
A ~ 3-fold decrease in transcript levels is observed for speB, but only during logarithmic growth. Mga had no measurable effect on the relative transcript abundance of FCT-region genes nra, cpa, and prtF2, each of which is critical for skin infection under certain conditions. Also, ska transcript levels were relatively unaffected by mga inactivation in strain Alab49.
Transcript levels of the FCT-region genes fctA and msmR also showed a lack of influence by Mga (Table 1). Also tested for changes by qRT-PCR was sclA, which is under direct regulation by Mga in some strains [36]. The level of sclA transcripts was reduced ~ 4- to 5-fold in the Δmga mutant following growth to mid-log phase, however, no effect on gene expression was detected in stationary phase cultures.
Restoration of transcript levels was examined following complementation of the Δmga mutant with the mga gene present on a plasmid. Three plasmids that differ in their upstream region were constructed, containing either no upstream sequences (pMga0), or 437 and 667 nt upstream of mga (pMga 437 and pMga667, respectively). The pMga0 construct, lacking the upstream promoter and autoregulatory sites, restored mga and scpA transcription to 20–25% of wt levels (Table 2). A more complete restoration of mga, pam and scpA transcription was demonstrated with both pMga437 and pMga667.
Table 2.
qRT-PCR findings on gene transcription for the Alab49 Δmga mutant transcomplemented with the mga gene.
| Transcript abundance relative to wt* | ||||
|---|---|---|---|---|
| Construct | Growth phase | mga | pam | scpA |
| Δmga | mid log | n.a. | 0.001 ± 0.001 | 0.033 ± 0.007 |
| Δmga ± pMga0 | mid log | 0.235 ± 0.119 | 0.66 ± 0.39 | 0.206 ± 0.129 |
| Δmga ± pMga437 | mid log | 1.69 ± 1.19 | 1.24 ± 0.74 | 1.86 ± 1.20 |
| Δmga ± pMga667 | mid log | 1.43 ± 0.69 | 1.09 ± 0.44 | 2.02 ± 0.43 |
mean average ± s.d., based on two RNA preparations, using two cDNA generated from each RNA.
Ratios < 0.5-fold or > 2-fold are highlighted in bold.
Based on the qRT-PCR findings, the PAM, FbaA, ScpA and SclA surface proteins and the secreted cysteine protease SpeB are potential contributors to Mga-mediated virulence at the skin. However, speB and sclA transcript levels were not affected by Mga to the same magnitude as the other genes, and were not altered during stationary phase growth.
2.3. Mga-related alterations in proteolytic activity
Bacterial-bound plasmin is generated by some strains of GAS through the interaction of the plasminogen activator streptokinase (Ska) with the plasminogen-binding M protein (PAM) in the presence of plasma. Bacterial-bound plasmin activity was compared for Alab49 wt and the Δmga mutant. Consistent with the effect of Mga on pam transcription, the Δmga mutant exhibited a large decrease in bacterial-bound plasmin activity, to the baseline levels observed for Δpam and Δska mutants (Figure 2).
Figure 2. Effect of Mga on bacterial-bound plasmin activity.
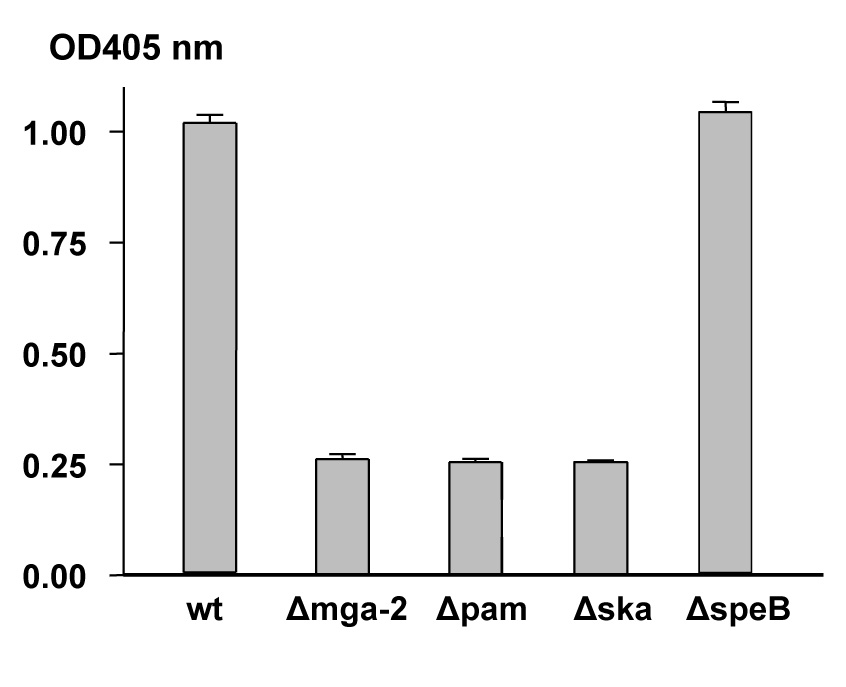
Bacterial-bound plasmin activity due to the combined action of PAM and Ska was measured for Alab49 wt and mutants following incubation with human plasmin. Mean average and s.d. are based on triplicate measurements.
The secreted cysteine protease SpeB is essential for skin infection by Alab49 in the humanized mouse, and classical skin strains tend to have high levels of secreted cysteine protease activity [20]. Although speB transcription is activated by Mga (Table 1), the effect is modest and observed during log phase but not stationary growth in enriched THY broth. The Δmga mutant displayed a marked decrease in secreted cysteine protease activity when compared to Alab49 wt, however, the magnitude of the loss was < 40% (Figure 3), indicating that ample activity remained.
Figure 3. Effect of Mga on secreted cysteine protease activity under nutrient limiting conditions.
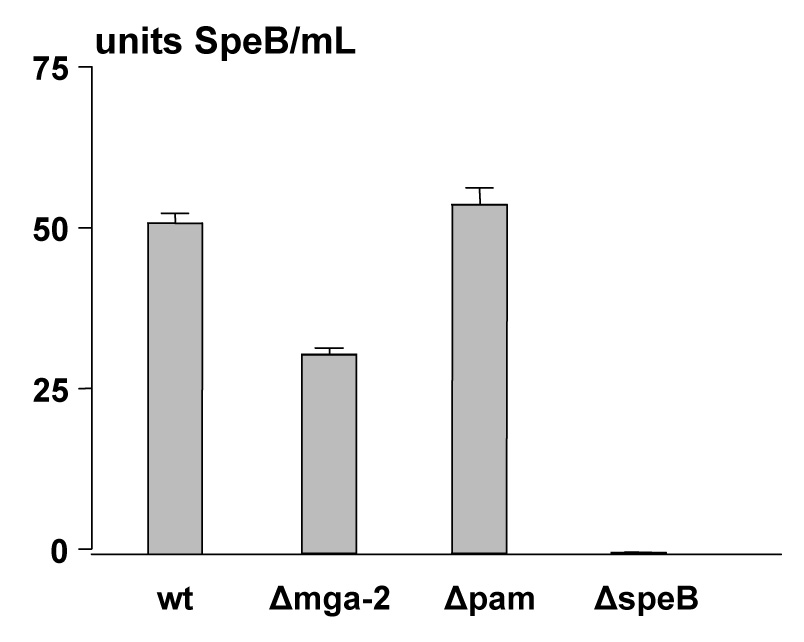
Secreted cysteine proteinase activity due to SpeB following growth in C-broth was measured for Alab49 wt and mutants using the azocasein substrate assay. The mean average OD600 for all cultures was 0.646 ± 0.017, indicating that bacterial cell density was highly even across all samples. Mean average and s.d. are based on triplicate measurements. Data shown are from a representative experiment. Combined experiments (6 data points per wt or mutant) show that the difference between wt and the Δmga mutant is highly significant (t < 0.001; unpaired t-test, 2-tailed).
A lack of impact of Mga on SpeB activity was evident in the degradation of the PrtF2 surface protein during stationary growth of the Δmga mutant (Figure 4). Previous findings with a ΔspeB mutant show that the complete degradation of PrtF2 is spared during stationary phase [22]. Here, the ΔspeB mutant yields extractable PrtF2 following growth to stationary phase (Figure 4, lane 6), whereas PrtF2 is absent from Alab49 wt and the Δmga and Δpam mutants (lanes, 2, 4 and 10). Also, there was no obvious difference by immunoblot among Alab49 wt versus the Δmga or Δpam mutant in the processing of the SpeB zymogen to the mature 28 kDa form [21] (data not shown). This latter finding suggests that indirect effects of Mga on surface protein expression (eg., PAM) do not influence SpeB maturation and enzymatic activity.
Figure 4. Loss of Mga does not spare PrtF2 from degradation.
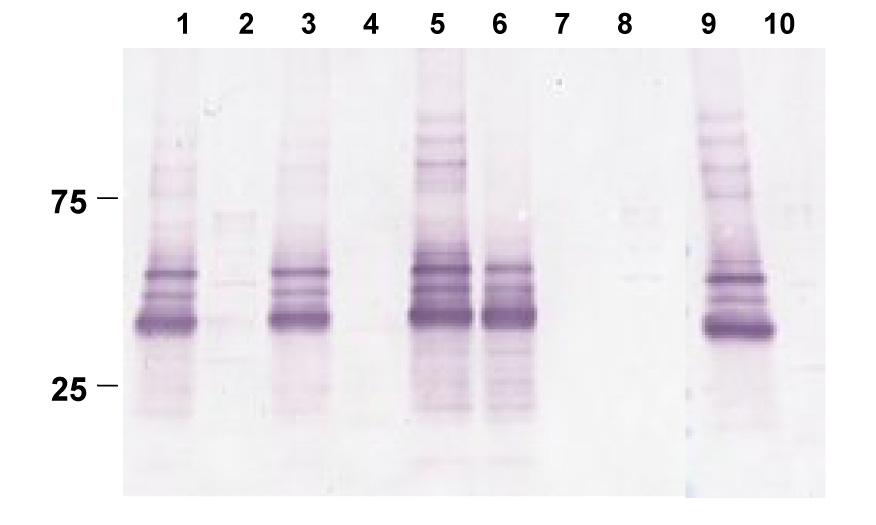
Mutanolysin extracts from logarithmic (lanes 1, 3, 5, 7) and stationary (lanes 2, 4, 6, 8) phase cultures, prepared in the absence of the protease inhibitor cocktail, are shown: Alab49 wt (lanes 1, 2), Δmga (lanes, 3, 4), ΔspeB (lanes 5, 6), ΔprtF2 (lanes 7, 8), and Δpam (lanes 9, 10). Immunoblot was reacted with rabbit antiserum prepared to rPrtF2. Molecular weight markers are shown (kDal).
2.4. Role of Mga in autoaggregation and growth on an abiotic surface
Bacterial aggregation is often the result of processes that can also lead to formation of microcolonies and biofilms within the natural host and/or on inanimate surfaces of environmental importance. GAS aggregation may promote virulence via increased adherence to epithelial cells or resistance to phagocytosis [37].
Autoaggregation was measured by a turbidity assay in which a decrease in the turbidity of a standing culture corresponds to an increase in bacterial aggregate formation. The Alab49 wt strain showed a steady decline in turbidity, decreasing ~ 75% by 6 h (Table 3). In sharp contrast, the Δmga mutant displayed very low levels of autoaggregation, and turbidity decreased only ~ 5%. The effect of Mga on aggregation may be mediated, at least in part, through PAM. The Δpam mutant had an average decrease in turbidity of ~ 40%, which was significantly different from Alab49 wt (Table 3), though not significantly different from the Δmga mutant (t = 0.38). The ΔspeB mutant displayed a significant increase in aggregation relative to Alab49 wt (Table 2). Since the expected effect of diminished SpeB activity in the Δmga mutant (Figure 3) is to counter the aggregation-promoting effects of PAM, an unidentified Mga-regulated gene product appears to contribute to the large loss of the autoaggregation phenotype in the Δmga mutant.
Table 3.
Bacterial autoaggregation in THY broth.
| Alab49 construct | avg. % turbidity (OD600nm) | No. of measures | t value ^ |
|---|---|---|---|
| ΔspeB | 7.64 | 2 | nd |
| Δcpa | 13.39 | 3 | nd |
| Δnra | 21.40 | 5 | NS |
| wt | 26.56 | 8 | n/a |
| Δpam | 69.04 | 4 | < 0.05 |
| ΔfctA | 88.17 | 6 | < 0.01 |
| ΔprtF2 | 95.03 | 5 | < 0.01 |
| Δmga | 95.64 | 6 | < 0.01 |
unpaired t-test (2-tailed), compared to wt
nd, not determined, n/a, not applicable; NS, not significant
The effect of mga transcomplementation on autoaggregation in the Δmga mutant was also examined (Table 4). Under conditions of static growth, the three plasmids harboring mga genes with different lengths of upstream sequences each led to a marked increase in autoaggregation, however, complete restoration of the wt phenotype was not achieved. Failure to completely restore the wt phenotype may be due to the lack of strong selection for plasmid retention in non-growing cultures.
Table 4.
Restoration of streptococcal autoaggregation in THY broth following complementation with a plasmid.
| Alab49 construct | Mean avg. % turbidity ± s.d. (OD600nm) * |
|---|---|
| Wt | 10.9 ± 5.0 |
| Δmga + pMga0 | 37.0 ± 2.3 |
| Δmga + pMga437 | 31.2 ± 10.6 |
| Δmga + pMga667 | 36.2 ± 15.6 |
| Δmga | 96.1 ± 1.8 |
Based on three or four experimental replicates.
GAS can form 3-dimensional biofilm structures [38–40]. A microtiter well assay used to assess biofilm-forming capacity in Staphylococcus aureus [41] was adapted to study GAS. Addition of 1% glucose to BHI broth consistently yielded higher levels of bacterial growth in polystyrene wells for GAS (data not shown), similar to findings for S. aureus. Comparison of the Δmga mutant to Alab49 wt provides support for a significant role of Mga in promoting growth on an abiotic surface (Table 5). However, loss of PAM reveals no effect (without glucose) or a slight enhancing effect (with glucose) on growth, relative to wt. Thus, an Mga-regulated gene product other than PAM appears to explain the biofilm-like phenotype due to Mga. SpeB is an unlikely candidate because the ΔspeB mutant shows a significant enhancement in biofilm formation relative to Alab49 wt (Table 5). This latter finding may be best explained by a model whereby SpeB degrades a GAS protein that inhibits bacterial growth on an abiotic surface.
Table 5.
Bacterial growth on an abiotic surface
| Alab49 construct | Growth in BHI | Growth in BHI-glucose | ||
|---|---|---|---|---|
| % average | t-value ^ | % average | t-value | |
| Δmga | 5.0 | < 0.01 | 41.1 | < 0.01 |
| ΔprtF2 | 13.0 | < 0.01 | 22.1 | < 0.01 |
| ΔfctA | 17.8 | < 0.01 | 27.0 | < 0.01 |
| Δcpa | 94.5 | NS | 110.2 | NS |
| wt # | 100 | n/a | 100 | n/a |
| Δpam * | 107.4 | NS | 115.7 | 0.046 |
| Δnra | 109.5 | NS | 129.4 | 0.012 |
| ΔspeB | 161.6 | < 0.01 | 127.0 | < 0.01 |
unpaired t-test (2-tailed), compared to wt
Growth of Alab49 wt is set to 100%
Based on 2 experiments (8 replicates each)
In summary, Mga-regulated genes are essential for the autoaggregation and biofilm phenotypes of strain Alab49. However, neither PAM nor SpeB appear to fully account for the Mga-mediated effects.
2.5. Relationship between virulence and autoaggregation or biofilm-like structures
Several FCT-region genes have a key role in infection at the skin by strain Alab49 [22, 35], however, their transcription is not affected by Mga (Table 1). Furthermore, the Δmga mutant shows equivalent levels of the mutanolysin-extracted pilus heteropolymer containing Cpa, FctA and FctB, as compared to Alab49 wt (data not shown). In order to gain broader insight on the possible relationships between bacterial autoaggregation, growth on an abiotic surface and skin pathogenesis, previously characterized FCT-region gene mutants were evaluated.
The Δnra mutant, which is attenuated for virulence at the skin [35] was highly similar to Alab49 wt in autoaggregation and biofilm formation in the absence of glucose (Table 3 and Table 5). The Δcpa mutant, having attenuated virulence with a log phase inoculum [22], was similar to wt in biofilm-forming capacity with or without glucose, and had a slight increase in autoaggregation. In contrast, the ΔprtF2 mutant, which is also attenuated virulence at the skin (log phase) [22], was significantly diminished in both autoaggregation and biofilm-forming capacity. The ΔfctA mutant was similar to the ΔprtF2 mutant in autoaggregation and growth on an abiotic surface, but differs in that it retains full virulence in the humanized mouse model [22].
Taken together, the 7 isogenic mutants of Alab49 display a wide range in their degree of autoaggregation and growth on abiotic surface, with wt displaying intermediate values (Table 3 and Table 5). Among the Alab49 mutants and wt there is a high negative correlation between turbidity in broth culture and growth on polystyrene wells in either the presence or absence of glucose (r = −0.87 and −0.88, respectively; Pearson’s correlation coefficient). Thus, autoaggregation and biofilm-forming capacity are highly correlated phenotypes that likely measure related biological phenomena. Aggregation of planktonic cells may be a precondition for biofilm formation [40].
The correspondence between virulence at the skin and bacterial aggregation and/or biofilm formation is less clear cut. The Δmga and ΔprtF2 mutants are decreased in both measures relative to wt, however, several other avirulent mutants (ΔspeB, Δnra, Δcpa) are equivalent to wt or enhanced in terms of their aggregation/biofilm phenotype. For the ΔfctA mutant, virulence is unchanged, yet aggregation and biofilm formation is significantly diminished. Thus, there is no obvious correspondence between virulence at the skin (wt and ΔfctA, versus Δmga, ΔspeB, Δpam, Δnra, Δcpa and ΔprtF2), and bacterial autoaggregation or growth on an abiotic surface.
3. DISCUSSION
The humanized mouse model for GAS skin infection mimics several key features of human disease. Findings of this report on Mga can be combined with data from previous studies [19–22, 35] to generate an integrated model for GAS pathogenesis at the skin (Figure 5). Virulence requires Mga, Nra and SpeB following inoculation with either log or stationary phase cultures, whereas Cpa and PrtF2 are required for log phase inoculums only. PAM and Ska are required for virulence with stationary phase inoculums, with log inoculums not tested. The main pilus structural protein FctA is not essential under either growth condition.
Figure 5. Summary of phenotypes associated with Mga- and Nra-regulated genes.
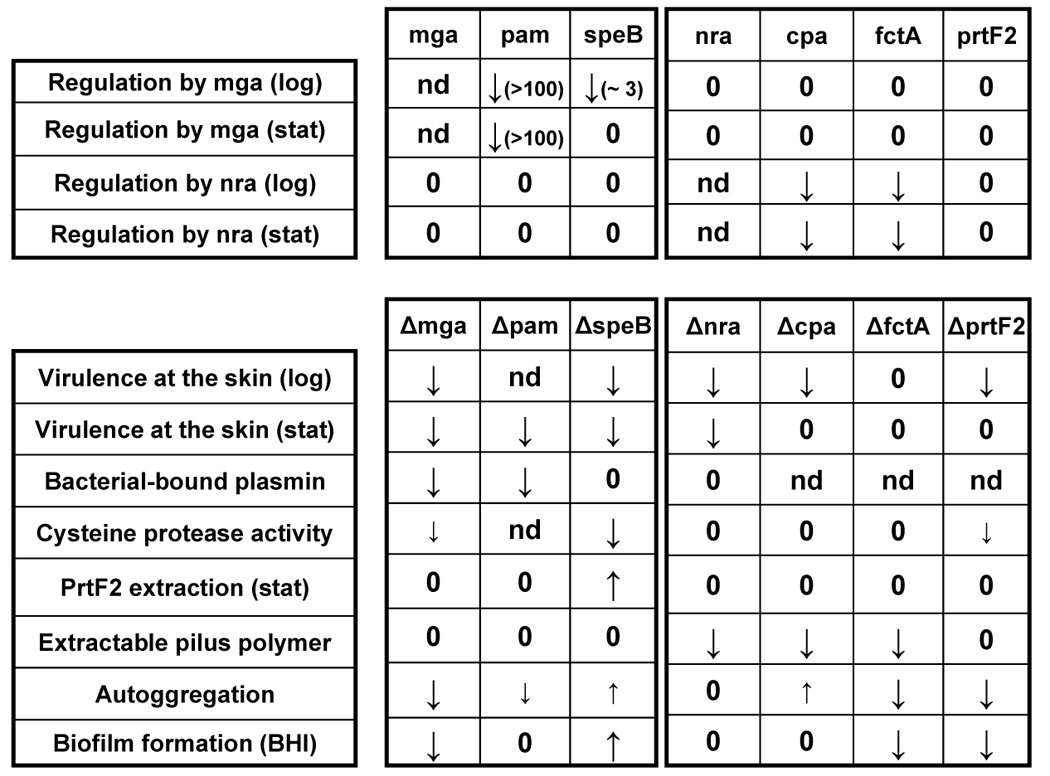
The findings of this report on Mga are summarized and combined with data from other studies [19–22, 35]. Changes in mutant relative to wt are increased, decreased or zero (no change).
Mga activates transcription of pam and speB, and all 3 products - Mga, PAM, SpeB - are necessary for skin virulence. However, the regulatory effect of Mga on SpeB is slight. Most GAS skin strains have high levels of SpeB activity, and the activity remaining in the Alab49 Δmga mutant is comparable to levels found in other virulent skin strains [20]. PrtF2 is degraded by SpeB in both Alab49 wt [22] and the Δmga mutant during stationary phase, indicating that loss of Mga does not prevent loss of PrtF2 surface expression. Taken together, the role of Mga in skin virulence appears to be largely independent of SpeB activity.
Data are highly consistent with a critical role for PAM in Mga-mediated virulence at the skin. In the Δmga mutant, pam transcription is decreased > 100-fold, and bacterial-bound plasmin activity is reduced to levels equivalent to that in the Δpam and Δska mutants. Mga has no measurable effect on ska transcript levels, adding support for a role of PAM in mediating Mga effects. PAM helps to prevent phagocytosis of the organism in the absence of opsonization [21], in addition to promoting fibrinolysis in cooperation with Ska.
In other GAS strains examined, numerous genes are under Mga control, including sclA [32]. Although PAM is integral to Mga-mediated effects at the skin, it is possible that additional Mga-regulated genes, such as sclA and fbaA, contribute to Alab49 virulence. When tested with a stationary phase inoculum, the Δpam mutant was attenuated relative to Alab49 wt, but only 5 of the 9 skin grafts showed a decrease in cfus at 7 d post-inoculation [21], compared to 100% inoculated with the Δmga mutant. However, the net change in cfus recovered from the skin for the Δmga versus Δpam mutant is not statistically significant (data not shown). Although there is no direct evidence that additional Mga-regulated genes are essential for virulence in the humanized mouse, the possibility cannot yet be ruled out.
The Alab49 strain is an emm pattern D skin strain specialist, harboring the mga-2 lineage allele and lacking sof [12, 42]. Unlike the well-studied M49 strain, in which Mga represses nra [33, 43], there is no evidence that Mga from Alab49 (M53) affects nra transcription. This result parallels the findings on M1, M4 and M6 strains, in which transcript levels of rofA - an ortholog of nra - are unaffected by Mga [32]. Combined with findings on other Alab49 mutants (Figure 5), data show that several essential virulence genes are regulated by Mga or Nra, but not by both. Thus, any coordinated response during skin infection likely operates at a higher level of transcriptional control.
The SpeB pathway essential for virulence at the skin appears to be mostly independent of both Mga and Nra (Figure 5), suggestive of at least 3 discrete pathways necessary for virulence at the skin. A growth phase-dependent regulatory network was proposed for GAS involving 3 stages, dominated by Mga, Nra (or RofA) and the response regulator Rgg/RopB (which activates speB) [44], and having maximal expression at log, early stationary and late stationary phase, respectively [45]. In the growth phase model, the Mga, Nra and SpeB stages correspond to bacterial colonization, persistence and spread, respectively.
The microenvironment of the wounded human skin epithelium undergoes a dramatic change in composition as infection progresses. Based on histopathology, the early stage of infection (48 h post-inoculation) appears to be nutrient-deficient with little bacterial growth, but shifts to a nutrient-rich state (96 h) following extravasation of neutrophils dragging plasma to the epidermal surface, and coinciding with bacterial growth [19, 21]. It can be argued that Mga is critical during the exudate-rich stage of skin infection, when the antiphagocytic property of PAM [21] is key to survival. Cpa expression is activated by Nra, but its requirement for skin virulence is transient because Cpa is essential only for log phase inoculums (Figure 5). The transient nature of the Cpa requirement is best explained by a critical function that operates soon after skin inoculation. An early stage of infection is also consistent with the presumptive role of Cpa as a collagen-binding protein mediating initial adherence to the epithelium [46]. Taken together, superficial skin infection by Alab49 appears to deviate from the proposed growth phase-oriented regulatory network model [33] in terms of the relative order of Nra- and Mga-mediated events.
For both the Δmga and ΔprtF2 mutants of strain Alab49, attenuated virulence at the skin in the humanized mouse corresponds to decreased autoaggregation and growth on an abiotic surface. There is pathologic evidence for biofilm-like microcolonies in impetigo lesions [47]. In the humanized mouse, large bacterial aggregates are observed at the outer layer of the purulent exudate [19]. However, since FctA is required for aggregation and biofilm-like growth by Alab49, but is not necessary for bacterial reproduction at the skin [22], it stands to reason that the aggregation- and biofilm-related phenotypes are not essential for virulence. Seemingly parallel findings lie in the different gene expression patterns for communities of GAS forming 3-dimensional biofilms versus deep tissue infection in the zebrafish [39].
The finding on the non-essential nature of aggregates and biofilms to virulence at the skin raises the question of whether the bacterial cell-to-cell interactions provide a long-term survival advantage. GAS are characterized by relatively high rates of genetic recombination [48, 49], and although the mechanisms by which horizontal gene transfer occurs in GAS are not well-understood, there is mounting evidence that bacteria population density is coupled to genetic exchange in GAS via quorum sensing [38, 50]. From an ecological perspective, it is reasonable to speculate that the cell-to-cell interactions mediated by Mga, FctA and PrtF2 play a critical role in promoting the horizontal gene exchange.
The requirement for Mga and FctA in autoaggregation and/or biofilm-like formation by Alab49 confirms findings on several other GAS strains [39, 40]. Because the Δpam mutant does not exhibit a complete loss in phenotype, unlike the Δmga mutant, additional Mga-regulated genes appear to have a role; scpA and fbaA are good candidates. The finding that the Δnra mutant shows no loss in autoaggregation or biofilm-forming capacity, yet fctA expression is severely diminished [35], indicates that other Nra-regulated genes probably compensate for the loss of FctA. Since Mga has no measurable effect on the expression of FCT-region genes, the bacterial cell-to-cell interactions appear to arise by multiple, independent mechanisms.
4. CONCLUSIONS
The transcriptional regulator Mga is essential for superficial infection at the skin by GAS strain Alab49. The PAM surface protein is a strong candidate for mediating Mga-dependent effects at the skin. Although Mga is critical for autoaggregation and biofilm-like formation, the bacterial cell-to-cell interaction phenotypes do not appear to be essential for skin infection.
5. EXPERIMENTAL MATERIALS AND METHODS
5.1. Bacterial culture
Streptococci were grown at 30 or 37°C with 5% CO2 in Todd-Hewitt broth supplemented with 1% yeast extract (THY), unless indicated otherwise. Bacterial growth was monitored at OD600 nm.
5.2 Mutant construction
Inactivation of mga and ska in Alab49 was achieved by allelic exchange mutagenesis following transformation of bacteria with purified linear DNA containing the kanamycin resistance gene (aphA3) flanked by sequences upstream and downstream of the target gene, by previously described methods [22]. Transformants were selected on THY-blood agar plates containing 500 µg/ml of kanamycin, and evaluated for replacement of the target gene by PCR-based mapping and nt sequence determination. The Δmga and Δska mutants had growth curves identical to that of Alab49 wt. Other mutants used were previously described [20–22, 35].
Transcomplementation of the Δmga mutant was achieved using pDCerm [51] containing mga or mga plus upstream sequences, inserted at the KpnI-EcoRI site. Cloned inserts were generated by PCR amplification using the oligonucleotide primer 5’-GCA TAC GAA TTC CTA TGA TGA TGT TGC TTG-3’ paired with either 5’-ACG TCA GGT ACC ATG AAG TTA ATG CAT GTA AG-3’, 5’-ACG TCA GGT ACC TCA AGA GCT AAT GTT GGT G-3’ or 5’-ACG TCA GGT ACC AGT AAT AGG TCA AAT AAT CTT CC-3’ to generate amplicons containing mga plus 0, 437 or 667 nt upstream sequences, respectively. Ligation mixtures were used to transform the Δmga mutant and were selected using erythromycin (10 µg/ml).
5.3. Humanized mouse model for impetigo
The hu-skin SCID mouse model for streptococcal impetigo was implemented as previously described in extensive detail [19–22]. Briefly, human neonatal foreskin was engrafted onto the hind flanks of C.B.-17 scid mice, which fail to reject the xenografts. Healed skin grafts were gently scratched with a scalpel blade and inoculated with 50 µl of bacteria in THY broth at 37°C. The inoculated bacteria had been freshly grown to mid-logarithmic or stationary phase and diluted as appropriate. The actual inoculum doses were ascertained by serial dilutions performed in duplicate and the number of CFUs averaged. Mid-logarithmic phase was defined as the point of ~ half-maximal OD600. Stationary phase cultures were incubated for 24 hr. Inoculated skin grafts were occluded with a bandage. At 7 d post-inoculation, the human skin grafts were surgically removed from mice and weighed. A weighed graft was evaluated for the number of CFUs released following a vigorous vortex, with serial dilutions performed in duplicate.
5.4. Quantitative real time-PCR (qRT-PCR)
For purification of RNA, bacteria were grown overnight in THY broth at 37°C, then diluted 1:100 in fresh THY broth and grown to mid-logarithmic or stationary phase. Total RNA was extracted using the RNAprotect RNA stabilization reagent (Qiagen). Bacteria were harvested by mixing 1 volume (2.5 ml) of culture with 2 volumes of RNAprotect, centrifuged and the pellet was resuspended in RNAse-free Tris-EDTA buffer containing lysozyme (2 mg/ml), mutanolysin (2.5 U/µl) and proteinase K (60 mAU/ml), and incubated at room temperature for 15 min; cells were lysed by adding Qiazol lysis reagent preheated at 65°C, followed by chloroform extraction. The aqueous phase containing RNA was purified using the RNeasy kit (Qiagen) according to the manufacturer’s instructions. Samples were treated with DNAse I using the RNAse-free DNAse set (Qiagen) to remove potential traces of DNA in the sample; the absence of contaminating DNA was verified by failure to amplify the purified RNA samples prior to cDNA synthesis, using Taq polymerase and oligonucleotide primers targeting recA. The A260/A280 ratio of each RNA sample was measured to determine concentration and assess purity (i.e., ratio > 1.8). cDNA was synthesized from 1 µg RNA using the SuperScript III First-Strand Synthesis Supermix for qRT-PCR with random oligonucleotide primers (Invitrogen) according to the manufacturer’s instructions. RT-PCR was performed with the SYBR GreenER qPCR SuperMix on 96-well MicroAmp optical reaction plates (Applied Biosystems) using the ABI Prism 7900 HT Sequence Detection System (Applied Biosystems). Primers for RT-PCR (Table S1) were designed to amplify internal regions within the ORFs of selected genes. The recA gene was used as an internal reference transcription control to normalize expression data for each target gene. Each gene target was tested in duplicate from ≥ 3 RNA templates prepared from independent bacterial cultures, unless indicated otherwise. Relative expression of each gene was determined by the 2−(ΔΔCT) method [52]. Briefly, the average cycle threshold number (Ct) of each target gene was normalized to the Ct value of the recA gene for each experiment, and the difference expressed as ΔCt (ΔCt=Cttarget gene-CtrecA). The relative expression ratios for each gene in each construct were calculated as the product of 2−(ΔΔCT), in which ΔΔCt = meanΔCtmutant-meanΔCtwt. Differences > 2-fold or < 0.5-fold in transcript abundance is chosen as the threshold value for alterations likely to be biologically significant.
5.5. Immunoblots
Cell wall extracts of GAS were prepared using mutanolysin as described [22]; cells were harvested following growth at 30°C to mid-logarithmic phase or stationary phase (16 hr). SDS-PAGE was performed on gradient gels (4 to 15% acrylamide) under reducing conditions. Rabbit sera raised to recombinant fusion polypeptide [22] was used at a dilution of 1:1000.
5.6. Bacterial bound plasmin activity
The activation of human plasminogen on the surface of bacterial cells was determined by a method adapted from [53]. Overnight cultures grown in THY broth were washed in PBS and resuspended in one-tenth of the original volume; 100 µl of concentrated cells, equivalent to ~ 108 CFUs, was added to a mixture of 2.8 ml THY broth and 1.2 ml fresh human plasma and incubated at 37°C for 1 h. Reactions were terminated by centrifugation at 4°C. The bacterial pellets were washed in ice-cold PBS containing 0.1% Tween 20 and placed on ice. Plasmin activity associated with the bacteria was measured using a method adapted from [54]. Each pellet was incubated in 100 µl of plasmin substrate solution, prepared by mixing 2 volumes of chromogenic substrate H-D-Val-Leu-Lys-ρ-nitroanilide (S2251; Sigma) stock solution (5 mg/ml in water) with 3 volumes of 32 mM Tris (pH 7.5)-1.77 M NaCl, solution for 15 min at 37°C.
5.7. Cysteine proteinase activity
Measurement of secreted cysteine proteinase activity in broth culture supernatants was determined by an azocasein assay as described [22] following bacterial growth in C-broth medium for 20 h at 37°C. To ensure that differences in enzymatic activity were not attributable to differences in bacterial cell density, the OD600 of each culture was assessed. Activity was calculated based on a value of A366 = 0.155 as being equivalent to 10 activity units (U) per mL of culture supernatant [20].
5.8. Hyaluronic acid (HA) content
The HA content of GAS, attributable to the polysaccharide capsule, was measured according to previously described methods [21].
5.9. Autoaggregation assay
GAS were grown 16 h in THY broth (15 mL) at 37°C in 18 × 150 mm glass tubes. After 16 h, cultures were thoroughly mixed, kept undisturbed at room temperature, and the OD600 nm measured at several time intervals up to 6 h; the light path was 5 cm from the tube bottom. The % turbidity remaining is based on the OD600 nm measure taken at the zero time point, immediately following thorough mixing of overnight liquid broth cultures (100% turbidity). The average mean values from independent experiments are calculated. For select cultures, cfu measurements of broth cultures at 6 h, taken from just below the meniscus, confirmed that the poorly aggregating mutants yield ~10-fold higher numbers of cfus compared to the wt, as determined by serial dilution and plating (data not shown).
5.10. Polystyrene biofilm assay
A polystyrene microtiter plate assay developed for measuring biofilm-forming capacity of Staphylococcus aureus [41] was used to test Alab49 wt and its isogenic mutants. Overnight cultures of GAS grown in brain heart infusion (BHI) broth at 37°C with 5% CO2 were diluted 1:200 in fresh BHI broth with or without 1% glucose; 100 µl of the suspension was used to inoculate 96-well Nunclon Delta plates. After 20 h of additional incubation, culture supernatant was removed by aspiration, wells were gently washed, the adherent bacterial film was fixed by air drying, and wells stained with crystal violet. Each mutant was tested in eight replicate wells, and the average mean calculated for OD595 nm measurements. The experiment was repeated 3 times, yielding 24 data points per sample. Background levels of absorbance were established with wells containing broth only.
5.11. Statistical analysis
Statistical significance was calculated using the parametric unpaired t-test and the non-parametric Mann Whitney U-test (two-tailed), which are conservative and may slightly underestimate the significance of differences between groups having a small sample size. Pearson’s correlation coefficient was also used. Calculations were implemented in Excel and SPSS.
Supplementary Material
ACKNOWLEDGEMENTS
We thank Davida Smyth and Eoghan O'Neill for advice on the biofilm assay; Hervé Tettelin, Nikhil Kumar and David Riley for providing Alab49 genome sequence data used in the experimental design; Victor Nizet for providing the plasmid pDCerm; and Jing Sun, Mayra Ithier-Cruz and Sai Patil for technical assistance. This work was supported by NIH grant R01-AI053826.
Footnotes
Publisher's Disclaimer: This is a PDF file of an unedited manuscript that has been accepted for publication. As a service to our customers we are providing this early version of the manuscript. The manuscript will undergo copyediting, typesetting, and review of the resulting proof before it is published in its final citable form. Please note that during the production process errors may be discovered which could affect the content, and all legal disclaimers that apply to the journal pertain.
REFERENCES
- 1.Carapetis JR, Steer AC, Mulholland EK, Weber M. The global burden of group A streptococcal diseases [Review] The Lancet Infectious Diseases. 2005;5:685–694. doi: 10.1016/S1473-3099(05)70267-X. [DOI] [PubMed] [Google Scholar]
- 2.Wannamaker LW. Differences between streptococcal infections of the throat and of the skin. N. Engl. J. Med. 1970;282:23–31. doi: 10.1056/NEJM197001012820106. [DOI] [PubMed] [Google Scholar]
- 3.Bessen DE, Carapetis JR, Beall B, et al. Contrasting molecular epidemiology of group A streptococci causing tropical and non-tropical infections of the skin and throat. J. Infect. Dis. 2000;182:1109–1116. doi: 10.1086/315842. [DOI] [PubMed] [Google Scholar]
- 4.Dicuonzo G, Gherardi G, Lorino G, et al. Group A streptococcal genotypes from pediatric throat isolates in Rome, Italy. J. Clin. Microbiol. 2001;39:1687–1690. doi: 10.1128/JCM.39.5.1687-1690.2001. [DOI] [PMC free article] [PubMed] [Google Scholar]
- 5.Sakota V, Fry AM, Lietman TM, Facklam RR, Li ZY, Beall B. Genetically diverse group A streptococci from children in Far-Western Nepal share high genetic relatedness with isolates from other countries. Journal of Clinical Microbiology. 2006;44:2160–2166. doi: 10.1128/JCM.02456-05. [DOI] [PMC free article] [PubMed] [Google Scholar]
- 6.Shulman S. Group A streptococcal pharyngitis serotype surveillance in North America, 2000–2002. Clin. Infect. Dis. 2004;39:325–332. doi: 10.1086/421949. [DOI] [PubMed] [Google Scholar]
- 7.Smeesters PR, Vergison A, Campos D, de Aguiar E, Deyi VY, Van Melderen L. Differences between Belgian and Brazilian Group A Streptococcus Epidemiologic Landscape. PLoS ONE. 2006;1:e10. doi: 10.1371/journal.pone.0000010. [DOI] [PMC free article] [PubMed] [Google Scholar]
- 8.McDonald MI, Towers RJ, Andrews R, et al. The dynamic nature of group A streptococcal epidemiology in tropical communities with high rates of rheumatic heart disease. Epidemiol Infect. 2007:1–11. doi: 10.1017/S0950268807008655. [DOI] [PMC free article] [PubMed] [Google Scholar]
- 9.Bessen DE, McGregor KF, Whatmore AM. Relationships between emm and multilocus sequence types within a global collection of Streptococcus pyogenes. doi: 10.1186/1471-2180-8-59. submitted. [DOI] [PMC free article] [PubMed] [Google Scholar]
- 10.Tewodros W, Kronvall G. M protein gene (emm type) analysis of group a beta-hemolytic streptococci from Ethiopia reveals unique patterns. Journal of Clinical Microbiology. 2005;43:4369–4376. doi: 10.1128/JCM.43.9.4369-4376.2005. [DOI] [PMC free article] [PubMed] [Google Scholar]
- 11.Hondorp ER, McIver KS. The Mga virulence regulon: infection where the grass is greener. Mol Microbiol. 2007;66:1056–1065. doi: 10.1111/j.1365-2958.2007.06006.x. [DOI] [PubMed] [Google Scholar]
- 12.Bessen DE, Manoharan A, Luo F, Wertz JE, Robinson DA. Evolution of transcription regulatory genes is linked to niche specialization in the bacterial pathogen Streptococcus pyogenes. Journal of Bacteriology. 2005;187:4163–4172. doi: 10.1128/JB.187.12.4163-4172.2005. [DOI] [PMC free article] [PubMed] [Google Scholar]
- 13.Yung DL, McIver KS, Scott JR, Hollingshead SK. Attenuated expression of the mga virulence regulon in an M serotype 50 mouse-virulent group A streptococcal strain. Infect Immun. 1999;67:6691–6694. doi: 10.1128/iai.67.12.6691-6694.1999. [DOI] [PMC free article] [PubMed] [Google Scholar]
- 14.Limbago B, McIver KS, Penumalli V, Weinrick B, Scott JR. Restoration of Mga function to a Streptococcus pyogenes strain (M Type 50) that is virulent in mice. Infect. Immun. 2001;69:1215–1220. doi: 10.1128/IAI.69.2.1215-1220.2001. [DOI] [PMC free article] [PubMed] [Google Scholar]
- 15.Virtaneva K, Porcella SF, Graham MR, et al. Longitudinal analysis of the group A Streptococcus transcriptome in experimental pharyngitis in cynomolgus macaques. Proc Natl Acad Sci U S A. 2005;102:9014–9019. doi: 10.1073/pnas.0503671102. [DOI] [PMC free article] [PubMed] [Google Scholar]
- 16.Graham MR, Virtaneva K, Porcella SF, et al. Analysis of the transcriptome of group A Streptococcus in mouse soft tissue infection. Am J Pathol. 2006;169:927–942. doi: 10.2353/ajpath.2006.060112. [DOI] [PMC free article] [PubMed] [Google Scholar]
- 17.Watson RF, Rothbard S, Swift HF. Type-specific protection and immunity following intranasal inoculation of monkeys with group A hemolytic streptococci. J.Exp.Med. 1946;84:127–142. [PubMed] [Google Scholar]
- 18.Ashbaugh CD, Moser TJ, Shearer MH, White GL, Kennedy RC, Wessels MR. Bacterial determinants of persistent throat colonization and the associated immune response in a primate model of human group A streptococcal pharyngeal infection. Cell Microbiol. 2000;2:283–292. doi: 10.1046/j.1462-5822.2000.00050.x. [DOI] [PubMed] [Google Scholar]
- 19.Scaramuzzino DA, McNiff JM, Bessen DE. Humanized in vivo model for streptococcal impetigo. Infect. Immun. 2000;68:2880–2887. doi: 10.1128/iai.68.5.2880-2887.2000. [DOI] [PMC free article] [PubMed] [Google Scholar]
- 20.Svensson MD, Scaramuzzino DA, Sjobring U, Olsen A, Frank C, Bessen DE. Role for a secreted cysteine proteinase in the establishment of host tissue tropism by group A streptococci. Mol. Microbiol. 2000;38:242–253. doi: 10.1046/j.1365-2958.2000.02144.x. [DOI] [PubMed] [Google Scholar]
- 21.Svensson MD, Sjobring U, Luo F, Bessen DE. Roles of the plasminogen activator streptokinase and plasminogen-associated M protein in an experimental model for streptococcal impetigo. Microbiology. 2002;148:3933–3945. doi: 10.1099/00221287-148-12-3933. [DOI] [PubMed] [Google Scholar]
- 22.Lizano S, Luo F, Bessen DE. Role of streptococcal T-antigens in superficial skin infection. J. Bacteriol. 2007;189:1426–1434. doi: 10.1128/JB.01179-06. [DOI] [PMC free article] [PubMed] [Google Scholar]
- 23.Boyle MD, Raeder R, Flosdorff A, Podbielski A. Role of emm and mrp genes in the virulence of group A streptococcal isolate 64/14 in a mouse model of skin infection. J Infect Dis. 1998;177:991–997. doi: 10.1086/515241. [DOI] [PubMed] [Google Scholar]
- 24.Bunce C, Wheeler L, Reed G, Musser J, Barg N. Murine model of cutaneous infection with gram-positive cocci. Infect. Immun. 1992;60:2636–2640. doi: 10.1128/iai.60.7.2636-2640.1992. [DOI] [PMC free article] [PubMed] [Google Scholar]
- 25.Dajani AS, Wannamaker LW. Experimental infection of the skin in the hamster simulating human impetigo. I. Natural history of the infection. J.Infect.Dis. 1970;122:196–204. doi: 10.1093/infdis/122.3.196. [DOI] [PubMed] [Google Scholar]
- 26.Heath A, DiRita VJ, Barg NL, Engleberg NC. A two-component regulatory system, CsrR-CsrS, represses expression of three Streptococcus pyogenes virulence factors, hyaluronic acid capsule, streptolysin S, and pyrogenic exotoxin B. Infect. Immun. 1999;67:5298–5305. doi: 10.1128/iai.67.10.5298-5305.1999. [DOI] [PMC free article] [PubMed] [Google Scholar]
- 27.Lever W, Schaumberg-Lever G. Histopathology of the Skin. 7th ed. Philadelphia: J.B. Lippincott Co; 1990. [Google Scholar]
- 28.Montgomery H. Dermatopathology. New York: Harper & Row; 1967. [Google Scholar]
- 29.Murphy G. Dermatopathology: a practical guide to common disorders. W.B. Saunders; 1995. [Google Scholar]
- 30.Kratovac Z, Manoharan A, Luo F, Lizano S, Bessen DE. Population Genetics and Linkage Analysis of Loci Within the FCT Region of Streptococcus pyogenes. J. Bacteriol. 2007;189:1299–1310. doi: 10.1128/JB.01301-06. [DOI] [PMC free article] [PubMed] [Google Scholar]
- 31.Caparon MG, Geist RT, Perez-Casal J, Scott JR. Environmental regulation of virulence in group A streptococci: transcription of the gene encoding M protein is stimulated by carbon dioxide. J. Bacteriol. 1992;174:5693–5701. doi: 10.1128/jb.174.17.5693-5701.1992. [DOI] [PMC free article] [PubMed] [Google Scholar]
- 32.Ribardo DA, McIver KS. Defining the Mga regulon: Comparative transcriptome analysis reveals both direct and indirect regulation by Mga in the group A streptococcus. Mol Microbiol. 2006;62:491–508. doi: 10.1111/j.1365-2958.2006.05381.x. [DOI] [PubMed] [Google Scholar]
- 33.Kreikemeyer B, McIver KS, Podbielski A. Virulence factor regulation and regulatory networks in Streptococcus pyogenes and their impact on pathogen-host interactions. Trends in Microbiology. 2003;11:224–232. doi: 10.1016/s0966-842x(03)00098-2. [DOI] [PubMed] [Google Scholar]
- 34.Telford J, Barocchi M, Margarit I, Rappuoli R, Grandi G. Pili in gram-positive pathogens. Nature Reviews Microbiology. 2006;4:509–519. doi: 10.1038/nrmicro1443. [DOI] [PubMed] [Google Scholar]
- 35.Luo F, Lizano S, Bessen DE. Heterogeneity in the polarity of Nra regulatory effects on streptococcal pilus gene transcription and virulence. Infect. Immun. 2008 doi: 10.1128/IAI.01567-07. in press. [DOI] [PMC free article] [PubMed] [Google Scholar]
- 36.Almengor AC, McIver KS. Transcriptional activation of sclA by Mga requires a distal binding site in Streptococcus pyogenes. J Bacteriol. 2004;186:7847–7857. doi: 10.1128/JB.186.23.7847-7857.2004. [DOI] [PMC free article] [PubMed] [Google Scholar]
- 37.Frick IM, Morgelin M, Bjorck L. Virulent aggregates of Streptococcus pyogenes are generated by homophilic protein-protein interactions. Mol Microbiol. 2000;37:1232–1247. doi: 10.1046/j.1365-2958.2000.02084.x. [DOI] [PubMed] [Google Scholar]
- 38.Lembke C, Podbielski A, Hidalgo-Grass C, Jonas L, Hanski E, Kreikemeyer B. Characterization of biofilm formation by clinically relevant serotypes of group A streptococci. Applied & Environmental Microbiology. 2006;72:2864–2875. doi: 10.1128/AEM.72.4.2864-2875.2006. [DOI] [PMC free article] [PubMed] [Google Scholar]
- 39.Cho KH, Caparon MG. Patterns of virulence gene expression differ between biofilm and tissue communities of Streptococcus pyogenes. Molecular Microbiology. 2005;57:1545–1556. doi: 10.1111/j.1365-2958.2005.04786.x. [DOI] [PubMed] [Google Scholar]
- 40.Manetti AG, Zingaretti C, Falugi F, et al. Streptococcus pyogenes pili promote pharyngeal cell adhesion and biofilm formation. Mol Microbiol. 2007;64:968–983. doi: 10.1111/j.1365-2958.2007.05704.x. [DOI] [PubMed] [Google Scholar]
- 41.Kennedy CA, O'Gara JP. Contribution of culture media and chemical properties of polystyrene tissue culture plates to biofilm development by Staphylococcus aureus. Journal of Medical Microbiology. 2004;53:1171–1173. doi: 10.1099/jmm.0.45764-0. [DOI] [PubMed] [Google Scholar]
- 42.Bessen DE, Sotir CM, Readdy TL, Hollingshead SK. Genetic correlates of throat and skin isolates of group A streptococci. J. Infect. Dis. 1996;173:896–900. doi: 10.1093/infdis/173.4.896. [DOI] [PubMed] [Google Scholar]
- 43.Kreikemeyer B, Nakata M, Koller T, et al. The Streptococcus pyogenes serotype M49 Nra-Ralp3 Transcriptional Regulatory Network and its Control on Virulence Factor Expression from the Novel ERES Pathogenicity Region. Infect Immun. 2007 doi: 10.1128/IAI.00175-07. [DOI] [PMC free article] [PubMed] [Google Scholar]
- 44.Lyon W, Gibson C, Caparon M. A role for Trigger Factor and an Rgg-like regulator in the transcription, secretion and processing of the cysteine protease of Streptococcus pyogenes. EMBO J. 1998;17:6263–6275. doi: 10.1093/emboj/17.21.6263. [DOI] [PMC free article] [PubMed] [Google Scholar]
- 45.Kreikemeyer B, Boyle MD, Buttaro BA, Heinemann M, Podbielski A. Group A streptococcal growth phase-associated virulence factor regulation by a novel operon (Fas) with homologies to two-component- type regulators requires a small RNA molecule. Mol Microbiol. 2001;39:392–406. doi: 10.1046/j.1365-2958.2001.02226.x. [DOI] [PubMed] [Google Scholar]
- 46.Kreikemeyer B, Nakata M, Oehmcke S, Gschwendtner C, Normann J, Podbielski A. Streptococcus pyogenes collagen type I-binding Cpa surface protein - Expression profile, binding characteristics, biological functions, and potential clinical impact. Journal of Biological Chemistry. 2005;280:33228–33239. doi: 10.1074/jbc.M502896200. [DOI] [PubMed] [Google Scholar]
- 47.Akiyama H, Morizane S, Yamasaki O, Oono T, Iwatsuki K. Assessment of Streptococcus pyogenes microcolony formation in infected skin by confocal laser scanning microscopy. Journal of Dermatological Science. 2003;32:193–199. doi: 10.1016/s0923-1811(03)00096-3. [DOI] [PubMed] [Google Scholar]
- 48.Feil EJ, Holmes EC, Bessen DE, et al. Recombination within natural populations of pathogenic bacteria: short-term empirical estimates and long-term phylogenetic consequences. Proc. Natl. Acad. Sci., USA. 2001;98:182–187. doi: 10.1073/pnas.98.1.182. [DOI] [PMC free article] [PubMed] [Google Scholar]
- 49.Kalia A, Spratt BG, Enright MC, Bessen DE. Influence of recombination and niche separation on the population genetic structure of the pathogen Streptococcus pyogenes. Infect. Immun. 2002;70:1971–1983. doi: 10.1128/IAI.70.4.1971-1983.2002. [DOI] [PMC free article] [PubMed] [Google Scholar]
- 50.Hidalgo-Grass C, Ravins M, Dan-Goor M, Jaffe J, Moses AE, Hanski E. A locus of group A Streptococcus involved in invasive disease and DNA transfer. Mol Microbiol. 2002;46:87–99. doi: 10.1046/j.1365-2958.2002.03127.x. [DOI] [PubMed] [Google Scholar]
- 51.Jeng A, Sakota V, Li ZY, Datta V, Beall B, Nizet V. Molecular genetic analysis of a group A Streptococcus operon encoding serum opacity factor and a novel fibronectin-binding protein, SfbX. Journal of Bacteriology. 2003;185:1208–1217. doi: 10.1128/JB.185.4.1208-1217.2003. [DOI] [PMC free article] [PubMed] [Google Scholar]
- 52.Livak KJ, Schmittgen TD. Analysis of relative gene expression data using real-time quantitative PCR and the 2(-Delta Delta C(T)) Method. Methods. 2001;25:402–408. doi: 10.1006/meth.2001.1262. [DOI] [PubMed] [Google Scholar]
- 53.Ringdahl U, Svensson M, Wistedt A, et al. Molecular co-operation between protein PAM and streptokinase for plasmin acquisition by Streptococcus pyogenes. J Biol Chem. 1998;273:6424–6430. doi: 10.1074/jbc.273.11.6424. [DOI] [PubMed] [Google Scholar]
- 54.Kulisek ES, Holm SE, Johnston KH. A chromogenic assay for the detection of plasmin generated by plasminogen activator immobilized on nitrocellulose using para-nitroalilide synthetic peptide substrate. Anal.Biochem. 1989;177:78–84. doi: 10.1016/0003-2697(89)90017-1. [DOI] [PubMed] [Google Scholar]
Associated Data
This section collects any data citations, data availability statements, or supplementary materials included in this article.