

Abstract
Cognitive models of anxiety and panic suggest that symptom reduction during treatment should be preceded by changes in cognitive processing, including modifying the anxious schema. The current study tests these hypotheses by using a repeated measures design to evaluate whether the trajectory of change in automatic panic associations over the course of 12-week cognitive behavior therapy (CBT) is related to the trajectory of change in panic symptoms. Individuals with panic disorder (N=43) completed a measure of automatic panic associations (the Implicit Association Test, which reflects elements of the schema construct) every three weeks over the course of therapy, and measures of panic symptoms each week. Dynamic bivariate latent difference score modeling indicated that automatic panic associations not only changed over the course of CBT for panic disorder, but showed these changes were correlated with symptom reduction. Moreover, change in automatic panic associations was a significant predictor of change in panic symptom severity. These findings permit inferences about the temporality of change, suggesting that cognitive change does in fact precede and contribute to symptom change.
Keywords: panic disorder, implicit associations, schema, cognitive behavior therapy
The cognitive model of panic suggests that panic attacks occur because certain bodily sensations are misinterpreted as indicating a catastrophe, such as a heart attack or loss of control (Clark, 1986). This panic-specific model derives from more general cognitive theories to explain anxiety disorders. The general model proposes that maladaptive schemata or cognitive frameworks influence information processing so that the individual preferentially attends to danger cues, interprets ambiguous cues as threatening, and selectively remembers cues relevant to fear (e.g., Beck & Emery with Greenberg, 1985). Evidence for these different types of information processing biases have been established in panic disorder, including attentional (e.g., Beck, Stanley, Averill, Baldwin, & Deagle, 1992; Ehlers, Margraf, Davies, & Roth, 1988; Hope, Rapee, Heimberg, & Dombeck, 1990), interpretation (e.g., Clark et al., 1997; McNally & Foa, 1987), and memory biases (e.g., Becker, Rinck, & Margraf, 1994;Cloitre, Shear, Cancienne, & Zeitlin, 1994; Nunn, Stevenson, & Whalan, 1984). However, other aspects of cognitive models, as they relate to panic, have not been well tested.
Cognitive models of anxiety imply that symptom reduction in treatment should be associated with, and may even be preceded by, changes in the maladaptive fear schema (e.g., Young, 1999). As Casey, Newcombe and Oei (2005) note, “the concept of therapeutic change occurring through moderation or modification of negative cognitive schemas has traditionally underpinned the clinical cognitive model” (p. 196). This same general principle is also assumed to explain reduction of panic symptoms. Hoffart (1998) states, “According to the cognitive model of panic‚ change is attained through a shift in the way one interprets feared bodily and mental events‚ that is‚ through a schema shift” (p. 196). Despite the prominence of these models, we know little about how measures reflecting schemata change in response to treatment, and even less about whether these changes predict treatment response. This is particularly true in panic disorder, where schema investigations have lagged behind the exciting work evaluating explicit cognitive biases in panic (e.g., Clark et al., 1997).
One reason for the minimal empirical support for panic schema is that schema is a difficult construct to operationalize, given that schemata reflect cognitive frameworks or interconnected associations in memory (Segal, 1988). While there is no clear way to assess this construct directly, in the current study, we use a measure of automatic associations that captures some of the key qualities of the schema construct – namely, associations in memory that are difficult to strategically control and introspectively access. To date, there is evidence that automatic panic associations differentiate persons with anxiety sensitivity and panic disorder from non-anxious persons (Teachman, 2005; Teachman, Smith-Janik, & Saporito, 2007), and reductions in automatic fear associations have been observed following treatment in other anxiety disorders (e.g., spider phobia: Teachman & Woody, 2003). Further, findings indicate that various explicit cognitive biases diminish following successful panic control treatment (e.g., Clark et al., 1997), and there is evidence that panic symptoms are substantially reduced with cognitive behavior therapy (CBT; see meta-analysis by Gould, Otto, & Pollack, 1995). However, we do not have the critical piece of evidence that would tie these findings together to more directly test key predictions from cognitive models of panic. Specifically, we do not know whether automatic panic associations (which incorporate elements of panic schema) change over the course of treatment and whether this change predicts treatment response. Thus, the current study was designed to evaluate whether the trajectory of change in automatic panic associations over the course of treatment is related to the trajectory of change in panic symptoms. Note that while this approach does not test causality (i.e., whether change in automatic associations causes the change in symptoms), using a repeated measures design over the course of treatment provides a more direct assessment of the temporal link between changes in panic-relevant automatic associations and changes in panic symptoms.
Several researchers have noted that despite many clinical trials demonstrating the efficacy or effectiveness of CBT for panic disorder, the field is lacking studies demonstrating cognitive mediation or even cognitive predictors of treatment response (Oei, Llamas, & Devilly, 1999; Rachman, 1994; Smits, Powers, & Cho, 2004). This is problematic because it leaves open the possibility that reductions in cognitive biases following treatment are simply a consequence of treatment gains (i.e., symptom reduction), rather than a contributor to such gains (Casey, Newcombe et al., 2005; Marks, Basoglu, & Noshirvani, 1994; Seligman, 1988; Wolpe & Rowan, 1988). From a theoretical perspective, questions about whether cognitive biases are functionally related to anxious pathology or simply reflect an epiphenomenon of the anxious state are central to cognitive models of fear and anxiety. From a clinical perspective, understanding what makes CBT effective is critical to determine why the treatment at times fails, how we might enhance gains among partial responders, and to determine what components of treatment are necessary and/or sufficient. Clearly, no single study can address all of these issues, but convergent evidence across prior studies highlights the likely importance of cognitive change in predicting treatment response.
The majority of research investigating cognitive change has examined whether there is a reduction in cognitive bias from pre- to post-treatment, without specifically examining prediction of treatment outcome. For instance, Clark and colleagues found that a measure of interpretation bias was reduced following cognitive therapy (Clark et al., 1997). Similarly, Poulton and Andrews (1996) found that appraisals of physical danger and loss of control were diminished following CBT. Wenzel and colleagues have also observed decreases in panic beliefs following therapy (Wenzel, Sharp, Brown, Greenberg, & Beck, 2006), and have found that clients scored lower on a measure of panic-relevant explicit cognitions post-treatment if they no longer met diagnostic criteria for panic disorder (Wenzel, Sharp, & Sokol, 2006).
Other studies have tried to more directly demonstrate that cognitive factors predict treatment response. Using regression analyses, Hoffart (1998) found that explicit, agoraphobia-relevant threat appraisals predicted change in panic symptoms. Similarly, Casey, Oei, and Newcombe (2005) found that change in both panic self-efficacy and interpretation bias predicted symptom reduction during the first six weeks of therapy. Clark and colleagues (1999) did not test whether change in cognition predicted treatment response. However, they did find that measures of interpretation bias and agoraphobia-relevant cognitions both changed following cognitive therapy. Further, their post-treatment measure of interpretation bias predicted panic symptoms at one-year follow-up. It should be noted, though, that a number of studies examining either pre- or post-treatment levels of cognitive variables alone as predictors of treatment response have often produced null or mixed results (e.g., Chambless & Gracely, 1988; Clark, Watson, & Mineka, 1994; Hicks, Leitenberg, & Barlow, 2005; though see Keijsers, Hoogduin, & Schapp, 1994). This suggests that examining change in cognition, rather than static levels at baseline or following treatment, is likely important for enhancing predictive validity.
To test mechanisms of change more directly, a smaller number of studies have tested cognitive mediation to evaluate whether change in cognition is in fact a mechanism that can partly explain the effectiveness of CBT. For example, Casey, Newcombe and Oei (2005) demonstrated that shifts in panic self-efficacy and interpretation bias explained the relationship between CBT (versus a waitlist condition) and reductions in panic severity over the course of treatment. Further, Smits, Powers and Cho (2004) used regression analyses to test whether a decline in anxiety sensitivity could help explain treatment gains following CBT, relative to a waitlist condition. They found full mediation for changes in global impairment and partial mediation for most traditional panic outcomes (e.g., panic frequency). More recently, Hofmann et al. (2007) used multilevel modeling techniques to examine catastrophic cognitions (measured at pre and post- treatment and follow-up) as mediators of symptom change in individuals who were being treated with either CBT alone, CBT and imipramine, CBT and placebo, or imipramine alone. Results showed that catastrophic cognitions partially mediated change in panic symptoms, and did so only for those persons in treatment groups that included CBT.
Taken together, these studies provide impressive evidence consistent with cognitive models of panic regarding the role of cognition in predicting treatment change. However, by typically only looking at change from pre- to post-treatment, the research thus far does not speak to temporal questions of change. As the authors of the mediation studies themselves note, “our design does not allow us to rule out the possibility that the change in [anxiety sensitivity]… was a consequence as opposed to a cause of panic disorder symptom reduction” (Smits et al., 2004, p. 650). Similarly, Casey, Newcombe et al. (2005) commented that examining the order in which change occurs is needed to elucidate the nature of the relationship between cognitive and symptom variables. Thus, we extend this promising early work to evaluate the unique role of automatic panic associations in predicting treatment response, and assess the order of change using a repeated measures design.
The value of repeated measures designs that evaluate process and symptom variables at multiple time points throughout therapy is recognized by Kazdin and other research methodologists (e.g., DeRubeis et al., 1990; Kazdin & Nock, 2003). Kazdin and Nock (2003), for example, highlight two criteria that they identify as particularly important for establishing that a theoretically-derived cognitive variable is predictive of symptom change: a) demonstrating a strong association between cognitive change and symptom change, and b) evaluating temporality by assessing both cognition and panic symptoms repeatedly throughout therapy. Kazdin and Nock suggest that the evaluation of temporality has been the “Achilles heel of treatment studies” because temporality has rarely been examined. Thus, a decision was made to focus on testing temporality, rather than standard tests of mediation. Further, given that there is already abundant evidence supporting the efficacy of CBT as a treatment for panic disorder (see Gould et al., 1995), a decision was made not to test the specificity of CBT as an intervention by comparing it to an alternate treatment.
Our repeated measures approach follows the model used by Barber, Connolly, Crits-Christoph, Gladis and Siqueland (2000) in their study examining the effect of therapeutic alliance on depression levels. Akin to their design, we look within a treatment group, rather than comparing across treatment conditions. Panic symptoms are assessed at each session throughout therapy and our process variable (automatic panic associations) is measured at five time points over the course of the 12-week therapy in order to model the change trajectories. Finally, rather than relying on a series of regression analyses, which require many separate tests to model change, we take advantage of recent advances in structural equation modeling (SEM) to simultaneously model multiple changes over the course of treatment. Our goal is to examine how change in automatic panic associations over the course of CBT for panic disorder predicts symptom reduction. The evaluation of interconnected automatic associations in memory (as a proxy for schema) using a repeated measures design can bring us considerably closer to testing hypotheses from cognitive models of anxiety about the role of schema change in symptom reduction. We hypothesize that both panic symptoms and automatic panic associations will be reduced with treatment. Further, we expect that these two change processes will be related, and moreover, that change in cognitive processing will predict symptom change, rather than simply occurring as a consequence of symptom reduction.
Method
Participants
As described in Teachman et al. (2007), participants with panic disorder were recruited through newspaper, television, email, radio, print ads and flyers posted around the community and campus that invited individuals who had experienced panic attacks to contact our phone line. Interested individuals were then screened over the phone to evaluate whether they would likely meet criteria for panic disorder, and to confirm they had experienced a panic attack over the past month. Other inclusion criteria, also assessed by phone, included: (1) minimum 18 years of age, (2) mastery of written and spoken English (to complete the assessment battery), and (3) no history of completing a prior course of cognitive-behavioral therapy (CBT) for panic. In addition, the phone screen inquired about substance abuse or dependence within the past year, current psychosis, and unmanaged manic symptoms, as these were all exclusion criteria given their likely influence on treatment response. Other comorbidity, including current depression and other anxiety disorders, as well as other prior or current medication or psychosocial treatments not specific to panic were not grounds for exclusion (though we asked that participants be stable in their treatment course for at least six weeks).
Individuals who met the inclusion criteria were then invited to come to our clinic to complete the Structured Clinical Interview for DSM-IV (SCID; First, Spitzer, Gibbon & Williams, 1995) in order to establish a diagnosis of panic disorder with or without agoraphobia, check for suicidal ideation (an additional exclusion criterion), and assess current or lifetime history of other Axis I disorders. All phone screens and SCID interviews were conducted by trained doctoral students in clinical psychology with at least one year assessment experience, and all cases were presented to the first author and other interviewers during a weekly meeting to establish diagnostic consensus. Tape review and follow-up questions were used if there was any doubt about diagnoses. Further, inter-rater reliability for the SCID was high (kappa = .96) based on a re-rating of approximately 15% of the interviews by an independent doctoral level clinician. Of the approximately 165 individuals who completed the phone screen, 69 (42%) were appropriate and interested in coming in for the SCID evaluation. Thirty-nine (23%) individuals were appropriate for participation but were not interested in completing the SCID and 57 (35%) individuals were not appropriate for participation based on the study exclusion criteria. From the group of 69, 63 were eligible following the intake evaluation and were invited to join the study1. The other six participants were excluded based on further diagnostic information that emerged during the SCID. Forty-three people started treatment, completing the pre-treatment assessment battery before the start of the first therapy session. Of the 20 participants who did not enter treatment, 2 reported symptom improvement and did not feel treatment was needed, 2 did not return therapist’s calls to initiate treatment, and the remaining 16 indicated hesitancy about entering treatment or cited life circumstances that made participation difficult (e.g., school/job commitments, family issues)2. See Figure 1, which provides a diagram of the reasons for exclusion and attrition during the initial stages of the study.
Figure 1.

Diagram of reasons for participant exclusion and attrition during initial stages of the study.
The final sample for the panic disorder group (N=43; 70% with agoraphobic avoidance) was 70% female, mean age was 40.14 years old (SD=15.17, Range=18–71), and 91% were Caucasian (5% were African-American, 2.3% described themselves as biracial, and 2.3% indicated “other”). The mean duration between participants’ first panic attack and intake was 175.51 months (SD=185.08, Range=2–732 months). Mean level of agoraphobic symptoms (based on self-report ratings on the Fear Questionnaire-Agoraphobia subscale at the pre-treatment testing session) for our full 43 participants was 10.51 (SD=9.32), and for those participants diagnosed with agoraphobia, it was 12.93 (SD=10.13). This latter mean score is similar to norms provided by Marks and Mathews (1979) for their sample of individuals with panic disorder with agoraphobia. According to the clinical interview, among those individuals who received a diagnosis of agoraphobia (and had their agoraphobia severity classification reviewed during the case consensus conference), 46% were classified as mild, 50% as moderate, and 4% as severe.
Although panic disorder was the primary diagnosis in all cases, based on participant’s report of current interference and/or symptom severity, current comorbid Axis I diagnoses at intake included: 35% had other anxiety disorders (Specific Phobia, Generalized Anxiety Disorder, Obsessive Compulsive Disorder, Social Phobia, Post Traumatic Stress Disorder), 26% had mood disorders (21% Major Depressive Disorder, 2.3% Bipolar I Disorder, and 2.3% Bipolar II Disorder), 7% had eating disorders (Binge Eating Disorder and Eating Disorder NOS) and 2% had Trichotillomania. In addition, 61% reported current psychotropic medication use at intake: 44% on antidepressants, 2% on antipsychotics, 30% on benzodiazepines, 2% on beta-blockers, and 9% on mood-stabilizers. Further, 21% reported ongoing psychosocial treatment at intake (for issues other than CBT for panic).
Materials3
Measures of Panic, Mood and Anxiety Symptoms
Anxiety Sensitivity Index (ASI; Reiss, Peterson, Gursky & McNally, 1986)
This 16-item questionnaire measures concern over the symptoms associated with anxiety (e.g., “It scares me when my heart beats rapidly”) and has adequate psychometric properties (Telch, Shermis, & Lucas, 1989).
Beck Depression Inventory (BDI-II; Beck, Steer & Brown, 1996)
The BDI-II is a 21-item self-report inventory that measures severity of symptoms associated with depression.
Fear Questionnaire - Agoraphobia subscale (FQ-Agoraphobia; Marks & Mathews, 1979)
This 5-item subscale measures participants’ level of phobic avoidance toward common situations, such as crowded shops.
Panic Disorder Severity Scale (PDSS; Shear et al., 1997)
This 7-item scale has good reliability, and provides a composite severity score of frequency, distress, and impairment associated with panic attacks (scores can range from 0–28). Although this measure was designed as a clinician-administered instrument, several prior studies have successfully had participants complete it as a self-report measure (e.g., Otto, Pollack, Penava, & Zucker 1999; Penava, Otto, Maki, & Pollack, 1998; Teachman, 2005). The instrument was modified slightly for this study by adding a description of panic attacks to the instructions so that it could be more easily completed in a self-report format. Cronbach’s alpha for the PDSS in the present study ranged from .80-.92. The average alpha across the 12 assessment points was .87.
Measure of Automatic Panic Associations
Implicit Association Test (IAT; Greenwald, McGhee, & Schwartz, 1998)
The IAT measures automatic associations, in the sense that evaluations occur outside conscious control, and at times, outside conscious awareness. Further, the evaluations reflect interconnected associations in memory, thus appearing to share some of the qualities ascribed to schemata (Segal, 1988). The IAT has adequate psychometric properties (Greenwald & Nosek, 2001), and like many tasks used by social cognition researchers (Fazio, 2001), it is a reaction time task that purportedly reflects strength of association between concepts in memory. The computerized version of the IAT requires items to be classified while two category labels are paired on either side of the screen. Specifically, the task involves comparing the time taken to classify stimuli when paired categories match a person’s automatic associations (e.g., the concept ‘calm’ is paired with the self for a person with no anxiety disorder) versus the time taken when paired categories contradict automatic associations (e.g., the concept ‘panicked’ is paired with the self for a person with no anxiety disorder). It is expected that when categories are paired to match a person’s automatic associations, he or she will be able to classify the stimuli more quickly.
The task has a number of features that make it particularly suitable for panic research. First, the methodology minimizes the influence of self-presentational concerns (Greenwald et al., 1998). Second, the IAT uses a within-subject design, so the influence of state affect is held constant because the anxiety-evoking stimuli are present in both conditions being compared, permitting a relatively clean evaluation of cognitive processing.
The IAT is a relative task, so comparison categories are required for both the target and descriptor categories. In the present task, which evaluated the panic self-concept (referred to as ‘IAT Panicked > Me’), the category ‘Calm’ was used as a comparison to the category ‘Panicked’ because it reflects the opposing emotional response. These categories were compared while being paired with descriptor categories to reflect the self versus others. Specifically, the categories ‘Panicked’ and ‘Me’ were paired at the top left of the computer screen while ‘Calm’ and ‘Not me’ were simultaneously paired at the top right (see Appendix A for visual depiction of the computer screen). Participants were instructed to simply complete the categorization task that involved classifying any stimuli that belonged to either the ‘Panicked’ or ‘Me’ categories on the left, and any stimuli that belonged to either the ‘Calm’ or ‘Not me’ categories on the right. Note that participants had previously seen a list indicating which stimuli belonged in each of the four categories, so they knew the correct category classifications. Following this category pairing condition, the labels were switched and the same categorization task was completed while pairing ‘Panicked’ with ‘Not me’ and ‘Calm’ with ‘Me’. The dependent variable is speed of categorization when the category pairing condition matches versus when it contradicts the panic self-concept associations.
Based on recommendations from Nosek, Greenwald, and Banaji (2006), four representative items were selected for each category (see Appendix A for category labels and stimuli). The IAT included two critical blocks: one block of trials where the target and descriptor categories were consistent with panic self-concept associations and one block where they contradicted panic self-concept associations. Each critical block consisted of 36 classification trials, and was preceded by a 20-trial practice block. The practice trials were not used in the current analyses because a shortened version of the IAT was employed that did not include single categorization blocks (similar to that used in Teachman & Woody, 2003). Participants first completed an unrelated practice IAT task to familiarize them with the procedure and then completed the main task. Importantly, the ordering of the panic-consistent versus inconsistent blocks was counterbalanced, and the order of stimuli presentation within blocks was random. Participants were instructed to respond as quickly and as accurately as possible, and were provided error feedback throughout the task that required them to correct any misclassifications before moving on to the next trial.
The IAT data at each assessment point were scored according to the scoring algorithm developed by Greenwald, Nosek & Banaji (2003), because this approach improves the psychometric properties of the tool by taking into account each respondent’s latency variability. Using this approach, no participants’ IAT data needed to be eliminated based on standard cutoffs for either high error rates (greater than 30% overall) and/or fast or slow response times (>10% trials under 300 ms or over 10000 ms). The average error rate at each assessment point was low, ranging from 2.9 to 3.4%. Finally, data were scored so that positive IAT values, known as D scores, reflect relatively faster response times for panic-relevant automatic associations (i.e., more panic bias). Specifically, IAT D scores reflect the difference in mean reaction time across blocks divided by the standard deviations across blocks, which is conceptually similar to Cohen’s d (see Greenwald et al., 2003).
Given the relative novelty of the IAT task, a series of tests were done to establish its psychometric properties. Split-half reliability of the task for the first administration of the IAT was high (r = .86 for the two halves). Further, although the delayed treatment group is likely too small to evaluate test-retest reliability, so the results should be interpreted with caution, the correlation between their Time 1 and Time 2 (12 weeks later with no treatment in between) IAT assessments was r = .55, and there was no change on the IAT during the delayed treatment group’s wait period (t (7) = 1.31, p>.10, d = .49). Finally, construct validity of the IAT is supported by a recent paper (Teachman et al., 2007) where we showed that, at baseline, participants with panic disorder had relatively lower self + calm (and, in consequence, more self + panicked) implicit associations on the IAT when compared to a psychiatrically healthy control group. Moreover, the IAT was related to a panic symptoms factor that included measures of panic severity, avoidance, distress during an interoceptive exposure, and anxiety sensitivity.
Treatment
The 12-week treatment protocol followed the widely used Panic Control Treatment manual (Barlow & Craske, 1994), modified slightly to fit a group format. Treatment, which involved highly structured, 90-minute weekly sessions, included four primary components: 1) psychoeducation about the nature of anxiety, the fight or flight response and the fear of fear cycle, 2) diaphragmatic breathing and progressive muscle relaxation training to encourage a more relaxed resting state, 3) cognitive restructuring to identify and challenge panic-relevant, negative automatic thoughts, and 4) exposure exercises. The exposures included both interoceptive exercises to learn to tolerate feared bodily sensations and self-directed homework assignments to reduce agoraphobic avoidance. Each group was co-led by a pair of advanced-level graduate students, following extensive training in CBT techniques, the panic treatment protocol, and review of training tapes. All sessions for all nine treatment groups were observed (via one-way mirror) or reviewed (through audio tape recordings) by the first author, who provided weekly supervision. Groups ranged in size from 4–6 participants.
Procedure
Informed consent was obtained before the SCID interview. At intake and then at the outset of every therapy session, participants completed the PDSS to provide a weekly measure of panic symptoms. Assessment of automatic panic associations (using the IAT) and the other questionnaire measures were completed at testing sessions held immediately prior to session 1 of treatment, and then following sessions 3, 6, 9, and 12. The order of the IAT task, the other cognitive bias measures that are not reported here (see footnote 2), and the questionnaires were counterbalanced across participants. The order within the questionnaire set was randomized, and the order of the IAT blocks was counterbalanced. Based on availability of testing space, some participants completed the assessments in an individual testing room, while others completed the tasks in a group testing room that included multiple testing carrels, separated by dividers. Headphones could be worn for the group administration if a participant desired, but all other procedures were identical and participants could not observe one another’s responses.
Results
Table 1 presents means and standard deviations for the outcome measures across treatment. Repeated measures ANOVAs showed a significant effect of treatment over time for the PDSS (F = 7.62, p < .05,: ηp2 = .43), the BDI (F = 6.87, p < .05,: ηp2 = .20), the FQ-Agoraphobia (F = 4.57, p < .05,: ηp2 = .15), and the ASI (F = 10.24, p < .05,: ηp2 = .28). These results suggest that treatment was generally effective (paralleling past work testing CBT for panic disorder), but, as expected, there was considerable individual variability in how much each person changed over time. Thus, statistical procedures that take into account individual variability are better suited to our questions about change.
Table 1.
Descriptive Statistics (Means and SD) for Treatment Measures
| Treatment Session | 1 | 2 | 3 | 4 | 5 | 6 | 7 | 8 | 9 | 10 | 11 | 12 |
|---|---|---|---|---|---|---|---|---|---|---|---|---|
| Panic Disorder | 13.42 | 9.12 | 8.20 | 8.23 | 6.62 | 7.18 | 6.30 | 7.06 | 6.88 | 5.17 | 6.15 | 5.75 |
| Severity Scale | (4.26) | (5.33) | (4.33) | (4.67) | (4.41) | (3.95) | (3.92) | (4.24) | (4.38) | (3.37) | (4.26) | (4.29) |
| Beck Depression | 14.48 | 10.62 | 8.59 | 7.44 | 5.52 | |||||||
| Inventory | (10.66) | (8.01) | (7.58) | (7.30) | (4.80) | |||||||
| Fear | 10.51 | 8.40 | 6.84 | 7.22 | 5.00 | |||||||
| Questionnaire- Agoraphobia | (9.32) | (7.29) | (6.35) | (5.91) | (3.56) | |||||||
| Anxiety | 32.10 | 26.69 | 22.27 | 22.47 | 20.94 | |||||||
| Sensitivity Index | (11.85) | (11.01) | (9.13) | (10.23) | (10.75) | |||||||
| Implicit | −.36 | −.34 | −.56 | −.51 | −.40 | |||||||
| Association Test | (.36) | (.38) | (.35) | (.37) | (.36) |
Statistical Procedure
To evaluate how change in automatic panic associations (on the IAT) predicts change in panic symptoms (on the PDSS), a series of dynamic latent growth models will be used following recommendations by McArdle and colleagues (McArdle, 1988; McArdle & Hamagami, 2001; McArdle & Nesselroade, 2002). The modeling steps can be thought of hierarchically in three stages: 1) modeling the change in growth of the PDSS and IAT separately (univariate latent growth curve modeling) to establish the two separate change processes over time, 2) simultaneously modeling growth in both variables and noting their association (bivariate latent growth curve modeling) to demonstrate that the change processes are correlated, and, finally, 3) dynamically modeling the variables (dynamic bivariate latent difference score modeling; for an example see Hawley, Ho, Zuroff, & Blatt, 2006) to determine whether the initial level and/or change of one variable leads to later change in the other. Thus, in a longitudinal study with variables that are measured frequently, we can model whether one variable dynamically affects change in the other variable. Latent growth modeling allows one to test multiple hypotheses in one model (i.e., change over treatment and predictors of change), while also minimizing measurement error in observed variables.
Analyses were conducted with Mplus software (Muthen and Muthen, 2006) using full information maximum likelihood estimation (FIML). This approach estimates the model parameters using all information that is available rather than deleting cases with incomplete data (Enders, 2001). Thus, people who had missing sessions and those who did not complete treatment had all available data utilized in these analyses4. Our primary question concerned the reliability of the parameters estimating change on the PDSS and IAT; however, for descriptive purposes, we also note information about the overall goodness of fit for the models. Several goodness of fit indices were used, which can be broken down into absolute fit (assesses how well the model reproduces the data) and predictive fit (assesses the fit in hypothetical replication samples). Assessment of absolute model fit was based on the loglikelihood ratio chi-square (as the value of chi-square increases from 0, the fit become increasingly worse). We also report predictive fit statistics, including the Akaike information criteria (AIC), which is a parsimony adjusted index (i.e., favors simpler models; lower values of the AIC indicate better fit) and the Bayes Information criteria (BIC), which also penalizes model complexity (lower values of the BIC indicate better fit). While there are no specific accepted cutoffs for these fit indices, the variable and sometimes high values for AIC and BIC in our models suggest the absolute fit was not always strong, which is not surprising given the relatively small sample size. Power of the individual coefficients was evaluated using a Monte Carlo study (Muthén, and Muthén, 2002). This procedure performs multiple replications to determine how many times that a parameter is equal to zero at the .05 level. The power values of our study were between .36 and .86 for the key parameters of interest (again, the wide range of power estimates is not surprising due to the relatively small sample size). Effect sizes are described for each of the coefficients of interest.
Stage 1: Univariate Latent Growth Curve Modeling
The first set of models was used to determine whether significant change over the course of treatment had occurred on the PDSS and IAT5. Figure 2 displays path diagrams of the latent growth curve models, which estimate both the level of the pre-treatment latent variable (where people begin) and the latent growth variable (how people change). The loadings on the factors were constrained so that each person’s trajectory would form a straight line (see McArdle & Nesselroade, 2002, for a more detailed discussion of this type of modeling). Both the PDSS and IAT showed significant change across treatment (fit indices for PDSS: Loglikelihood = −918.55, df = 84, AIC = 1849.10, BIC = 1859.66; fit indices for IAT: Loglikelihood = −47.41, df = 14, AIC = 106.83, BIC = 117.39). Estimates of panic symptoms, as measured by the PDSS, began on average at 10.59 and went down 5.36 (p < .05, 95% CI 4.16 to 6.56) points across treatment (comparable to PDSS scores reported in Penava et al., 1998). Estimates of IAT-D scores (positive scores related to more panic bias) began on average at −.36 and went down .09 (p < .05, 95% CI .07 to .11) units across treatment. Thus, both outcome measures independently display significant improvement over the course of treatment.
Figure 2.
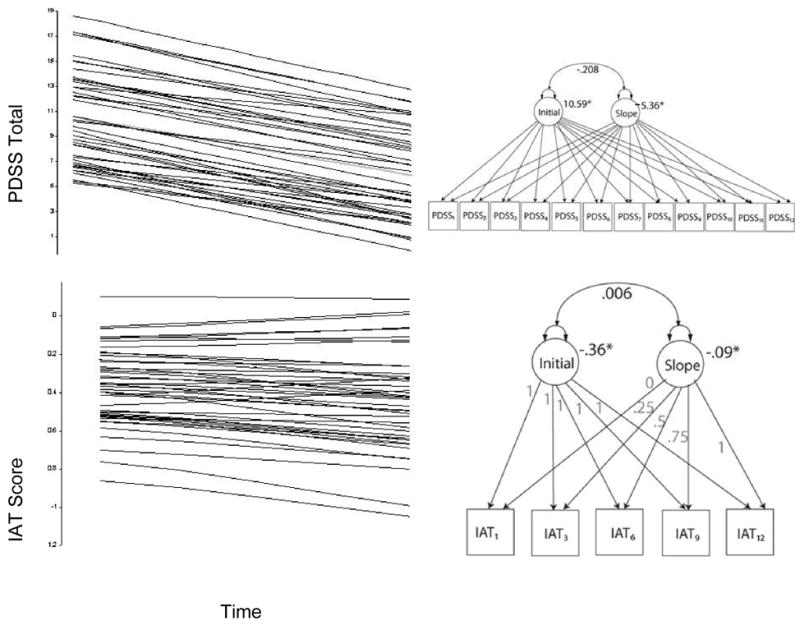
Predicted individual trajectories and latent growth curve models for the Panic Disorder Severity Scale (PDSS) and Implicit Association Test (IAT).
Note. To improve readability, error terms for the manifest and latent variables are not consistently noted in the Figures, but were included in all analyses. The numeric subscript following the PDSS and IAT manifest variables refers to the assessment time point (1 refers to pre-treatment, 3 refers to session 3 of treatment, etc.). Initial refers to the initial pre-treatment level on the variable. Factor loadings in each model were set so that linear trajectories were predicted. (Curves were also predicted for both variables. However, there was not a significant improvement in model fit.)
Stage 2: Bivariate latent growth curve modeling
The next set of models investigated whether changes on the PDSS and IAT were related to each other. That is, we ran the univariate latent growth curve models simultaneously and estimated the correlation of one variable’s latent change with the other variable’s latent change. As noted in Figure 3, the latent change on the IAT was significantly correlated with latent change on the PDSS (r = .28, p < .05; fit indices: Loglikelihood = −963.82, df = 156, AIC = 1955.64, BIC = 1980.30). Not surprisingly, given prior mixed findings, pre-treatment levels on the PDSS and IAT were not significant predictors of the change processes (see standardized coefficients in Figure 3). Thus, as predicted, the change processes were related to each other.
Figure 3.
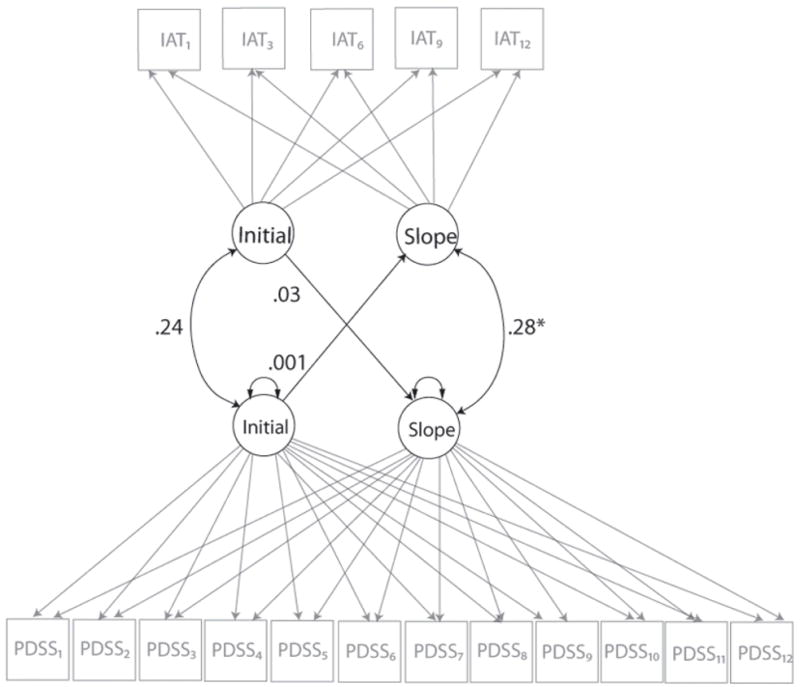
Dual latent growth curve models of the Panic Disorder Severity Scale (PDSS) and Implicit Association Test (IAT) modeled simultaneously, indicating that the slopes of the two change processes are correlated.
Stage 3: Dynamic bivariate latent difference score modeling
Bivariate latent difference score modeling provides a flexible framework in order to model one variable as a leading indicator of change in another variable. That is, it allows the evaluation of predictive relationships in multivariate change processes. It also allows us to model the relationship in the opposite direction to evaluate whether change is uni- or bidirectional. In this model, we constrained many of the parameters; specifically, we constrained all of the unlabeled arrows to 1. Only one a (alpha – to model straight-line growth) and one Y (gamma – to model a stable change process across time) were estimated for all time points (see McArdle & Hamagami, 2001, for a detailed explanation of these procedures). Our goal was to test specific hypotheses about which change process (panic symptoms or automatic panic associations) is a leading indicator of the other process. Thus, we constrained growth to be a linear process and limited the number of parameters to be estimated in each model. This constraining of parameters also allowed the modeling program to converge on the results fairly easily despite the relatively small sample size.
Figure 4 presents a model in which changes in one variable (PDSS or IAT) are predicted by the prior change in the other variable (fit indices: Loglikelihood = −935.30, df = 149, AIC = 1912.60, BIC = 1949.58). Most arrows have parameters that are set to one, while the arrows labeled with the a parameters are used to estimate the change in each variable. The arrows labeled with Y are the most important to our hypothesis and these predict the relationship between variables. In this figure, a bidirectional relationship is specified because we are interested in whether change in PDSS is predicted by prior IAT change, as well as whether change on the IAT is predicted by previous PDSS change. The Y parameters are constrained to be equal across time, so we can examine whether change on one variable predicts change in the other, but cannot specify at what stage of treatment this change occurs or is predictive.
Figure 4.
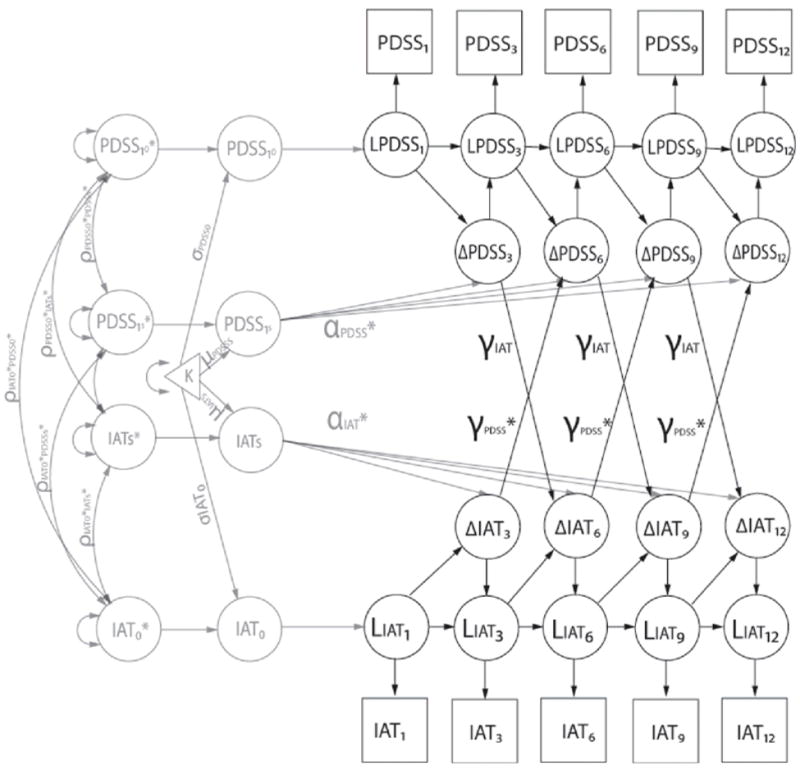
Bivariate latent difference score model of the Panic Disorder Severity Scale (PDSS) and Implicit Association Test (IAT). Previous change on the IAT is a significant predictor of later change on the PDSS. However, previous change on the PDSS is not a significant predictor of later change on the IAT. The L in the figure refers to the latent score for a factor, the Δ refers to a latent change score, the a refers to alpha (estimate to model straight-line growth), and the Y refers to gamma (estimate to model change process across time).
Note. All 12 time points were used in the PDSS estimates. However, only a few time points are shown in this figure to improve readability.
As predicted, previous change on the IAT is a significant predictor of later change on the PDSS (YIAT p < .05, Cohen’s d = .83). However, previous change on the PDSS did not reach significance as a predictor of later change on the IAT (YPDSS, p > .05, Cohen’s d = .41). Thus, the prior change in automatic panic associations significantly predicts change in panic symptoms, but the reciprocal relationship did not reach significance. In addition to this model that included both the IAT and PDSS change processes as leading indicators, two additional models were run: one with the IAT variable’s Y coefficients removed, and one with the PDSS variable’s Y coefficients removed to examine whether both change processes (or only one) significantly added to the model’s fit. These two models did not fit the data as well as the full model based on chi-square difference tests. Thus, it seems that even though the PDSS was not a significant predictor of later change in the IAT, it does add explanatory power to the model. Furthermore, the effect size estimate may also indicate that the sample size was too small to see the PDSS as a significant predictor of later change in the IAT.
Finally, the results were reanalyzed using an alternate scoring method for the IAT (the original scoring algorithm described in Greenwald et al., 1998; see outline of results in Appendix B). Using this method, results were very similar to those obtained with the revised scoring algorithm used above. In both cases, previous change on the IAT was a significant predictor of later change on the PDSS. Of note, while the effect size for the path evaluating the PDSS as a significant predictor of later change on the IAT for the Stage 3 bivariate latent difference score model was similar to that observed with the revised scoring algorithm, the effect did reach significance using the alternate scoring method.
Discussion
The current study used a repeated measures design to test hypotheses from cognitive models of panic and anxiety about the role of schema change in symptom reduction. Using dynamic bivariate latent difference score modeling, our evaluation of automatic panic associations (which reflect elements of the schema construct) indicated that automatic panic associations not only change over the course of CBT for panic disorder, but that these changes are correlated with symptom reduction. Moreover, change in automatic panic associations was a significant predictor of change in panic symptom severity. These findings permit inferences about the temporality of change, suggesting that cognitive change does in fact precede and contribute to symptom change. This provides considerable support to cognitive models and counters the criticism that cognitive biases and their reduction following treatment may simply occur as a consequence of symptom reduction.
Establishing that automatic panic associations (as measured by the IAT) change over the course of treatment provides one of the first indications that measures of automatic, uncontrollable processing change with treatment for panic disorder. Previous studies have tended to examine change in explicit cognition, such as studies using the Anxiety Sensitivity Index (Smits et al., 2004) and studies of consciously endorsed catastrophic misinterpretations of bodily sensations (e.g., Clark et al., 1997). While extremely valuable, these studies do not speak to the multiple ways that cognition can become biased and impair functioning in panic disorder. As McNally (2001) has noted, cognitive theories of anxiety disorders suggest two distinct ways of understanding distorted cognition: appraisals, which tend to be self-reported cognitive content that is biased toward threat (e.g., believing anxiety symptoms, such as a racing heart, are dangerous), and information processing approaches, which usually infer selective processing of threat information by looking at reaction time to anxiety-relevant stimuli. It is clear that both approaches are important for understanding pathological anxiety, in part because information processing measures can help overcome some of the limitations of relying exclusively on self-report (Segal, 1988). This is especially important when evaluating changes over treatment, where clients may feel pressure to present themselves in a more positive light as therapy progresses. Thus, using an automatic measure of cognitive processing, particularly one that is difficult to strategically control such as the IAT (Greenwald et al., 1998), can be particularly helpful in a treatment context. Further, McNally (1995) suggests that the key feature of automaticity in anxiety disorders is the uncontrollable nature of fear responding.
Our measure of automatic cognitive processing was also selected because of the parallels it shares with definitions of the anxious schema construct. While the IAT is not a direct measure of schema, the measure does reflect interconnected associations in memory that seem to reside outside conscious control; interconnections that are thought to reveal cognitive structure. As Posner and Warren (1972) describe, “When we say a structure exists in memory we are really saying that one item will activate another in a quite direct and simple way even perhaps when the subject does not intend for it to occur. If we had methods to tap structure uninfluenced by conscious search, we might reflect the structure of memory more simply” (p. 34). The IAT appears to be a promising method in this regard because it measures strength of association between constructs that is not easily controlled. Accordingly, we see the measure of automatic panic associations as an important step to testing cognitive models that suggest schema should change over the course of treatment (see Casey, Newcombe et al., 2005; Hoffart, 1998; Young, 1999). The finding that the univariate latent growth curve model for the IAT showed a significant slope offers compelling support for these models.
While this finding indicates that automatic panic associations are reduced following CBT for panic disorder, it is worth noting that the slope of change indicated considerable variability across participants. Not everyone experienced similar reductions in automatic panic associations. It was precisely this variability that was of interest to understand whether the individual differences in the trajectories of cognitive change would help predict treatment response. The significant correlation between the slopes for the automatic panic associations and the panic symptoms suggested these change processes were related. This is congruent with earlier work showing that cognitive change (typically on explicit measures) is related to gains in therapy (e.g., Casey, Newcombe et al., 2005; Casey, Oei et al., 2005; Smits et al., 2004), and extends this research by using a repeated measures design to show that the trajectory of change is predictive of treatment response, and not simply change from pre- to post-treatment. Using a repeated measures design to look at change was considered especially valuable for the current study, given that previous research looking at static levels of cognitive variables (i.e., pre-or post-treatment scores alone) do not consistently predict treatment response in panic disorder (e.g., Chambless & Gracely, 1988; Clark et al., 1994; Hicks et al., 2005). It is the change in cognitive processing that appears critical. In line with this idea, in the current study, the pre-treatment level on the IAT measure of automatic panic associations did not predict the reduction in panic symptoms.
The finding from the bivariate latent growth curve model that change in automatic panic associations was correlated with change in panic symptoms was thus a critical step to evaluate the predictive validity of the cognitive change process. However, this approach does not establish temporality or directionality, so it remained possible that the cognitive change over the course of treatment simply occurred as a result of the symptom reduction. While this would suggest that treatment may help reduce cognitive biases, it would not speak to a central tenet from cognitive models of anxiety and panic, which posits that change in cognition should precede and be related to fear reduction.
It is in the dynamic bivariate latent difference score model that we are finally able to test the premise in the models that cognitive change will predict symptom change. Although this does not directly test causality, the dynamic evaluation of how change systems interact presents new opportunities to address questions about the order of change that have often eluded psychopathology researchers (see Kazdin & Nock, 2003).
The finding that cognitive change predicts symptom change is consistent with the idea that schema change contributes to fear reduction. Interestingly, it also shows some parallels with early ideas from Beck’s cognitive models of emotion dysregulation that cognitive responding occurs in advance of the affective reaction, a process known as the “cognitive primacy hypothesis” (e.g., Beck et al., 1985). It is especially notable that the temporal precedence of cognitive change was found for a measure of automatic associations in memory given initial expectations that these associations would be difficult to change (Greenwald & Banaji, 1995). While there is now considerable evidence that automatic associations are malleable (see Blair, 2002), we still assume that sustained change in automatic associations (as opposed to temporary shifts) requires a fair amount of practice of new associations. After all, associations reflecting the panic self-concept are likely highly elaborated and central to the self among persons with panic disorder, and there is evidence from the social cognition field that these qualities would make the attitudes especially resistant to change (see Correll, Spencer, & Zanna, 2004; Zuwerink & Devine, 1996). Intriguing questions not directly addressed in the current study are what changes the automatic panic associations, and when in therapy do these changes occur. We speculate that the experience of tolerating anxiety during interoceptive and in vivo exposures and the explicit challenge to beliefs about the certainty and catastrophic nature of panic attacks all contribute to increased self-efficacy, which in turn establishes healthier automatic associations about the self as someone who can remain calm. We suspect that these positive therapy experiences help the individual to override their automatic associations about the inevitability of panic.
The question of what specific mechanisms cause the change in automatic panic associations is particularly curious given that the slope for the change in panic symptoms (as measured by the PDSS) did not significantly predict the change on the IAT using the revised scoring algorithm. It did, however, reach significance using the original scoring method (see Appendix) and the effect size was moderate. We suspect that the relationship between change on the cognitive and symptom measures is bidirectional, but it appears to be stronger in the direction of cognitive change as the predictor (so symptom change as the predictor may not reach significance with a relatively small sample size). The finding that the Cohen’s d effect size was large (and significant) for the cognitive change as a predictor, but moderate for the symptom change as a predictor supports this possibility. Alternatively, the weaker prediction from the PDSS symptom change may be due to the highly variable nature of the IAT change, making it a hard variable to predict.
One reason for this IAT variability may follow from the relative nature of the task. We refer to the task as reflecting panic self-concept associations for ease of discussion, but it should always be kept in mind that the task measures the association between the self and panicked relative to the association between others and calm. The relative nature of the IAT task thus constrains the interpretations we can make about automatic panic associations. For instance, it seems plausible that evaluation of others (in addition to the association between the self and panic) might change over the course of treatment. In particular, it is possible that at the end of treatment, clients might think about other panic group members as the comparison group, rather than others in the general population. Another limitation of the IAT task used in this study is that it is not possible with the current data to determine the specificity of the IAT as a measure of panic schema, as opposed to a measure of an alternate component of self-concept or negative affect. More generally, there is evidence that the IAT used in this study discriminates panic patients from healthy control individuals, but it has not yet been established whether this IAT discriminates between panic disorder and other anxiety disorders or forms of psychopathology. Use of additional IAT tasks or an anxious control group would have been helpful to better establish discriminant validity of the task. Finally, it should be noted that the IAT task used here captures panic self concept, rather than the catastrophic misinterpretation of bodily sensations, which is also an important component of testing automatic panic associations. It will be beneficial in future research to try an alternate approach to measuring automatic catastrophic associations with bodily sensations that does not rely on a relative measure (see discussion in Teachman et al., 2007).
Other limitations of the current study include the sample size, which was small for the modeling approaches we selected (and likely explains why the overall goodness of fit indices were not strong). As a result, power was very low for some analyses, which is a clear limitation. However, convergence (number of iterations to find the results) was relatively quick, suggesting that the results are reliable. Furthermore, multiple versions of the bivariate latent difference score model were run with different lags (i.e., previous level of variable predicting change on the other variable) with similar results. In addition, while a control group was not considered necessary to examine our primary question of within-subject change trajectories over the course of treatment, the absence of an untreated control group who completed the measures on a similar timeline (the small waitlist group only completed the measures at the baseline and 12-week mark before joining a treatment group) means that it is possible that factors other than treatment could account for the cognitive and symptom change trajectories. Similarly, the lack of ratings of treatment adherence by an independent evaluator is a limitation. However, we think it is implausible that factors other than treatment would have primarily led to the changes given that a well-established and highly monitored treatment for panic disorder was used following a well-specified protocol, and all indications of treatment outcome were positive. This design choice also means that we cannot evaluate the specific impact of repeatedly completing the automatic association measures.
Notwithstanding the above limitations, the repeated measures design in the current study provides a unique opportunity to evaluate whether cognitive change occurs in advance of, and is related to, reduction in symptoms. The finding that automatic panic associations are reduced over treatment, and that this change process precedes and predicts change in panic symptoms, provides considerable support to cognitive models of panic disorder. These findings are also consistent with more general expectations from cognitive models of anxiety and schema change. It will be interesting in future work to establish to what extent cognitive change contributes to symptom change in other anxiety disorders and from other information processing biases, beyond automatic associations. We suspect that analogous change sequences occur for other anxiety problems, and that change in other cognitive biases are also predictive of symptom reduction. However, automatic associations may be particularly potent predictors given their similarity to schema, which is the cognitive framework thought to underlie other information processing biases, such as attention and interpretation. It is also an open question whether alternate forms of treatment would result in the same sequence of change. CBT for panic disorder is designed to challenge distorted cognitions, and exposure exercises offer ideal opportunities to build healthier associations. Medication therapy, for example, might not have a similar effect on automatic associations. Instead, the automatic associations might shift later; after symptom reduction and consequent reductions in avoidance create exposure opportunities. This would suggest that change in automatic panic associations may turn out to be a sufficient but not necessary mechanism of change. Many open questions remain abut the role of cognitive change in anxiety treatments, but the current results suggest that changing distorted cognitive processing, even when it occurs outside conscious control, may play a valuable role in facilitating recovery from anxiety.
Acknowledgments
The authors are thankful to the clinical interviewers and therapists, and the research assistance provided by members of the PACT lab at the University of Virginia. This research was supported by an NIMH R03 PA-03-039 grant to Bethany Teachman.
Appendix A
Visual depiction of the Implicit Association Test procedure

Note. Participants classify the stimulus using either the right or left key.
Implicit Association Test Word List
| Category Label: | Panicked | Calm | Me | Not me |
|---|---|---|---|---|
| Stimuli: | Panicked | Calm | Me | Not me |
| Scared | Relaxed | Self | Other | |
| Anxious | Serene | I | Them | |
| Frightened | Tranquil | My | They |
Appendix B
The revised scoring algorithm (used for the analyses reported in the main text) produces a D-measure, as opposed to the simple difference score originally used to score the IAT. The rationale for using the revised scoring algorithm follows from the limitations of standard mean latency difference scores, which the D-measure helps to address (see Nosek & Sriram, 2007). In particular, mean latency difference scores can be biased both by individual differences in processing speed, and by the positive relationship between mean latency and the variance of that latency. These biases can result in spurious correlations between difference scores and outcome variables, and between sets of difference scores (i.e., in within-subjects designs). The Greenwald et al. (2003) paper showed that the D-measure, as an individual effect size measure that takes into account each respondent’s latency variability, is less vulnerable than the original scoring method to these biases and other extraneous influences. Hence, we use this scoring method for the primary analyses.
Notwithstanding, given that there continues to be some controversy about the optimal way to score the IAT, the models were also run using IAT effects derived from the original scoring algorithm described in Greenwald, McGhee, and Schwartz (1998). Following Greenwald et al. (1998), response latencies less than 300 ms or greater than 3000 ms were counted as errors and recoded as 300 or 3000 ms, and then the remaining trial latency data were log transformed before being averaged over each block. Using this algorithm, a difference score was then obtained between the log transformed latencies across each block.
Results for the models testing change on the IAT as a predictor of panic symptom reduction indicated a similar pattern of results when using the original algorithm, relative to that obtained with the revised algorithm. Also, correlations between the original and revised scoring algorithm were high at all time points (r range=.86–.95; all p<.001). With respect to the first model establishing change on the IAT, once again the slope indicated a significant decline over the course of treatment and the fit statistics were similar to those obtained with the revised algorithm. For the second model (testing whether change on the IAT and change on the PDSS were correlated), results again indicated a significant relationship (r = .26, p < .05). Finally, for the critical third model testing whether change on the IAT predicts subsequent change on the PDSS, and vice versa, results again demonstrated that previous change on the IAT was a significant predictor of later change on the PDSS (YIAT p < .05, Cohen’s d = .65). Thus, all of the primary findings regarding cognitive predictors of change were similar, regardless of the scoring algorithm used for the IAT. The only notable difference was that, using the original scoring algorithm, change on the PDSS as a predictor of change on the IAT did reach significance (YPDSS, p < .05, Cohen’s d = .37), whereas it did not reach significance using the revised algorithm. The actual change in effect size was very minor, however (.41 versus .37), suggesting the magnitude of the effect did not differ meaningfully across the two scoring methods.
Footnotes
All participants agreed during the informed consent stage to random assignment, which involved either immediately joining the next treatment group that was starting or being part of a waitlist condition that would wait approximately 12 weeks before starting treatment. Our central question concerned within-group change over the course of treatment, rather than comparison across treatment conditions. Thus a sequential assignment design was used to preferentially allocate individuals to the immediate treatment condition (N=35 out of the 43). Individuals in the delayed, waitlist condition (N=8) only completed the assessment battery at the start and end of the 12-week time-frame, and then joined the next available group and followed the same repeated measures assessment protocol as the immediate treatment group. Treatment groups started approximately three times per year at 4- to 6-month intervals and all participants were assigned to the immediate or delayed treatment group based on timing of their entry into the study and the remaining time before the next group. The small waitlist group occurred because we had only a small number of participants join the study at times where they would have had sufficient time before the next group to complete the 12-week waitlist assessment, and because three individuals assigned to the waitlist condition did not ultimately enter treatment (so their data are not included in these analyses, though they are reflected in the Consort figure). Importantly, all participants agreed to random assignment, so there would be no reason to expect baseline differences between the groups. Further, comparison of pre-treatment panic and depression symptom severity using independent samples t-tests indicated no group differences (both p > .10). Thus, as planned to maximize power, participants from both the delayed and immediate treatment groups were combined for the current analyses to examine change over the course of treatment.
When compared to the 20 participants who chose not to engage in treatment, the 43 who started treatment endorsed lower scores on the BDI-II at intake (t(61) = 2.59, p < .05, d = 0.66) and also reported a higher mean level of education (t(61) = 2.16, p < .05, d = 0.55). The two groups did not differ in terms of panic severity at intake (t(61) = 1.57, p > .10, d = 0.41), total duration of panic (t(61) = 0.78, p > .10, d = 0.21), age (t(61) = 1.96, p = .06, d = 0.55), gender (X2 = 1.67, p > .10), or number of comorbid diagnoses at intake(t(61) = 0.61, p > .10, d = 0.17).
The assessments reported here are part of a larger study evaluating a range of cognitive biases in panic disorder.
The decision to use all possible data was made so that we would have the most available power. Furthermore, exploratory analyses indicated no substantial differences in the primary results when including or excluding participants with incomplete data.
We chose to focus on linear (versus nonlinear) change: 1) so that we could estimate the fewest parameters, 2) because the data did not provide a clear picture of non-linear change (nor did the fit indices improve substantially when we examined non-linear change), and 3) because our primary focus here is to investigate dynamic change in multiple variables rather than fit the best curve to the data (although these goals are not mutually exclusive).
Publisher's Disclaimer: The following manuscript is the final accepted manuscript. It has not been subjected to the final copyediting, fact-checking, and proofreading required for formal publication. It is not the definitive, publisher-authenticated version. The American Psychological Association and its Council of Editors disclaim any responsibility or liabilities for errors or omissions of this manuscript version, any version derived from this manuscript by NIH, or other third parties. The published version is available at http://www.apa.org/journals/ccp.
References
- Barber JP, Connolly MB, Crits-Christoph P, Gladis L, Siqueland L. Alliance predicts patients’ outcome beyond in-treatment change in symptoms. Journal of Consulting and Clinical Psychology. 2000;68:1027–1032. doi: 10.1037//0022-006x.68.6.1027. [DOI] [PubMed] [Google Scholar]
- Barlow DH, Craske MG. Mastery of your anxiety and panic-II. Albany, NY: Graywind; 1994. [Google Scholar]
- Beck AT, Emery G, Greenberg RI. Anxiety disorders and phobias. New York: Basic Books; 1985. [Google Scholar]
- Beck JG, Stanley MA, Averill PM, Baldwin LE, Deagle EA., III Attention and memory for threat in panic disorder. Behaviour Research and Therapy. 1992;30:619–629. doi: 10.1016/0005-7967(92)90007-4. [DOI] [PubMed] [Google Scholar]
- Beck AT, Steer RA, Brown GK. Beck Depression Inventory—II Manual. San Antoino, TX: The Psychological Corporation; 1996. [Google Scholar]
- Becker E, Rinck M, Margraf J. Memory bias in panic disorder. Journal of Abnormal Psychology. 1994;103:396–399. doi: 10.1037//0021-843x.103.2.396. [DOI] [PubMed] [Google Scholar]
- Blair IV. The malleability of automatic stereotypes and prejudice. Personality and Social Psychology Review. 2002;6:242–261. [Google Scholar]
- Casey LM, Newcombe PA, Oei TPS. Cognitive mediation of panic severity: The role of catastrophic misinterpretation of bodily sensations and panic self-efficacy. Cognitive Therapy and Research. 2005;29:187–200. doi: 10.1016/S0887-6185(02)00257-8. [DOI] [PubMed] [Google Scholar]
- Casey LM, Oei TPS, Newcombe PA. Looking beyond the negatives: A time period analysis of positive cognitions, negative cognitions, and working alliance in cognitive behavior therapy for panic disorder. Psychotherapy Research. 2005;15:55–68. [Google Scholar]
- Chambless DL, Gracely EJ. Fear of fear and the anxiety disorders. Cognitive Therapy and Research. 1989;13:9–20. [Google Scholar]
- Clark DM. A cognitive approach to panic. Behaviour Research and Therapy. 1986;24:461–470. doi: 10.1016/0005-7967(86)90011-2. [DOI] [PubMed] [Google Scholar]
- Clark DM, Salkovskis PM, Hackmann A, Wells A, Ludgate J, Gelder M. Brief cognitive therapy for panic disorder. Journal of Consulting and Clinical Psychology. 1999;67:583–589. doi: 10.1037//0022-006x.67.4.583. [DOI] [PubMed] [Google Scholar]
- Clark DM, Salkovskis PM, Öst Lars-Göran, Breitholtz E, Koehler KA, Westling BE, Jeavons A, Gelder M. Misinterpretation of body sensations in panic disorder. Journal of Consulting and Clinical Psychology. 1997;65:203–213. doi: 10.1037//0022-006x.65.2.203. [DOI] [PubMed] [Google Scholar]
- Clark LA, Watson D, Mineka S. Temperament, personality, and the mood and anxiety disorders. Journal of Abnormal Psychology. 1994;103:103–116. [PubMed] [Google Scholar]
- Cloitre M, Shear KM, Cancienne J, Zeitlin SB. Implicit and explicit memory for catastrophic associations to bodily sensation words in panic disorder. Cognitive Therapy and Research. 1994;18:225–240. [Google Scholar]
- Correll J, Spencer S, Zanna M. An affirmed self and an open mind: Self-affirmation and sensitivity to argument strength. Journal of Experimental Social Psychology. 2004;40:350–356. [Google Scholar]
- DeRubeis RJ, Evans MD, Hollon SD, Garvey MJ, Grove WM, Tuason VB. How does cognitive therapy work? Cognitive change and symptom change in cognitive therapy and pharmacotherapy for depression. Journal of Consulting and Clinical Psychology. 1990;58:862–869. doi: 10.1037//0022-006x.58.6.862. [DOI] [PubMed] [Google Scholar]
- Ehlers A, Margraf J, Davies S, Roth WT. Selective processing of threat cues in participants with panic attack. Cognition and Emotion. 1988;2:201–219. [Google Scholar]
- Enders CK. The performance of the full information maximum likelihood estimator in multiple regression models with missing data. Educational and Psychological Measurement. 2001;61:713–740. [Google Scholar]
- Fazio RH. On the automatic activation of associated evaluations: An overview. Cognition and Emotion. 2001;15:115–141. [Google Scholar]
- First MB, Spitzer RL, Gibbon M, Williams JBW. Structured clinical interview for DSM-IV Axis I disorders. Washington, DC: American Psychiatric Association; 1995. [Google Scholar]
- Gould RA, Otto MW, Pollack MH. A meta-analysis of treatment outcome for panic disorder. Clinical Psychology Review. 1995;15:819–844. [Google Scholar]
- Greenwald AG, Banaji MR. Implicit social cognition: Attitudes, self-esteem, and stereotypes. Psychological Review. 1995;102:4–27. doi: 10.1037/0033-295x.102.1.4. [DOI] [PubMed] [Google Scholar]
- Greenwald AG, McGhee DE, Schwartz JLK. Measuring individual differences in implicit cognition: The implicit association test. Journal of Personality and Social Psychology. 1998;74:1464–1480. doi: 10.1037//0022-3514.74.6.1464. [DOI] [PubMed] [Google Scholar]
- Greenwald AG, Nosek BA. Health of the Implicit Association Test at age 3. Zeitschrift für Experimentelle Psychologie. 2001;48:85–93. doi: 10.1026//0949-3946.48.2.85. [DOI] [PubMed] [Google Scholar]
- Greenwald AG, Nosek BA, Banaji MR. Understanding and using the Implicit Association Test: 1. An improved scoring algorithm. Journal of Personality and Social Psychology. 2003;85:197–216. doi: 10.1037/0022-3514.85.2.197. [DOI] [PubMed] [Google Scholar]
- Hawley LL, Ho MHR, Zuroff DC, Blatt SJ. The Relationship of Perfectionism, Depression, and Therapeutic Alliance During Treatment for Depression: Latent Difference Score Analysis. Journal of Consulting and Clinical Psychology. 2006;74:930–942. doi: 10.1037/0022-006X.74.5.930. [DOI] [PubMed] [Google Scholar]
- Hicks TV, Leitenberg H, Barlow DH. Physical, mental, and social catastrophic cognitions as prognostic factors in cognitive-behavioral and pharmacological treatments for panic disorder. Journal of Consulting and Clinical Psychology. 2005;73:506–514. doi: 10.1037/0022-006X.73.3.506. [DOI] [PubMed] [Google Scholar]
- Hoffart A. Cognitive and guided mastery therapy of agoraphobia: Long-term outcome and mechanisms of change. Cognitive Therapy and Research. 1998;22:195–207. [Google Scholar]
- Hofmann SG, Meuret AE, Rosenfield D, Suvak MK, Barlow DH, Gorman JM, et al. Preliminary evidence for cognitive mediation during cognitive-behavioral therapy of panic disorder. Journal of Consulting and Clinical Psychology. 2007;3:374–379. doi: 10.1037/0022-006X.75.3.374. [DOI] [PMC free article] [PubMed] [Google Scholar]
- Hope DA, Rapee RM, Heimberg RG, Dombeck MJ. Representations of the self in social phobia: Vulnerability to social threat. Cognitive Therapy and Research. 1990;14:177–189. [Google Scholar]
- Kazdin AE, Nock MK. Delineating mechanisms of change in child and adolescent therapy: Methodological issues and research recommendations. Journal of Child Psychology and Psychiatry. 2003;44:1116–1129. doi: 10.1111/1469-7610.00195. [DOI] [PubMed] [Google Scholar]
- Keijsers GPJ, Hoogduin CAL, Schaap CPDR. Prognostic factors in the behavioral treatment of panic disorder with and without agoraphobia. Behavior Therapy. 1994;25:689–708. [Google Scholar]
- Marks I, Basoglu M, Noshirvani H. Cognitive therapy in panic disorder. British Journal of Psychiatry. 1994;165:556–557. doi: 10.1192/bjp.165.4.556b. [DOI] [PubMed] [Google Scholar]
- Marks IM, Mathews AM. Brief standard self-rating for phobic patients. Behaviour Research and Therapy. 1979;17:263–267. doi: 10.1016/0005-7967(79)90041-x. [DOI] [PubMed] [Google Scholar]
- McArdle JJ. Dynamic but structural equation modeling of repeated measures data. In: Nesselroade JR, Cattell RB, editors. The Handbook of Multivariate Experimental Psychology. Plenum Press; New York: 1988. pp. 561–614. [Google Scholar]
- McArdle JJ, Hamagami F. Latent Difference Score Structural Models. In: Collins L, Sayer A, editors. New methods for the analysis of change. Washington, D.C: APA Press; 2001. [Google Scholar]
- McArdle JJ, Nesselroade JR. Growth curve analysis in contemporary psychological research. In: Schinka J, Velicer W, editors. Comprehensive handbook of psychology, volume 2: Research Methods in Psychology. New York: Wiley; 2002. [Google Scholar]
- McNally RJ. Automaticity and the anxiety disorders. Behaviour Research and Therapy. 1995;33:747–754. doi: 10.1016/0005-7967(95)00015-p. [DOI] [PubMed] [Google Scholar]
- McNally RJ. On the scientific status of cognitive appraisal models of anxiety disorder. Behaviour Research and Therapy. 2001;39:513–521. doi: 10.1016/s0005-7967(00)00073-5. [DOI] [PubMed] [Google Scholar]
- McNally RJ, Foa EB. Cognition and agoraphobia: Bias in the interpretation of threat. Cognitive Therapy and Research. 1987;11:567–581. [Google Scholar]
- Muthen LK, Muthen BO. User’s guide. 4. Los Angeles: Muthen & Muthen; 2006. Mplus: The comprehensive modeling program for applied researchers. [Google Scholar]
- Muthén LK, Muthén BO. How to use a Monte Carlo study to decide on sample size and determine power. Structural Equation Modeling. 2002;4:599–620. [Google Scholar]
- Nosek BA, Greenwald AG, Banaji MR. The Implicit Association Test at age 7: A methodological and conceptual review. In: Bargh JA, editor. Social Psychology and the Unconscious: The Automaticity of Higher Mental Processes. Psychology Press; 2006. pp. 265–292. [Google Scholar]
- Nosek BA, Sriram N. Faulty assumptions: A comment on Blanton, Jaccard, Gonzales, and Christie (2006) Journal of Experimental Social Psychology. 2007;43:393–398. doi: 10.1016/j.jesp.2006.10.018. [DOI] [PMC free article] [PubMed] [Google Scholar]
- Nunn JD, Stevenson RJ, Whalan G. Selective memory effects in agoraphobic patients. British Journal of Clinical Psychology. 1984;23:195–201. doi: 10.1111/j.2044-8260.1984.tb00646.x. [DOI] [PubMed] [Google Scholar]
- Oei TPS, Llamas M, Devilly GJ. The efficacy and cognitive processes of cognitive behaviour therapy in the treatment of panic disorder with agoraphobia. Behavioural and Cognitive Psychotherapy. 1999;27:63–88. [Google Scholar]
- Otto MW, Pollack MH, Penava SJ, Zucker BG. Group cognitive-behavior therapy for patients failing to respond to pharmacology for panic disorder: A clinical case series. Behaviour Research and Therapy. 1999;37:763–770. doi: 10.1016/s0005-7967(98)00176-4. [DOI] [PubMed] [Google Scholar]
- Penava SJ, Otto MW, Maki KM, Pollack MH. Rate of improvement during cognitive-behavioral group treatment for panic disorder. Behaviour Research and Therapy. 1998;36:665–673. doi: 10.1016/s0005-7967(98)00035-7. [DOI] [PubMed] [Google Scholar]
- Posner MI, Warren RE. Traces, concepts, and conscious constructions. In: Melton AW, Martin E, editors. Coding processes in human memory. Oxford, England: V. H. Winston & Sons; 1972. pp. 25–43. [Google Scholar]
- Poulton RG, Andrews G. Change in danger cognitions in agoraphobia and social phobia during treatment. Behaviour Research and Therapy. 1996;34:413–421. doi: 10.1016/0005-7967(96)00009-5. [DOI] [PubMed] [Google Scholar]
- Rachman S. Psychological treatment of panic: Mechanisms. In: Wolfe BE, Maser JD, editors. Treatment of panic disorder: A consensus development conference. Washington, DC, US: American Psychiatric Association; 1994. pp. 133–148. [Google Scholar]
- Reiss S, Peterson RA, Gursky DM, McNally RJ. Anxiety sensitivity, anxiety frequency and the prediction of fearfulness. Behaviour Research and Therapy. 1986;24:1–8. doi: 10.1016/0005-7967(86)90143-9. [DOI] [PubMed] [Google Scholar]
- Segal ZV. Appraisal of the self-schema construct in cognitive models of depression. Psychological Bulletin. 1988;103:147–162. doi: 10.1037/0033-2909.103.2.147. [DOI] [PubMed] [Google Scholar]
- Seligman MEP. Competing theories of panic. In: Rachman S, Maser JD, editors. Panic: Psychological perspectives. Hillsdale, NJ: Lawrence Erlbaum Associates, Inc; 1988. pp. 321–229. [Google Scholar]
- Shear MK, Brown TA, Barlow DH, Money R, Sholomskas DE, Woods SW, Gorman JM, Papp LA. Multicenter collaborative Panic Disorder Severity Scale. American Journal of Psychiatry. 1997;154:1571–1575. doi: 10.1176/ajp.154.11.1571. [DOI] [PubMed] [Google Scholar]
- Smits JAJ, Powers MB, Cho Y. Mechanism of change in cognitive-behavioral treatment of panic disorder: Evidence of the fear of fear mediational hypothesis. Journal of Consulting and Clinical Psychology. 2004;72:646–652. doi: 10.1037/0022-006X.72.4.646. [DOI] [PubMed] [Google Scholar]
- Teachman BA. Information processing and anxiety sensitivity: Cognitive vulnerability to panic reflected in interpretation and memory biases. Cognitive Therapy and Research. 2005;29:483–503. [Google Scholar]
- Teachman BA, Smith-Janik SB, Sapoito J. Information processing biases and panic disorder: Relationships among cognitive and symptom measures. Behaviour Research and Therapy. 2007;45:1791–1811. doi: 10.1016/j.brat.2007.01.009. [DOI] [PMC free article] [PubMed] [Google Scholar]
- Teachman BA, Woody S. Automatic processing among individuals with spider phobia: Change in implicit fear associations following treatment. Journal of Abnormal Psychology. 2003;112:100–109. [PubMed] [Google Scholar]
- Telch MJ, Shermis M, Lucas J. Anxiety sensitivity: unitary personality trait or domain-specific appraisals? Journal of Anxiety Disorders. 1989;3:25–32. [Google Scholar]
- Wenzel A, Sharp IR, Brown GK, Greenberg RL, Beck AT. Dysfunctional beliefs in panic disorders: The Panic Belief Inventory. Behaviour Research and Therapy. 2006;44:819–833. doi: 10.1016/j.brat.2005.06.001. [DOI] [PubMed] [Google Scholar]
- Wenzel A, Sharp IR, Sokol L. Attentional fixation in panic disorder. Cognitive Behaviour Therapy. 2006;35:65–73. doi: 10.1080/16506070600621914. [DOI] [PubMed] [Google Scholar]
- Wolpe J, Rowan VC. Panic disorder: A product of classical conditioning. Behaviour Research and Therapy. 1988;26:441–450. doi: 10.1016/0005-7967(88)90138-6. [DOI] [PubMed] [Google Scholar]
- Young JE. Cognitive therapy for personality disorders: A schema-focused approach. 3. Sarasota, FL, USA: Professional Resource Press/Professional Resource Exchange, Inc; 1999. [Google Scholar]
- Zuwerink JR, Devine PG. Attitude importance and resistance to persuasion: It's more than just the thought that counts. Journal of Personality and Social Psychology. 1996;70:931–944. [Google Scholar]