

Abstract
The functional properties of the microcirculation crucially depend on its angioarchitecture, i.e. vessel arrangement and vessel morphology. The microcirculation is subject to continuous dynamic structural adaptation (remodeling) controlled by hemodynamic and metabolic stimuli. Due to the complexity of the interactions among stimuli, reactions and functional properties, adequate understanding of structural adaptation requires mathematical models in addition to experimental investigations. Mathematical models have been developed that allow prediction of realistic vascular properties based on generic patterns of vascular responses. These models can be used to investigate and predict distributions of vessels morphology consistent with certain putative adaptation principles of terminal vascular beds in response to local hemodynamic and metabolic conditions. They have suggested new hypotheses, including the importance of conducted responses in network adaptation, and can explain the mechanisms underlying observed structural and functional network properties. In the future, the value of such models can be enhanced by including the effects of longitudinal stretch and pulsatility, the relationship between acute tone and structural adaptation, and the description of molecular and cellular mechanisms underlying structural responses of microvessels.
Keywords: shear stress, pressure, wall stress, angioadaptation, conducted response
Introduction
The basic outline of the vascular system is determined during development by genetic programming, guided by the unique temporal and spatial patterns of structural and molecular features available in the embryo. With establishment of blood flow, control of vascular development is increasingly taken over by feedback signals derived from vascular function including blood flow (shear stress), and blood pressure (circumferential wall stress) in addition to those derived from the metabolic state of the tissue. Mechanical and molecular signals also govern the postnatal structural adaptation of vascular beds with respect to vessel number, diameter, wall thickness and length, in response to functional requirements.
In this process of angioadaptation61, the properties of vascular beds are determined by the interplay between vascular and cellular reactions to hemodynamic and molecular signals and the functional implications of these reactions, constituting a complex feedback system. Under physiological conditions including development, growth and physical exercise, angioadaptive responses lead to adequate adjustment of the properties of vascular beds.
In pathophysiological situations including inflammation, wound healing and collateralization 5, structural adaptation is essential for the regeneration and repair of vessels. However, pathophysiological changes of vascular response characteristics or environmental conditions may lead to vascular mal-adaptation, e.g. inward remodeling and rarefaction in hypertension 20; 29; 44 or abnormal vascular properties in tumors.
Structural adaptation can be interpreted as a feedback regulation of vascular morphology in response to available functional stimuli sensed in the vessel or in the tissue. Based on experimental and theoretical considerations, a number of feedback mechanisms in structural adaptation have been proposed. The most prominent example is probably the control of wall shear stress by shear stress dependent change in vessel diameter 23; 24; 51. The parallel action of multiple feedback mechanisms leads to complex cause and effect relations, in which structural and functional characteristics cannot easily be traced back to the underlying mechanisms. Such a system is not easily understood by intuitive or qualitative approaches. Therefore, this review discusses studies aimed at understanding the mechanisms of vascular adaptation and the requirements of stability and functionality by combining experimental approaches with mathematical models. Emphasis is placed on the mechanisms controlling vascular lumen diameter. As a consequence of Poiseuille's law, this structural parameter has critical importance in determining the distribution of blood flow and hence the functional properties of a vascular network.
This concept of structural adaptation implies a high plasticity of the vascular phenotype within microvascular beds (Figure 1). According to this concept, vessel characteristics are not fully determined by differentiation or epigenetic modification, but are continuously controlled by environmental factors. Such characteristics include not only vessel diameter and wall thickness, but also permeability and molecular markers of arterial or venous phenotypes. In principle, a persistent change of the direction of the perfusion 33 should lead to reversal of the arterio-venous polarity of a given microvascular network. The degree of plasticity may vary with vessel size. Studies with grafted conduit vessels 9; 11; 22 show that they adapt according to the situation in which they are placed, although they do not completely attain the phenotype of the original vessel that they replace. A corollary of this plasticity is the fact that there are no inherent bounds or restrictions with respect to the structural and functional results of the adaptive process. The outcome is not calibrated against a ‘blueprint’ of the desired structure or function and depends only on prevailing conditions. Therefore, the response characteristics must be balanced to guarantee adequate structural and functional properties and stability under a range of external conditions. Here, again, the complexity of the mutual interactions requires the use of mathematical models in order to gain quantitative understanding of the system design and the inherent requirements.
Figure 1.
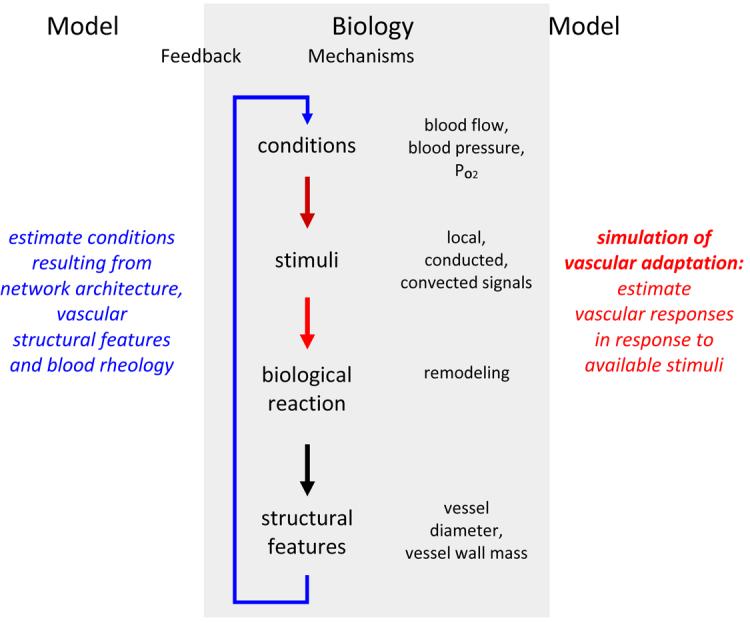
Schematic representation of biological mechanisms of structural vascular adaptation (remodeling). A feedback loop links network structures resulting from adaptation and functional network properties which in turn are the basis for structural adaptation (center). The use of mathematical modeling approaches includes the calculation of functional properties (hemodynamic and metabolic models, left) and the estimation of adaptive vascular responses to these conditions (right).
The process of angioadaptation includes not only the remodeling of existing vessels but also the formation of new vessels. A substantial number of models have been presented that focus on the increase in vessel number by angiogenesis, e.g. during development or tumor growth. This topic is the subject of separate review in this issue 34 and will not be addressed here. Also, the present review focuses on steady state structural adaptation and not on dynamic events 16 which occur in response to sudden changes of the local conditions.
Development of modeling approaches
For the purposes of predicting blood flow distribution, a vascular network may be regarded as a system of interconnected segments, each having a resistance to blood flow defined by where
| (1) |
ΔP is the pressure drop along the segment, Q is the flow rate, L is the length, η is the apparent viscosity of blood and D is the luminal diameter 55. Given boundary conditions on the segments feeding and draining the network, the flows in all segments may be computed by solving a system of linear equations for the pressures at the junction points 53. The apparent viscosity depends on vessel diameter and hematocrit 39; 49, and hematocrit is generally non-uniformly distributed as a result of unequal phase separation at bifurcations 38, necessitating an iterative solution procedure. The resulting distribution of oxygen levels within microvessels may then be computed, using information about tissue oxygen demand as used in some studies 40. When available, detailed information on network geometry can be used as a basis for more precise calculations 14; 18; 54.
In structural adaptation models, each segment diameter Di(t) (i = 1,…,N) is considered as a function of time t. The adaptive behavior may be represented by a system of differential equations
| (2) |
Here, S1, …,SM denote a set of signals or stimuli acting on segment i, and themselves depend on the hemodynamic and metabolic conditions in that segment, and possibly on conditions in other segments and in the surrounding tissue. A key feature of this modeling approach is that the same function F is assumed to apply to all segments. Thus, a set of generic responses or ‘rules’ is assumed to govern the behavior of all segments, when subjected to a given set of signals. The underlying biological assumption is that vessels are completely plastic and are able to change their phenotype without restrictions in response to changing local conditions. This assumption may be violated if a definitive differentiation has led to changes in vascular structure or genetic repertoire which persist irrespective of the prevailing conditions. The assumption of complete plasticity may be justified to a large extent in the microcirculation but less so in larger conduit vessels.
When many adaptive segments are connected together in a normal network, the response ‘rules’ must permit the segments to act cooperatively to generate biologically realistic and functionally adequate behaviors. The development of theoretical models for structural adaptation has involved the sequential identification and incorporation of a number of signals, as discussed in the following sections.
Role of wall shear stress
Early last century, Murray 32 showed theoretically that the overall energy ‘cost’ of maintaining blood vessels and the blood and of pumping blood through the vascular system is minimized if the blood flow in each segment is proportional to the cube of the vessel diameter, a relationship known as Murray's law. The existence of such a relationship has been tested and mostly confirmed in a number of vascular beds 15; 28; 58; 62. From basic principles of hemodynamics, the wall shear stress is given by τ = 32Qη /(πD3), and is therefore approximately constant in a set of vessels satisfying Murray's law. This led to the suggestion 23; 24; 51 that such a design would be generated if each vessel could sense wall shear stress and adjust its diameter so as to achieve a uniform level. Vascular reactions to shear stress have been known since Thoma's observation 59 of an increase of vessel diameter in vessels carrying a high blood flow and vice versa. Such behavior can be represented mathematically by setting F = k(τ − τref) in eq. (2) where τ = 32Qη/(πD3) and τref is a target or reference value of wall shear stress. If the flow rate Q were to increase, the increase in shear stress would elicit a diameter increase which in turn would bring the shear stress back to the original level.
However, the adaptation rules must yield appropriate behavior not only in a single segment but when segments are interconnected. It is helpful to consider the case of two identical segments connected in parallel, and fed by a fixed total flow rate. The pressure drop in both segments is the same. The hemodynamic relationship τ = ΔPD/(4l) shows that if the diameter of one segment is increased, it will experience a higher shear stress than the other segment and tend to increase further in diameter. The eventual result of this unstable positive feedback is that the diameter of one segment approaches zero and the other carries the entire flow. This defect in the theory of structural adaptation in response to shear stress alone was pointed out in several studies 17; 51 19.
Role of intravascular pressure
The shear stress in the vascular system differs significantly between arterial and venous vessels, with consistently higher levels of shear stress in the arterial system. The transition between the two shear stress domains occurs in the resistance vasculature of the peripheral beds 41; 43; 47; 51. These observations led to the development of the ‘pressure-shear’ hypothesis 45 stating that the target value for shear stress is a function of the local intravascular pressure. They show that in addition to shear stress, other stimuli must be included in the control of vascular adaptation, and thus the scope of Murray's law is limited. Structural responses to pressure are well established and have been linked to the development of hypertension 10; 30; 31; 43; 60. If increases in transmural pressure (P) lead to an increase in vessel wall thickness and/or a reduction of vessel diameter, these responses can act to stabilize circumferential wall stress (σ = PD/2w), where w is the vessel wall thickness), similar to the stabilization of shear stress addressed above. Due to the higher pressure level on the arterial side vascular pressure, this leads to smaller, thicker wall vessels on the arterial side and thus contributes to arterio-venous differentiation 45. The hypothesis that circumferential stress generated by intravascular pressure stimulates the formation of arcade arterioles from capillaries was tested in a network model by Price and Skalak 36; 37.
Role of metabolic stimuli
It is generally accepted that vascular diameter is also controlled by the metabolic needs of the tissue, as reflected in the local oxygen partial pressure or metabolic signal substances 1-4; 43; 45. The inclusion of responses to metabolic stimuli can resolve the problem of instability resulting from responses to wall shear stress, mentioned above. When the diameter of a given segment drops to a level at which the flow is inadequate to satisfy metabolic demands, for instance causing hypoxia, then a growth signal is generated which inhibits further decrease in diameter. This concept was introduced in the model of Pries et al. 46 by including a flow-dependent growth signal that increased with decreasing flow rate in each segment. The mathematical analysis showed that inclusion of such a signal can lead to stable network structures including multiple parallel pathways. In subsequent models 40; 43, this approach was replaced by an explicit simulation of vascular oxygen levels. The responsiveness to oxygen levels is not necessarily direct, but likely occurs through the oxygen-dependent production or uptake of other metabolites or growth factors.
Role of conducted responses
In order to test models for structural adaptation, the authors (Pries et al. 1998, 2001, 2005) used reconstructions of mesenteric microvascular networks with 300-1000 vessel segments in which flow velocities had been measured. This allowed a detailed comparison of the diameter and flow distributions obtained from the simulated adaptation with the measured values. Using this approach, they found that models including only the signals already mentioned (wall shear stress, intravascular pressure, local metabolic stimulus) were not capable of predicting observed distributions of segment diameters and flow velocities. The additional assumption of upstream and downstream information transfer along vessels was needed in order to achieve adequate agreement with observed results.
Integrated model
In further development of the model41, the upstream information transfer was attributed to conducted responses and the downstream transfer to convection of metabolites (Figure 2). The roles of the individual mechanisms were:
Figure 2.

Integration of hemodynamic and metabolic stimuli in microvascular networks. Effects of blood flow, blood pressure and oxygen availability elicit local signals. Adequate adaptation of proximal feeding and draining vessels also requires the transfer of information on these local conditions 40; 42; 56. In the downstream direction, the most probable mechanism of information transfer is the convection of metabolic signaling substances 7; 8; 26; 52. A possible route for upstream information transfer is the conduction of electrical signals in the vessel wall 6; 50; 57. In order to avoid diameter increase of short proximal arterio-venous connections and consequential shunting of blood flow, it has to be assumed that conduction occurs in the upstream direction only at vascular branch points.
Shear stress responses homogenize shear stress along flow pathways and thereby reduce energy dissipation;
Pressure responses establish smaller vessel diameters and higher shear stress on the arterial side of vascular networks 45. This arterio-venous asymmetry is of prime functional importance for flow regulation requiring high arterial flow resistance and for fluid balance requiring low capillary pressure.
Metabolic stimuli couple vessel diameters to the local oxygen demand and prevent the collapse of parallel pathways;
Information transfer via convection and conduction maintains larger diameters in proximal feeding and draining vessels as compared to short arterio-venous connections, thus preventing the establishment of functional shunts.
Conducted responses influencing the regulation of vascular tone have been observed by Segal and Duling 57. The propagation of angioadaptive signals in the vessel wall by conduction of electrical signals through gap junctions between vascular cells (‘conducted response’) has subsequently been described in many animal models (e.g. 6; 27; 50). Interestingly, several molecules implicated in the conducted response, e.g., connexin 37 and connexin 40, are selectively expressed in embryonic arteries, suggesting that these molecules may also play a pivotal role in early flow-controlled angioadaptation.
The model of vascular adaptation was used to investigate the importance of information transfer for structural adaptation, by reducing or abolishing conduction in the upstream direction 41; 42; 46. As shown in Figure 3, this leads to the generation of a short proximal arterio-venous shunt which carries most of the inflow of the network. In the more peripheral regions of the network, the arterial vessels nearly disappeared and hypoxia is observed.
Figure 3.
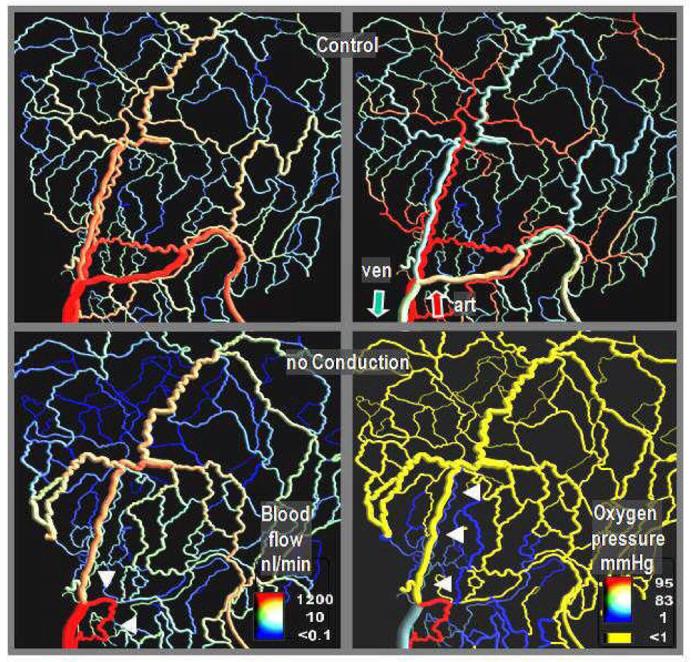
Blood flow distribution (left) and intravascular oxygen partial pressure resulting from simulations of vascular adaptation, with (top row) and without (bottom row) signal propagation along arterial vessel walls via conduction. Calculations were performed for a network in the rat mesentery (546 vessel segments) investigated by intravital microscopy. In the absence of conduction, most arterial vessels (distinguished by the high oxygen partial pressure on the top right panel) shrink to a very narrow diameter (arrow heads on the lower right panel). The blood flow mainly passes through a short arterio-venous shunt (arrow heads on the lower left panel) leading to oxygen depletion in large tissue areas. The results imply that increases in shear stress elicit eutrophic (or slightly hypertrophic/hypotrophic) outward remodeling, while wall stress increases lead to hypertrophic inward remodeling (methods described in 40; 42).
Circumferential wall tension and wall mass
In the above model, circumferential wall stress was not explicitly considered. Effects of pressure were implemented by assuming a pressure-dependent set point for shear stress regulation according to experimental data 45. Thus, results with respect to arterio-venous asymmetry and capillary pressure were not truly properties of the adaptive system but to some degree imposed on it. Jacobsen and coworkers 20 considered reactions to shear stress and mean wall stress in hexagonal vessel networks. They showed that a typical reaction of vascular structure in hypertension, i.e. eutrophic inward remodeling, required a reduction in vascular sensitivity to shear stress. However, the set points for average wall stress were again fitted to literature data 41.
In a further development of their model, the authors were able to avoid this limitation 43. Separate reactions of mid-wall vessel diameter (Dm, eutrophic remodeling) and vessel wall area (Aw, growth / involution) to shear stress, transmural pressure and local metabolic state (Figure 4) were considered, including convection and conducted responses. The system of equations (2) was extended to include equations for the evolution of vessel wall area of each segment:
| (3) |
| (4) |
where w is the wall thickness. The right hand sides in these equations give the integrated stimulus derived from the individual stimuli 43, corresponding to the function F in eq. (2):
The first terms represent hemodynamic stimuli dependent on τ and σ respectively. Here, τref, and σref are reference levels of τ and σ while ε is a small constant added to avoid singular behavior. kτd and kσg represent the respective sensitivities.
The second terms establish an attenuating effect of wall thickness on the hemodynamic sensitivity which was found to be necessary in order to obtain predictions consistent with experimental data. kwτ and kwσ are the respective sensitivities. Logarithmic functions were chosen to give consistent sensitivity to τ, σ and w over a wide range.
The third terms depends on the metabolic (Sm) and conducted (Sc) signals with the respective sensitivities kmd , kmg and kc. Sm is derived from the vascular convective flux (Jm) of a metabolic signal substance40: Sm = log(1 + Jm/[Q + QR]) where QR is a small constant included to avoid singular behavior at low blood flow values. Jm, in turn, is assumed to increase by additional input of each segment with ΔJm = Ls (1 − PO2/RO2) if the intravascular PO2 falls below a reference level RO2. Ls is the length of the segment. The conducted signal is assumed to depend on the value of the conducted signal (Jc): Sc = Jc/(Jc + J0) where J0 is again a small constant. In each segment, the mid-segment conducted signal, Jc, is related to that at the downstream end (Jcdown) and the local metabolic signal Jc = (Jcdown + Sm) A exp(−0.5Ls/L0), where L0 is the conduction length constant.
The fourth terms represent the tendency for inward remodeling (ksd) and involution (ksg) in the absence of hemodynamic or metabolic stimuli.
Based on the resulting changes in vessel diameter, the distributions of shear stress and wall stress are calculated as described above. Since the results obtained for the steady state are not influenced by a possible direct influence of shear stress on wall area and of wall stress on vessel diameter, they are omitted from the equations for clarity. These steps are iterated until a steady state is achieved in which the sum of all positive and negative stimuli for a given segment approaches zero. In this steady state, all relevant parameters (e.g. shear stress, wall stress, PO2) exhibit broad distributions with a number of relevant correlations to other parameters 40; 43; 46. Examples are the decline of the shear rate level by about one order of magnitude from the arterial to the venous side of the networks 45 and the strong correlation between vessel diameter and circumferential wall stress 43.
Figure 4.
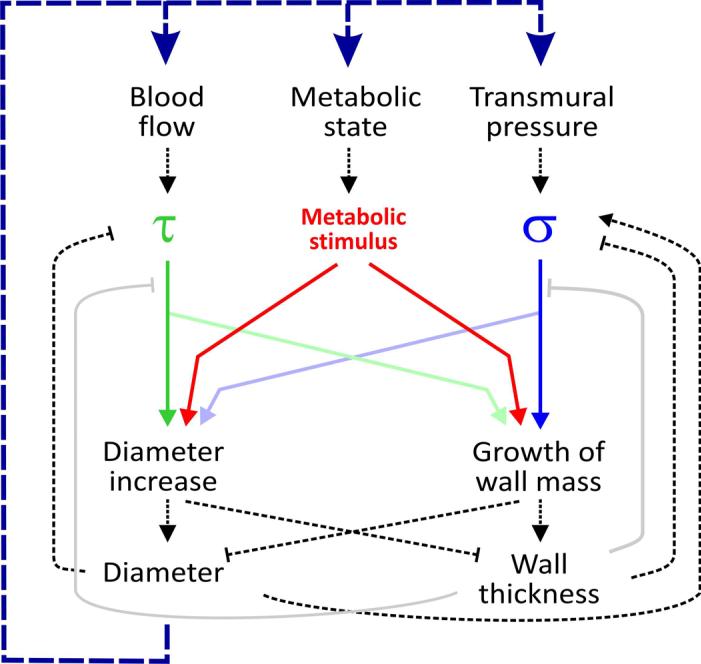
Local hemodynamic and metabolic signals in structural vascular adaptation in an individual vessel segment. The main hemodynamic stimuli are related to the blood flow through the vessel generating wall shear stress at the endothelial surface (τ) and to the transmural pressure difference causing circumferential wall stress (hub stress, σ). A metabolic stimulus is generated by the vessel and/or the tissue cells in response to the local oxygen availability. These stimuli elicit structural vascular responses (remodeling) in vessel diameter and vessel wall mass. The strength and nature of the underlying biological reactions, depicted as colored continuous lines (reactions to τ, σ and the metabolic state) grey continuous lines (effects of vessel wall thickness on sensitivity to τ and σ), critically determines the properties of the vascular bed. The dashed lines indicate physical relations of local nature (black, e.g. according to the law of Laplace) or indirectly via changes in the distribution of flow resistance, blood pressure and oxygen within the vascular network (blue line).
It is of note that this model used only generic mathematical relations between the hemodynamic and metabolic conditions and the related stimuli. No parametric representations of expected biological behavior were included. Therefore, network characteristics obtained by the model according to Figures 2 and 4 and the equations given above are truly emergent properties related to the assumed biological reactions. The comparison of distributions of flow velocity and diameter in individual segments allowed the estimation of the sensitivity parameters (kτd , kσg, kwτ, kwσ, kmd, kmg, and kc). With these values, the model is able to predict distributions of vessel diameter, wall thickness, shear stress, wall stress, pressure and volume flow that are close to those measured in vivo 43.
Model applications and predictions
Based on such a validation, mathematical simulation can be used to quantitatively investigate the impact of changes of systemic conditions and of biological mechanisms. In the context of structural adaptation, this approach has been used to examine changes in blood pressure and perfusion 20; 41; 43; 44; 47; 48, effects of growth factors 35, endothelial function 20; 43 and changes in the strength of conducted signals (Figure 4) 40; 46.
Simulation models have the advantage of allowing manipulation of individual biological mechanisms in a graded fashion and without unwanted compensations. Complete elimination of a signal or a response using biological ‘knockout’ approaches in experimental models can provide fundamental insights into biological mechanisms related to molecular function, but leads in some cases to extreme and unspecific reactions that reveal little about the role of the mechanisms involved. In contrast, the graded modifications possible in theoretical model simulations allow more precise interpretation of the sensitivity of the system to a specified intervention. Such findings may in turn stimulate additional experiments.
In figure 5, effects of changes in the shear stress sensitivity of diameter reactions (kτd in eq. 3) are shown to have biologically desirable as well as problematic effects. Increased shear stress sensitivity leads to more homogenous shear stress distributions and according to Murray's law, to decreased energy requirements for perfusion. Furthermore, shear stress sensitivity was shown to be a central mechanism for the coordination of diameter adaptation in larger feeding vessels in response to changes in metabolic demand in the capillary bed 42. However, increased shear stress sensitivity also reduces the decline of shear stress along flow pathways from the arteriolar to the venular portion of the network. According to equation (2), a higher shear stress on the arterial side corresponds to a higher pressure drop and thus to low capillary pressure levels 43, which are crucial for tissue fluid balance. Thus, model analysis shows that vascular reactions must balance the requirements for different physiological requirements and cannot be optimized solely with respect to low energy dissipation. Similar findings have been reported earlier for the effects of the balance between hemodynamic and metabolic sensitivity on energy dissipation, capillary pressure and oxygen deficit within the network 40.
Figure 5.
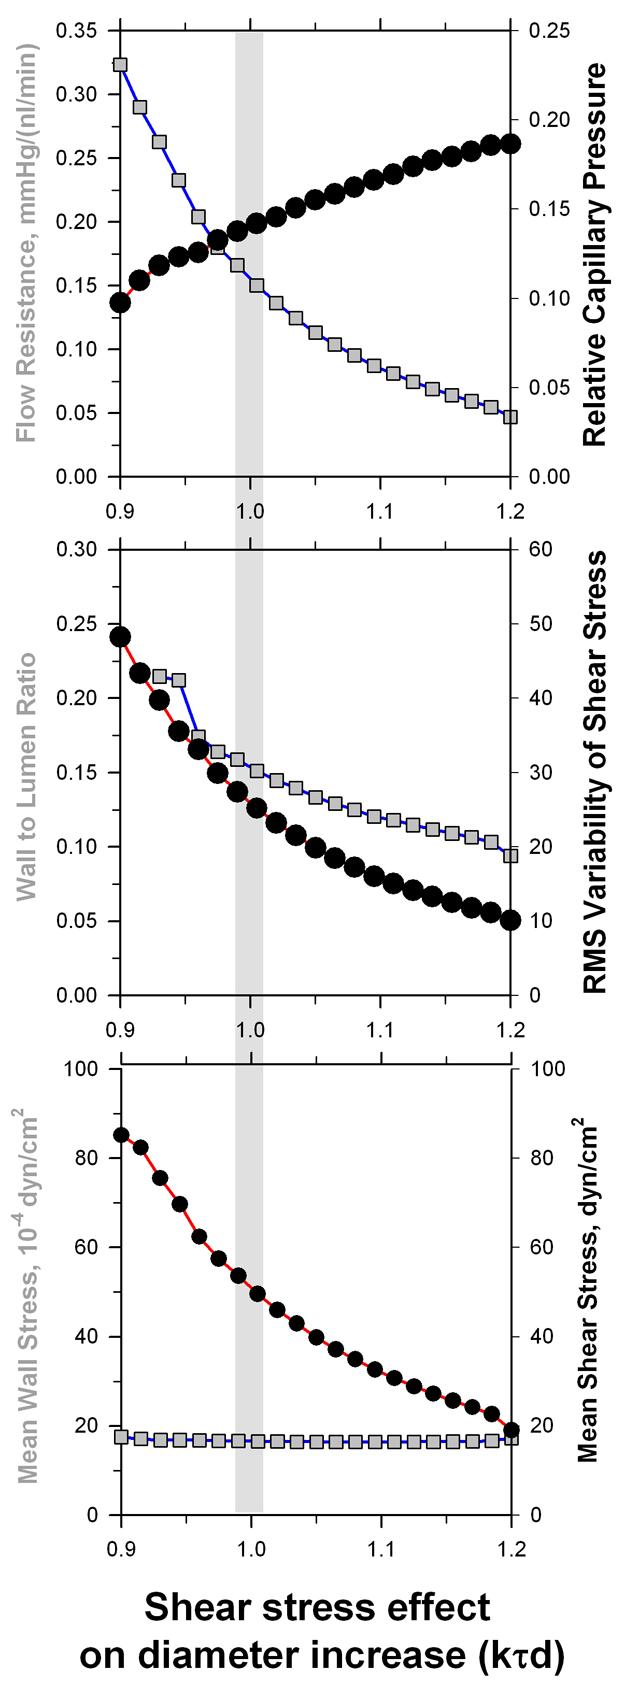
Dependence of structural and functional network parameters for graded changes of the sensitivity of vascular diameter reactions to wall shear stress (kτd in equation (3), standard reference value 1.0). Mean values for a vascular network with 546 individual vessel segments are given. The effects on mean capillary pressure relative to the difference between arterial input pressure and the venous outflow pressure (upper panel) and the root-mean-square variability of shear stress in individual vessel segments (middle panel) are highlighted. Increased shear stress sensitivity leads to a more homogeneous shear stress distribution, i.e. a closer adherence to the requirements of Murrey's optimization law. However, an increased reactivity to shear stress also reduces the arterio-venous difference in shear stress and pressure drop leading to an increased mean capillary pressure. This would increase net outward filtration from the microvascular bed and thus increase the risk of edema generation.
Another example of the predictive capacity of such models pertains to the role of the conducted response in structural adaptation. According to model results, maintenance of balanced perfusion in topologically heterogeneous microvascular networks requires information transfer upstream from capillaries to feeding arterioles 40; 43; 46, most likely effected by conduction of signals along the vessel wall 42 (Figure 3). This important role of conduction was suggested solely based on model simulations, since experimental studies of the conducted response have so far been restricted to the investigation of acute changes of smooth muscle tone. Development of suitable pharmacological and genetic tools should allow critical tests of this hypothesis in vivo in the foreseeable future.
Perspectives
The models described above are focused on the analysis of fundamental mechanisms and minimal requirements for steady-state structural adaptation of vessel diameter and wall mass. Obviously, this leaves a large number of additional dimensions to be explored, probably necessitating the inclusion of additional mechanisms. Such dimensions include pulsatility and external mechanical forces, changes of adaptive properties during development or pathophysiological states (inflammation, wound healing, tumor development), interactions with parenchymal cells in specific tissues, dynamics of vascular adaptation 16, interaction of vessel adaptation with angiogenesis and pruning 13, and interactions between structural adaptation and acute vascular tone 21. A major task for future work on these topics is to develop models that (i) include the relevant mechanisms, (ii) do not incorporate parametric descriptions of expected behavior, and (iii) are validated against experimental measurements.
Such models can predict functional behavior on the given level (vessels) and above (vessel networks). However, more detailed levels on smaller scales (cells, molecules) must be treated as black boxes. In the spirit of a ‘middle out’ approach 25, such models should be linked to higher levels to predict of organ behavior, and to lower levels to incorporate establish cellular and molecular models of angioadaptation. For the latter, e.g. the use of cellular automaton models has been introduced 12; 35.
Effects of multiple cooperating and competing stimuli are involved in vascular patterning and adaptation. The complexity of such systems typically requires the development of mathematical models. As discussed above, such models can yield significant insights, including improved understanding of the processes of vascular development, growth, adaptation and regression, and may provide a basis for new therapeutic interventions in diseases including cancer and hypertension that involve abnormal vascular structures.
Acknowledgements
This work was supported by DFG: FOR 341/TP1 and NIH Grant HL034555.
Reference List
- 1.Adair TH, Gay WJ, Montani JP. Growth regulation of the vascular system: evidence for a metabolic hypothesis. Am J Physiol. 1990;259:R393–R404. doi: 10.1152/ajpregu.1990.259.3.R393. [DOI] [PubMed] [Google Scholar]
- 2.Berne RM. Metabolic regulation of blood flow. Circ Res. 1964;14,15:I-261–I-268. [PubMed] [Google Scholar]
- 3.Berne RM, Knabb RM, Ely SW, Rubio R. Adenosine in the local regulation of blood flow: a brief overview. Fed Proc. 1983;42:3136–3142. [PubMed] [Google Scholar]
- 4.Björnberg J, Maspers M, Mellander S. Metabolic control of large-bore arterial resistance vessels, arterioles, and veins in cat skeletal muscle during exercise. Acta Physiol Scand. 1989;135:83–94. doi: 10.1111/j.1748-1716.1989.tb08555.x. [DOI] [PubMed] [Google Scholar]
- 5.Buschmann I, Schaper W. Arteriogenesis Versus Angiogenesis: Two Mechanisms of Vessel Growth. News Physiol Sci. 1999;14:121–125. doi: 10.1152/physiologyonline.1999.14.3.121. [DOI] [PubMed] [Google Scholar]
- 6.de Wit C, Wolfle SE, Hopfl B. Connexin-dependent communication within the vascular wall: contribution to the control of arteriolar diameter. Adv Cardiol. 2006;42:268–283. doi: 10.1159/000092575. [DOI] [PubMed] [Google Scholar]
- 7.Ellsworth ML. Red blood cell-derived ATP as a regulator of skeletal muscle perfusion. Med Sci Sports Exerc. 2004;36:35–41. doi: 10.1249/01.MSS.0000106284.80300.B2. [DOI] [PubMed] [Google Scholar]
- 8.Ellsworth ML, Forrester T, Ellis CG, Dietrich HH. The erythrocyte as a regulator of vascular tone. American Journal of Physiology. 1995;269(6 Pt 2):H2155–H2161. doi: 10.1152/ajpheart.1995.269.6.H2155. [DOI] [PubMed] [Google Scholar]
- 9.Fann JI, Sokoloff MH, Sarris GE, Yun KL, Kosek JC, Miller DC. The reversibility of canine vein-graft arterialization. Circulation. 1990;82:IV-9–IV-18. [PubMed] [Google Scholar]
- 10.Folkow B. “Structural autoregulation” - the local adaptation of vascular beds to chronic changes in pressure. In: Ciba Foundation Symposium 100, editor. Development of the vascular system. Pitman Books; London: 1983. pp. 56–79. [DOI] [PubMed] [Google Scholar]
- 11.Galt SW, Zwolak RM, Wagner RJ, Gilbertson JJ. Differential response of arteries and vein grafts to blood flow reduction. J Vasc Surg. 1993;17:563–570. [PubMed] [Google Scholar]
- 12.Gevertz JL, Torquato S. Modeling the effects of vasculature evolution on early brain tumor growth. J Theor Biol. 2006;243:517–531. doi: 10.1016/j.jtbi.2006.07.002. [DOI] [PubMed] [Google Scholar]
- 13.Godde R, Kurz H. Structural and biophysical simulation of angiogenesis and vascular remodeling. Dev Dyn. 2001;220:387–401. doi: 10.1002/dvdy.1118. [DOI] [PubMed] [Google Scholar]
- 14.Goldman D, Popel AS. Computational modeling of oxygen transport from complex capillary networks. Relation to the microcirculation physiome. Adv Exp Med Biol. 1999;471:555–563. doi: 10.1007/978-1-4615-4717-4_65. [DOI] [PubMed] [Google Scholar]
- 15.Griffith TM, Edwards DH. Basal EDRF activity helps to keep the geometrical configuration of arterial bifurcations close to the Murray optimum. J Theor Biol. 1990;146:545–573. doi: 10.1016/s0022-5193(05)80378-9. [DOI] [PubMed] [Google Scholar]
- 16.Gruionu G, Hoying JB, Pries AR, Secomb TW. Structural remodeling of mouse gracilis artery after chronic alteration in blood supply. Am J Physiol Heart Circ Physiol. 2005;288:H2047–H2054. doi: 10.1152/ajpheart.00496.2004. [DOI] [PubMed] [Google Scholar]
- 17.Hacking WJG, VanBavel E, Spaan JAE. Shear stress is not sufficient to control growth of vascular networks: a model study. Am J Physiol. 1996;270:H364–H375. doi: 10.1152/ajpheart.1996.270.1.H364. [DOI] [PubMed] [Google Scholar]
- 18.Hsu R, Secomb TW. A Green's function method for analysis of oxygen delivery to tissue by microvascular networks. Math Biosci. 1989;96:61–78. doi: 10.1016/0025-5564(89)90083-7. [DOI] [PubMed] [Google Scholar]
- 19.Hudetz AG, Kiani MF. The role of wall shear stress in microvascular network adaptation. Adv Exp Med Biol. 1992;316:31–39. doi: 10.1007/978-1-4615-3404-4_4. [DOI] [PubMed] [Google Scholar]
- 20.Jacobsen JC, Gustafsson F, Holstein-Rathlou NH. A model of physical factors in the structural adaptation of microvascular networks in normotension and hypertension. Physiol Meas. 2003;24:891–912. doi: 10.1088/0967-3334/24/4/007. [DOI] [PubMed] [Google Scholar]
- 21.Jacobsen JC, Mulvany MJ, Holstein-Rathlou NH. A mechanism for arteriolar remodeling based on maintenance of smooth muscle cell activation. Am J Physiol Regul Integr Comp Physiol. 2008 doi: 10.1152/ajpregu.00407.2007. [DOI] [PubMed] [Google Scholar]
- 22.Kalra M, Miller VM. Early remodeling of saphenous vein grafts: proliferation, migration and apoptosis of adventitial and medial cells occur simultaneously with changes in graft diameter and blood flow. J Vasc Res. 2000;37:576–584. doi: 10.1159/000054091. [DOI] [PubMed] [Google Scholar]
- 23.Kamiya A, Ando J, Shibata M, Masuda H. Roles of fluid shear stress in physiological regulation of vascular structure and function. Biorheology. 1988;25:271–278. doi: 10.3233/bir-1988-251-236. [DOI] [PubMed] [Google Scholar]
- 24.Kamiya A, Togawa T. Adaptive regulation of wall shear stress to flow change in the canine carotid artery. Am J Physiol. 1980;239:H14–H21. doi: 10.1152/ajpheart.1980.239.1.H14. [DOI] [PubMed] [Google Scholar]
- 25.Kinchla RA, Wolfe JM. The order of visual processing: “Top-down,”; “bottom-up”, or “middle-out”. Percept Psychophys. 1979;25:225–231. doi: 10.3758/bf03202991. [DOI] [PubMed] [Google Scholar]
- 26.Klotz KF, Gaehtgens P, Pries AR. Does luminal release of EDRF contribute to downstream microvascular tone? Pflügers Arch. 1995;430:978–983. doi: 10.1007/BF01837412. [DOI] [PubMed] [Google Scholar]
- 27.Looft-Wilson RC, Payne GW, Segal SS. Connexin expression and conducted vasodilation along arteriolar endothelium in mouse skeletal muscle. J Appl Physiol. 2004;97:1152–1158. doi: 10.1152/japplphysiol.00133.2004. [DOI] [PubMed] [Google Scholar]
- 28.Meuer HJ. Erythrocyte velocity and total blood flow in the extraembryonic circulation of early chick embryos determined by digital video technique. Microvasc Res. 1992;44:286–294. doi: 10.1016/0026-2862(92)90088-7. [DOI] [PubMed] [Google Scholar]
- 29.Mulvany MJ. Abnormalities of the resistance vasculature in hypertension: correction by vasodilator therapy. Pharmacol Rep. 2005;57(Suppl):144–150. [PubMed] [Google Scholar]
- 30.Mulvany MJ. Small artery remodeling and significance in the development of hypertension. News Physiol Sci. 2002;17:105–109. doi: 10.1152/nips.01366.2001. [DOI] [PubMed] [Google Scholar]
- 31.Mulvany MJ, Baumbach GL, Aalkjaer C, Heagerty AM, Korsgaard N, Schiffrin EL, Heistad DD. Vascular remodeling. Hypertension. 1996;28:505–506. [PubMed] [Google Scholar]
- 32.Murray CD. The physiological principle of minimum work applied to the angle of branching of arteries. J Gen Physiol. 1926;9:835–841. doi: 10.1085/jgp.9.6.835. [DOI] [PMC free article] [PubMed] [Google Scholar]
- 33.Niimi H, Nakano A, Komai Y, Seki J. Heterogeneity of capillary flow in the retrograde microcirculation induced in rat limb by arteriovenous shunting. Microvasc Res. 2005;70:23–31. doi: 10.1016/j.mvr.2005.04.002. [DOI] [PubMed] [Google Scholar]
- 34.Peirce SM. Microcirculation. 2008 doi: 10.1080/10739680802220331. This issue. [DOI] [PMC free article] [PubMed] [Google Scholar]
- 35.Peirce SM, Van Gieson EJ, Skalak TC. Multicellular simulation predicts microvascular patterning and in silico tissue assembly. FASEB J. 2004;18:731–733. doi: 10.1096/fj.03-0933fje. [DOI] [PubMed] [Google Scholar]
- 36.Price RJ, Skalak TC. Circumferential wall stress as a mechanism for arteriolar rarefaction and proliferation in a network model. Microvasc Res. 1994;47:188–202. doi: 10.1006/mvre.1994.1015. [DOI] [PubMed] [Google Scholar]
- 37.Price RJ, Skalak TC. A circumferential stress-growth rule predicts arcade arteriole formation in a network model. Microcirculation. 1995;2:41–51. doi: 10.3109/10739689509146758. [DOI] [PubMed] [Google Scholar]
- 38.Pries AR, Ley K, Claassen M, Gaehtgens P. Red cell distribution at microvascular bifurcations. Microvasc Res. 1989;38:81–101. doi: 10.1016/0026-2862(89)90018-6. [DOI] [PubMed] [Google Scholar]
- 39.Pries AR, Neuhaus D, Gaehtgens P. Blood viscosity in tube flow: dependence on diameter and hematocrit. Am J Physiol. 1992;263:H1770–H1778. doi: 10.1152/ajpheart.1992.263.6.H1770. [DOI] [PubMed] [Google Scholar]
- 40.Pries AR, Reglin B, Secomb TW. Structural adaptation of microvascular networks: functional roles of adaptive responses. Am J Physiol. 2001;281:H1015–H1025. doi: 10.1152/ajpheart.2001.281.3.H1015. [DOI] [PubMed] [Google Scholar]
- 41.Pries AR, Reglin B, Secomb TW. Structural adaptation of vascular networks: role of the pressure response. Hypertension. 2001;38:1476–1479. doi: 10.1161/hy1201.100592. [DOI] [PubMed] [Google Scholar]
- 42.Pries AR, Reglin B, Secomb TW. Structural response of microcirculatory networks to changes in demand: information transfer by shear stress. Am J Physiol. 2003;284:H2204–H2212. doi: 10.1152/ajpheart.00757.2002. [DOI] [PubMed] [Google Scholar]
- 43.Pries AR, Reglin B, Secomb TW. Remodeling of blood vessels: responses of diameter and wall thickness to hemodynamic and metabolic stimuli. Hypertension. 2005;46:726–731. doi: 10.1161/01.HYP.0000184428.16429.be. [DOI] [PubMed] [Google Scholar]
- 44.Pries AR, Secomb TW. Structural adaptation of microvascular networks and development of hypertension. Microcirculation. 2002;9:305–314. doi: 10.1038/sj.mn.7800144. [DOI] [PubMed] [Google Scholar]
- 45.Pries AR, Secomb TW, Gaehtgens P. Design principles of vascular beds. Circ Res. 1995;77:1017–1023. doi: 10.1161/01.res.77.5.1017. [DOI] [PubMed] [Google Scholar]
- 46.Pries AR, Secomb TW, Gaehtgens P. Structural adaptation and stability of microvascular networks: theory and simulations. Am J Physiol. 1998;275:H349–H360. doi: 10.1152/ajpheart.1998.275.2.H349. [DOI] [PubMed] [Google Scholar]
- 47.Pries AR, Secomb TW, Gaehtgens P. Structural autoregulation of terminal vascular beds: vascular adaptation and development of hypertension. Hypertension. 1999;33:153–161. doi: 10.1161/01.hyp.33.1.153. [DOI] [PubMed] [Google Scholar]
- 48.Pries AR, Secomb TW, Gaehtgens P, Gross JF. Blood flow in microvascular networks - experiments and simulation. Circ Res. 1990;67:826–834. doi: 10.1161/01.res.67.4.826. [DOI] [PubMed] [Google Scholar]
- 49.Pries AR, Secomb TW, Gessner T, Sperandio MB, Gross JF, Gaehtgens P. Resistance to blood flow in microvessels in vivo. Circ Res. 1994;75:904–915. doi: 10.1161/01.res.75.5.904. [DOI] [PubMed] [Google Scholar]
- 50.Rivers RJ. Integration of conducted vasodilation from a single arteriole into a vascular network response. Am J Physiol. 1996 doi: 10.1152/ajpheart.1997.273.1.H310. [DOI] [PubMed] [Google Scholar]
- 51.Rodbard S. Vascular caliber. Cardiology. 1975;60:4–49. doi: 10.1159/000169701. [DOI] [PubMed] [Google Scholar]
- 52.Rozier MD, Zata VJ, Ellsworth ML. Lactate interferes with ATP release from red blood cells. Am J Physiol Heart Circ Physiol. 2007;292:H3038–H3042. doi: 10.1152/ajpheart.01238.2006. [DOI] [PubMed] [Google Scholar]
- 53.Secomb TW. Microcirculation. 2008 doi: 10.1080/10739680802350112. This issue. [DOI] [PMC free article] [PubMed] [Google Scholar]
- 54.Secomb TW, Hsu R, Park EY, Dewhirst MW. Green's function methods for analysis of oxygen delivery to tissue by microvascular networks. Ann Biomed Eng. 2004;32:1519–1529. doi: 10.1114/b:abme.0000049036.08817.44. [DOI] [PubMed] [Google Scholar]
- 55.Secomb TW, Pries AR. Basic Principles of Hemodynamics. In: Baskurt OK, hardeman MW, Rampling MW, Meiselman HJ, editors. Handbook of Hemorheology and Hemodynamics. IOS Press; Amsterdam: 2007. [Google Scholar]
- 56.Secomb TW, Pries AR. Information transfer in microvascular networks. Microcirculation. 2002;9:377–387. doi: 10.1038/sj.mn.7800146. [DOI] [PubMed] [Google Scholar]
- 57.Segal SS, Duling BR. Flow control among microvessels coordinated by intercellular conduction. Science. 1986;234:868–870. doi: 10.1126/science.3775368. [DOI] [PubMed] [Google Scholar]
- 58.Sherman TF. On connecting large vessels to small. The meaning of Murray's law. J Gen Physiol. 1981;78:431–453. doi: 10.1085/jgp.78.4.431. [DOI] [PMC free article] [PubMed] [Google Scholar]
- 59.Thoma R. Untersuchung über die Histogenese und Histomechanik des Gefäβsystems. Enke; Stuttgart: 1893. [Google Scholar]
- 60.Werko L. Vascular adaptation to long-term blood pressure reduction. Acta Med Scand. 1980;207:207. [PubMed] [Google Scholar]
- 61.Zakrzewicz A, Secomb TW, Pries AR. Angioadaptation: keeping the vascular system in shape. News Physiol Sci. 2002;17:197–201. doi: 10.1152/nips.01395.2001. [DOI] [PubMed] [Google Scholar]
- 62.Zhou Y, Kassab GS, Molloi S. On the design of the coronary arterial tree: a generalization of Murray's law. Phys Med Biol. 1999;44:2929–2945. doi: 10.1088/0031-9155/44/12/306. [DOI] [PubMed] [Google Scholar]