Abstract
Purpose
Auto-propagation of anatomical region-of-interests (ROIs) from the planning CT to daily CT is an essential step in image-guided adaptive radiotherapy. The goal of this study was to quantitatively evaluate the performance of the algorithm in typical clinical applications.
Method and Materials
We previously adopted an image intensity-based deformable registration algorithm to find the correspondence between two images. In this study, the ROIs delineated on the planning CT image were mapped onto daily CT or four-dimentional (4D) CT images using the same transformation. Post-processing methods, such as boundary smoothing and modification, were used to enhance the robustness of the algorithm. Auto-propagated contours for eight head-and-neck patients with a total of 100 repeat CTs, one prostate patient with 24 repeat CTs, and nine lung cancer patients with a total of 90 4D-CT images were evaluated against physician-drawn contours and physician-modified deformed contours using the volume-overlap-index (VOI) and mean absolute surface-to-surface distance (ASSD).
Results
The deformed contours were reasonably well matched with daily anatomy on repeat CT images. The VOI and mean ASSD were 83% and 1.3 mm when compared to the independently drawn contours. A better agreement (greater than 97% and less than 0.4 mm) was achieved if the physician was only asked to correct the deformed contours. The algorithm was robust in the presence of random noise in the image.
Conclusion
The deformable algorithm may be an effective method to propagate the planning ROIs to subsequent CT images of changed anatomy, although a final review by physicians is highly recommended.
Keywords: Auto-contouring, Deformable image registration, Adaptive radiotherapy, IGRT, Auto-segmentation
INTRODUCTION
Precise tumor targeting and normal tissue sparing are important clinical goals of modern radiation therapy. Recent advances in three-dimensional (3D) conformal radiotherapy and intensity-modulated radiotherapy (IMRT) provide a prospect to approach these goals (1, 2). A large planning target margin that accounts for setup uncertainties and internal organ motion has been reduced by the use of image-guidance (2–5) and motion management techniques (6, 7). However, daily internal anatomy variations including tumor shrinkage and shape deformation may still be significant and result in suboptimal treatment for some patients, especially when highly conformal treatment techniques, such as IMRT or proton therapy, are used (8–10).
With recent advances in in-room CT imaging technology (2, 11, 12), one effective way of reducing target margin and improve treatment outcome is to apply image-guided adaptive treatment strategy (13, 14) or four-dimensional (4D) radiotherapy to manage respiration-induced organ or target motion (15). Rapid plan adaptation methods have been proposed to improve tumor dose coverage and spare normal tissue based on the changes of projected daily anatomy (16, 17). The benefits of plan re-optimization based on 3D information of daily CT images are still under investigation since the online re-optimization procedure is subject to the speed of the planning process (17, 18) as well as the availability of daily contours of the treatment target and critical structures.
Auto-propagation of anatomical regions-of-interest (ROIs) from the original planning CT image to the repeat CT image is an important step for adaptive treatment planning because it is not practical for radiation oncologists to delineate all necessary ROIs for the same patient repeatedly. Daily contouring may be necessary for tracking anatomical changes and evaluating daily treatments(10). Investigation into automatic and semi-automatic contouring strategies attracts more attentions recently in the field of radiotherapy (19, 20). However, the speed and reliability of auto-contouring methods are still challenges for routine clinical implementations.
We previously implemented and validated a fast deformable image registration algorithm to map daily CT images with a reference CT image (21, 22). The purpose of the research reported in this paper was to apply this algorithm for a number of clinical cases and evaluate the performance of the algorithm against physician’s judgment. The algorithm is evaluated both qualitatively and quantitatively for its ability to auto-segment contours, and for its robustness in the presence of image noise and its application at several anatomical sites.
METHODS AND MATERIALS
Deformable image registration and contour transformation
A voxel-to-voxel 3D displacement map is usually obtained from the deformable image registration when transforming a source image to match a target image. Since the ROIs are normally represented as ordered points on CT slices, the displacement map can also be used to transform the ROIs from source image to the target image. For contour transformation purpose, we define the planning CT images as source images, and the subsequent daily CT images as target images.
Two methods can be used to transform ROIs: a point-based method and a volume-based method. In the point-based method, the ordered points of each original contour are transformed. A transformed contour surface may not stay in a single plane because of the 3D nature of the deformable transformation. Further interpolation is necessary to reorganize the new contour points on slices of the daily CT image. The new structure represented by these new contour points then must be re-sampled on each CT slice to form a set of new contours. Conversely, in the volume-based method, the entire volume of a structure is transformed and a deformed volume in the same coordinate of the daily CT image can be generated. Extraction of the boundaries of the new volume is required.
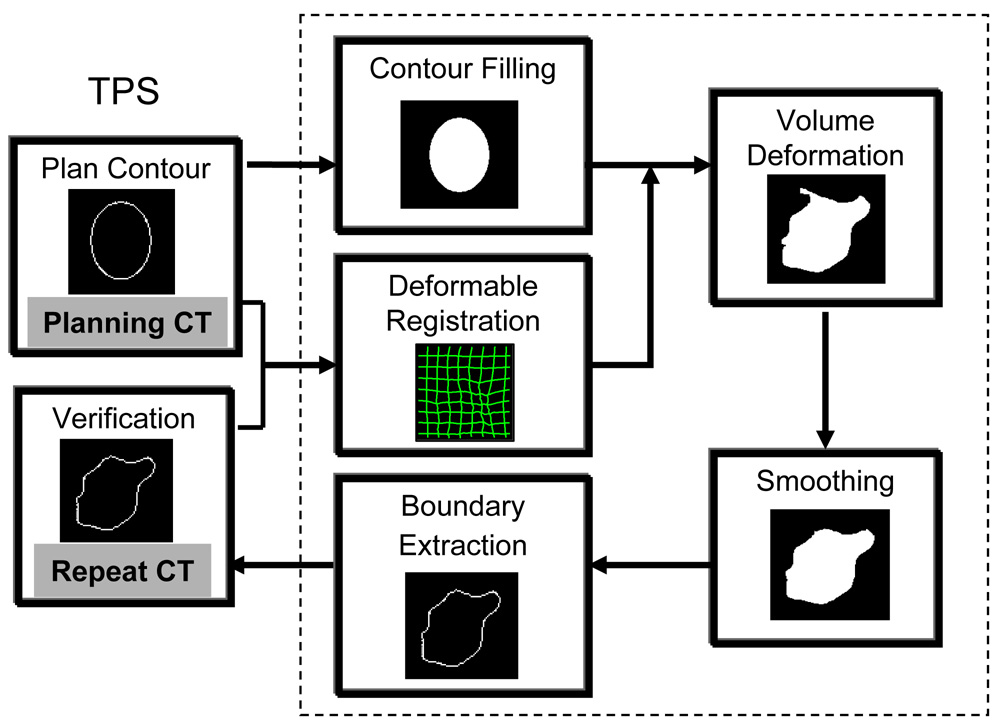
We chose to use the volume deformation method to avoid the re-sampling of new contour surfaces. Fig.1 is a flow chart describing the auto-contouring process we used. The original contours were drawn using a commercial treatment planning software (Pinnacle, Philips Medical System, Andover, MA). For each structure contoured, the consecutive boundary points on each CT slice are connected to create contiguous contours. The inner volume enclosed by these slice-by-slice contours is then marked by a binary value of “1”, which represents a 3D volume of the structure. This 3D volume is then transformed to a daily CT image using the one-to-one displacement vector (or the mapping transformation) from the deformable image registration.
Fig. 1.
A diagram demonstrating the auto-contouring process on repeat CT (or 4D CT images) using a deformable image registration method. A grayscale deformable image registration will be performed between the planning CT and the repeat CT images. The original planning ROI will be filled to a binary volume, which will be transformed using the displacement vector from the deformable registration. Then the deformed volume will be smoothed and shape-regulated. The last step is to extract the boundary of the deformed volume for each structure at the CT slice location of the repeat CT image.
The deformed volumes are smoothed and post-processed to remove unrealistic holes and islands (see below). The boundaries are extracted and re-sampled at each CT slice location of the daily CT image to obtain the deformed (or the auto-propagated) ROIs.
Contour smoothing and modification
The intensity-based deformable registration algorithm may induce abrupt or irregular boundaries in this auto-mapping procedure. This is usually caused by the handling of deformable image registration algorithm in the presence of low contrast CT images, which may not sufficiently define the spatial transformation. Multiple solutions (degeneracy) may exist due to insufficient grayscale information in the regions of CT images with low contrast contents. Image noise, lack of shape information, and poorly defined original contours on the source images can also contribute to the formation of irregularities. Normally, these cannot be fully compensated by regularization or smoothing of the displacement map during deformable image registration (22, 23). In addition, because of the 3D nature of the deformable image registration, small islands and holes can appear when the deformed volume is re-sampled onto the two-dimentional (2D) CT slices. Smoothing and shape processing of the deformed contours are useful.
We used morphological operators “opening” and “closing” (24) on the deformed contours to smooth irregular or abrupt surfaces as well as to remove or merge some small islands separated from a nearby larger volume.
Evaluation of automated contours
Robustness test
A pair of head-and-neck CT images from the same patient was used to test the robustness of the auto-contouring algorithm against image noise. The reference CT was acquired on a helical CT scanner (Philips Medical System, Shelton, CT), the repeat CT was acquired 3 weeks later using an CT-on-rails scanner (EXaCT, Varian Oncology Systems, Palo Alto, CA). Different imaging quality from different CT scanners can be observed. Then, different levels of white (Gaussian) noise and pepper-and-salt noises were artificially added to the repeat CT image. The auto-contouring procedure was repeated between the reference CT image and the repeat CT image at different noise levels. The deformed contours then were compared to those obtained without the added noise.
Volume overlap index (VOI)
A VOI metric is designed to quantitatively evaluate two sets of contours (25). The VOI was defined as
where Vd is the deformed volume, and Vs the reference volume of the same structure. The reference volume Vs can be obtained from either manually physician-drawn contours or physician-modified deformed contours. A VOI value of 0% indicated no spatial overlap, and a value of 100% indicated perfect agreement between the two contoured volumes.
Mean absolute surface-to-surface distance (ASSD) of two volumes
The ASSD is defined for a point on one surface as the shortest absolute Euclidean distance to the other surface. The mean ASSD was calculated to compare the deformed contours to the reference contours.
Head-and-neck cases
Eight head-and-neck cancer patients who received 3 CT scans per week using CT-on-rails were evaluated for automatic propagated contours from the planning CT image. Each of these 8 patients received 11 to 14 daily CT scans; and a total of 100 CTs were evaluated. For each patient, the deformed contours were compared to both physician independently drawn contours and physician-modified deformed contours. VOI were calculated for the high risk CTV (Clinical Target Volume) and both parotids.
Thoracic cases
Nine lung cancer patients underwent 4 dimensional computed tomography (4D CT) scanning during simulation. The images were scanned on a PET/CT scanner (Discovery ST; GE Medical Systems, Waukesha, WI). The 4D CT images were divided into 10 equal time phases within a complete respiratory cycle, named CT0, CT1, …, CT9. The contours were drawn on the end expiration phase (CT5). Using the automatic contour propagation algorithm described in this work, contours were automatically mapped from CT5 to nine other phases. The VOIs for the contoured structures (i.e., lung, gross tumor volume [GTV], heart and esophagus) were calculated for each of these patients.
Prostate case
One prostate cancer patient underwent 25 CT scans, including one simulation CT scan done with the Philip CT scanner and 24 daily CT scans done with the CT-on-rails. The planning contours for the prostate, rectum, bladder, seminal vesicles, and femoral heads were manually drawn on the simulation CT image. These contours were propagated to the daily CT images using the auto-contouring algorithm.
The CT image resolutions was 0.068 × 0.068 × 0.3 cm3 for head-and-neck cases, 0.098 × 0.098 × 0.25 cm3 for lung cases, and 0.098 × 0.098 × 0.3 cm3 for the prostate case.
RESULTS
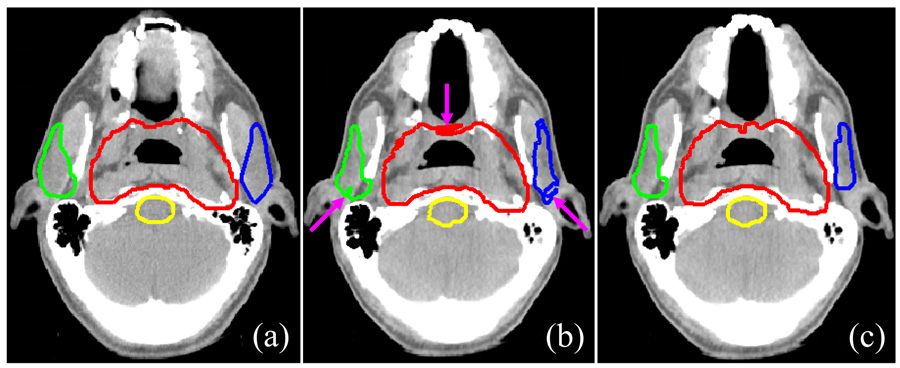
Fig. 2 shows an example of the smoothing and modification of deformed contours. The deformed contours that had not undergone modification and smoothing (Fig.2b) were irregular relative to the original contours on the planning CT image (Fig. 2a). After being smoothed and modified, however, the deformed contours were more visually acceptable (Fig.2c). In particular, the small islands that had separated from the large contour were removed.
Fig. 2.
Smoothing and modification of deformed contours. (a) Reference contours on the planning CT image; (b) deformed contours on the daily CT image without smoothing and modification; (c) smoothed contours on the daily CT image modified to correct for holes and islands. Red: planning tumor volume (PTV); green: right parotid; blue: left parotid; yellow: brainstem.
Robustness test
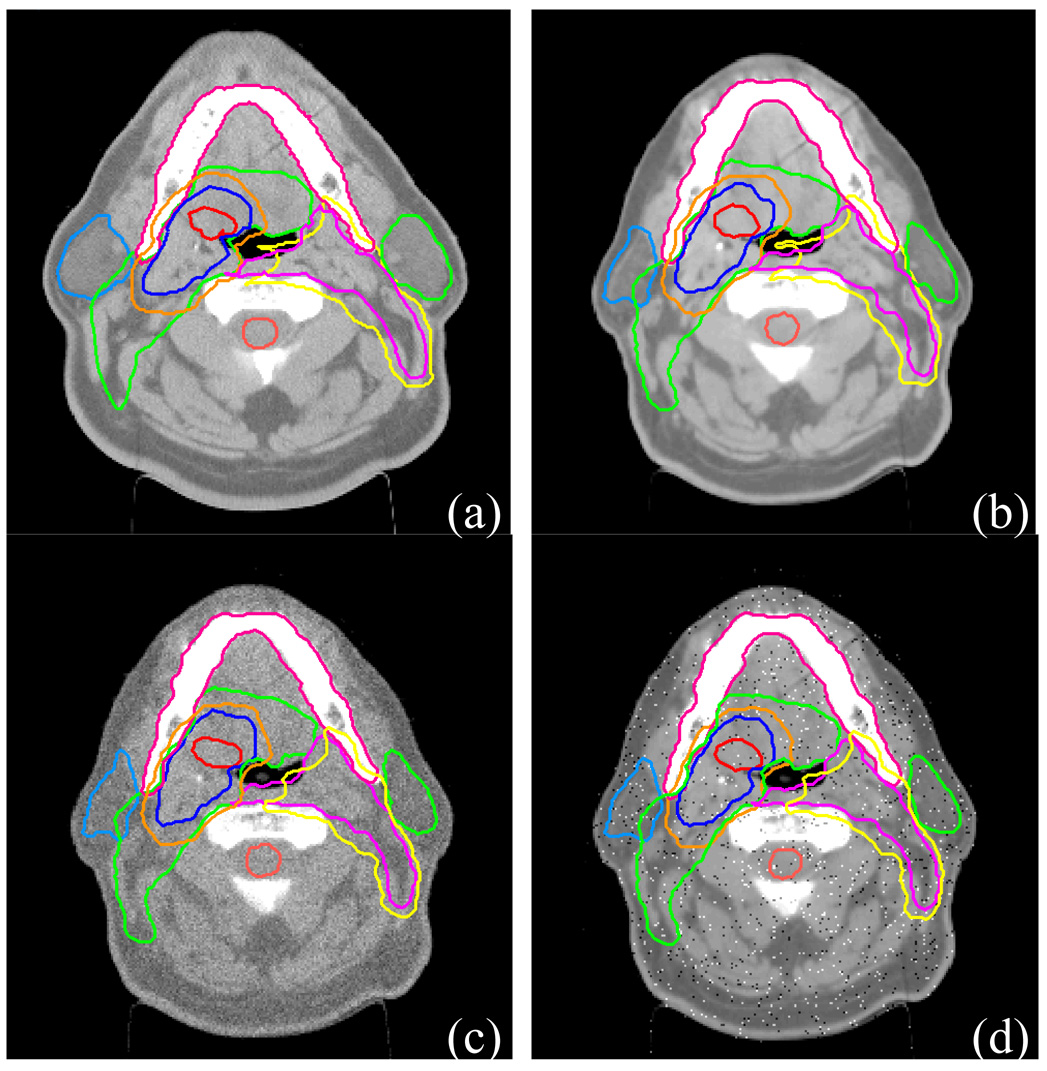
Fig.3c and 3d show the results for the degraded repeat CT image with additive Gaussian noise and pepper-and-salt noise, respectively. The auto-contouring process was not affected by either type of noise, although the noises are relatively strong.
Fig. 3.
Robustness of auto-contouring algorithm to image noise. (a) Simulation CT image with physician-drawn reference contours; (b) a repeat CT image with contours transformed by deformable image registration; (c) the repeat CT image in (b) with Gaussian noise added. The noisy repeat CT image was re-registered with simulation CT image and the reference contours were re-transformed; (d) the repeat CT image in (b) with pepper-and-salt noise added. The noisy repeat CT image was re-registered with simulation CT image and the reference contours were re-transformed.
Contour evaluation
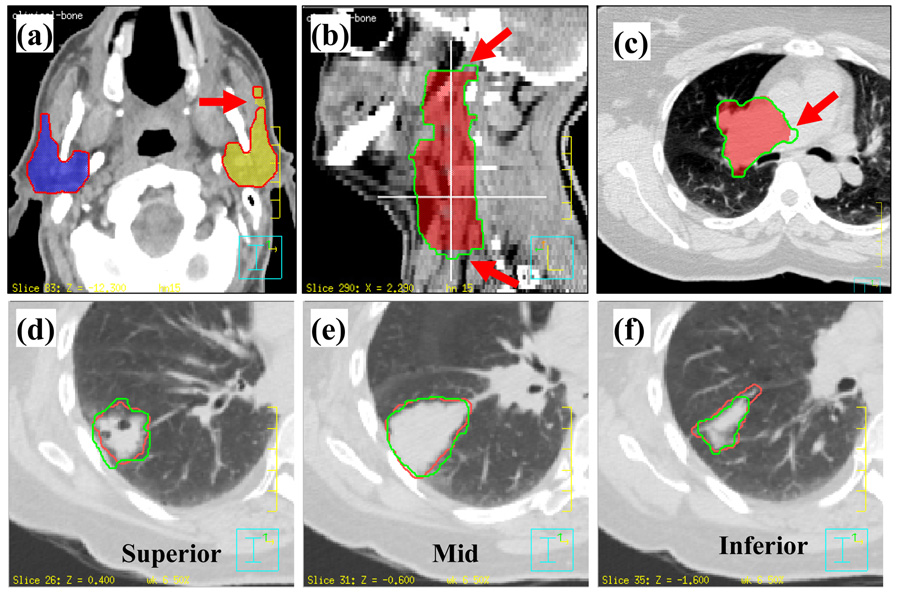
The general experience of radiation oncologists showed that the majority of deformed contours matched new anatomy reasonably well. Fig. 4 shows examples of contours drawn or modified by radiation oncologists to compare with the auto-propagated contours. Most of differences were seen at the most superior or inferior ends of a structure. This was partly due to the poor spatial resolution of the CT slice thickness (range, 2.5 to 3 mm). Fig.4a shows a small island that had separated from the left parotid. Fig. 4b shows that two ending slices were removed by a radiation oncologist. Fig.4c shows the tumor boundary in the low contrast soft tissue region can be different from physician’s judgment. Figure 4d–f show images from a lung cancer case in which the deformed contours were propagated to another phase from the end of expiration phase of the 4D CT image set. As shown, these deformed contours agree well with the physician-drawn contours in general. Again, the largest disagreement was observed near the two ends of the structure.
Fig. 4.
Examples of differences between the automatically propagated contours and physician-drawn contours. (a) Deformed contour is separated from the left parotid; (b) the two ends disagree with physician’s contours; (c) contours did not deform in the low contrast region; (d) and (f) manually drawn contours did not agree at the two ends of a structure; (e) manually drawn contours agreed at the middle of a structure. (a),(b),(c) Colorwash: physician’s manually drawn contours; contour: deformed contours. (d),(e),(f) Red: manual contours; green: deformed contours.
Head-and-neck cases
Table 1 shows the mean VOI for each of the 8 head-and-neck cancer patients. Comparing to the physician-drawn contours from scratch without referencing the deformed contours, the mean VOI for each patient ranged from 72.8% to 86.5% (average: 83.0%) for left and right parotids. Comparing to the physician-modified deformed contours, the mean VOI for each patient ranged from 98.5% to 100% (average: 99.4%) for the parotids, and ranged from 94.1% to 98.6% (average: 97.3%) for the CTVs. The high VOI value indicates that the auto-propagated contours matched the physician’s judgment very well. Higher VOIs were observed when the evaluation was based on the physician-modified deformed contours than on the physician independently drawn contours (p<0.001, Wilcoxon’s test). Apparently, both sets of contours (independently drawn from scratch or corrected from the deformed contours) were accepted by physicians. Table 2 shows the mean ASSD for these patients. The mean ASSD for each patient ranged from 0.8 mm to 2.0 mm (average: 1.3 mm) for parotids when comparing to the physician-drawn contours. When comparing to physician-modified contours, the mean ASSD ranged from 0.0 mm to 0.2 mm (average: 0.1 mm) for parotids and ranged from 0.1 mm to 0.8 mm (average: 0.4 mm) for all CTVs.
Table 1.
Volume overlap index (VOI) ± one standard deviation (%) for head-and-neck cases
| Contours from Scratch (%) | Modified Contours (%) | ||||
|---|---|---|---|---|---|
| Patient number | L Parotid | R Parotid | L Parotid | R Parotid | CTV |
| 1 | 86.4 ± 1.1 | 83.9 ±2.1 | 100.0 ± 0.0 | 100.0 ± 0.0 | 97.8 ± 0.9 |
| 2 | 84.3 ± 2.3 | 84.1 ± 2.6 | 100.0 ± 0.0 | 100.0 ± 0.0 | 97.7 ± 1.8 |
| 3 | 85.8 ± 2.7 | 84.8 ± 1.9 | 100.0 ± 0.0 | 100.0 ± 0.1 | 96.5 ± 1.8 |
| 4 | 83.3 ± 2.1 | 86.5 ± 2.1 | 100.0 ± 0.1 | 99.5 ± 0.4 | 94.1 ± 2.2 |
| 5 | 82.8 ± 3.3 | 83.5 ± 2.7 | 98.6 ± 3.2 | 99.2 ± 1.4 | 98.2 ± 1.7 |
| 6 | 81.4 ± 2.6 | 83.0 ± 1.2 | 99.0 ± 1.4 | 97.9 ± 1.9 | 96.8 ± 1.9 |
| 7 | 76.7 ± 4.2 | 72.8 ± 9.7 | 99.6 ± 0.3 | 99.0 ± 0.7 | 98.6 ± 0.7 |
| 8 | 84.2 ± 2.4 | 83.9 ± 2.4 | 99.2 ± 0.6 | 98.5 ± 0.6 | 98.5 ± 0.9 |
| Average | 83.1 ± 3.2 | 82.8 ± 3.1 | 99.4 ± 0.7 | 98.7 ± 0.6 | 97.1 ± 1.5 |
Abbreviations L = left; R = right; CTV = clinical target volume
Table 2.
Absolute Euclidean surface-to-surface distance ± one standard deviation (mm) for head-and-neck cases
| Contours from Scratch (mm) |
Modified Contours (mm) |
||||
|---|---|---|---|---|---|
| Patient number | L Parotid | R Parotid | L Parotid | R Parotid | CTV |
| 1 | 0.8 ± 0.2 | 1.0 ± 0.1 | 0.0 ± 0.0 | 0.0 ± 0.0 | 0.3 ± 0.2 |
| 2 | 1.2 ± 0.2 | 1.1 ± 0.2 | 0.0 ± 0.0 | 0.0 ± 0.0 | 0.4 ± 0.2 |
| 3 | 1.4 ± 0.5 | 1.7 ± 0.2 | 0.0 ± 0.0 | 0.0 ± 0.0 | 0.4 ± 0.2 |
| 4 | 1.5 ± 0.2 | 1.0 ± 0.2 | 0.0 ± 0.0 | 0.0 ± 0.0 | 0.6 ± 0.2 |
| 5 | 1.2 ± 0.3 | 1.3 ± 0.4 | 0.1 ± 0.1 | 0.0 ± 0.1 | 0.1 ± 0.1 |
| 6 | 1.3 ± 0.3 | 0.9 ± 0.1 | 0.1 ± 0.1 | 0.2 ± 0.1 | 0.8 ± 0.5 |
| 7 | 2.0 ± 0.6 | 2.0 ± 1.3 | 0.0 ± 0.0 | 0.1 ± 0.1 | 0.1 ± 0.1 |
| 8 | 1.3 ± 0.2 | 1.3 ± 0.4 | 0.1 ± 0.1 | 0.2 ± 0.1 | 0.3 ± 0.1 |
| Average | 1.3 ± 0.3 | 1.3 ± 0.4 | 0.0 ± 0.0 | 0.1 ± 0.1 | 0.4 ± 0.2 |
Abbreviations L = left; R = right; CTV = clinical target volume
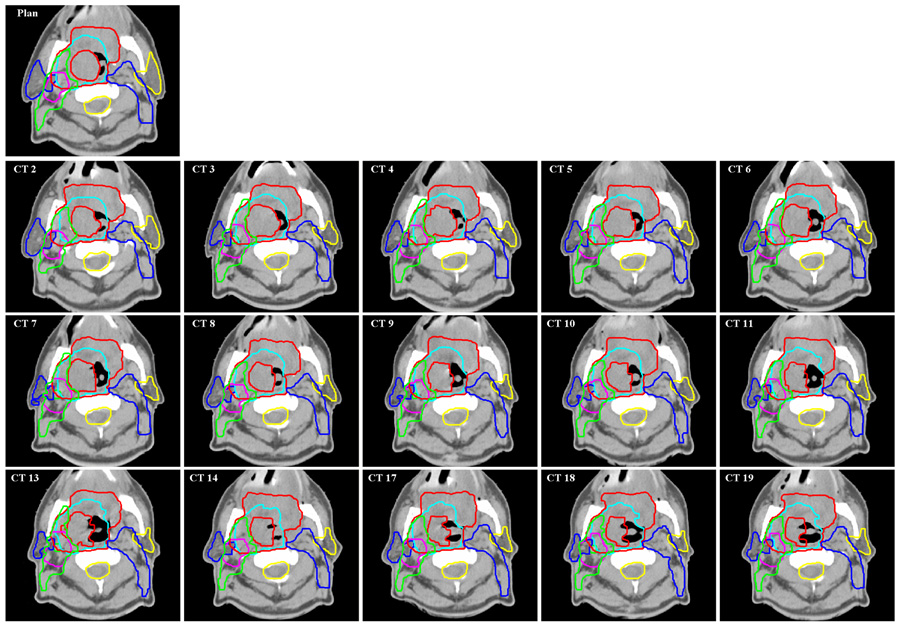
We found that most unmodified head & neck contours were quite acceptable. Fig.5 shows an example of the contour auto-propagation results for one of the head-and-neck cancer patients. The image labeled “Plan” is the reference CT image showing the most important planning ROIs, including the primary targets (the primary GTV and lymph node GTV), parotids, CTVs of three different risk levels, and the spinal cord. The other images show the corresponding slices for all the available repeat CT images with auto-propagated ROIs overlaid on them. The missed numbers represent skipped CT scans (CT scans were not acquired due to various reasons in the treatment schedule). Because of setup uncertainties and out-of-plane rotations, these CT slices may not be exactly at the same transverse plane as in the “Plan” CT slice.
Fig. 5.
Contours obtained for a head-and-neck patient. Original contours were drawn on the “Plan” CT image. They were transformed automatically by the auto-contouring algorithm to repeat CT images “CT 2”, “CT 3”,…, “CT 19”.
Thoracic cases
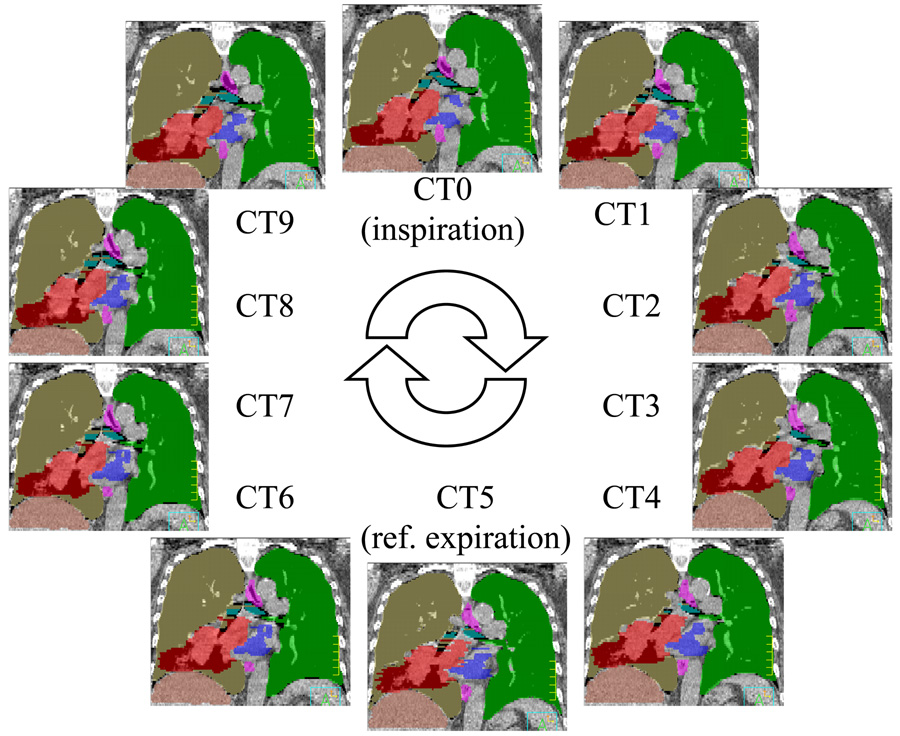
Table 3 shows the mean VOI for the 9 lung cancer patients. The reference volumes were obtained from the physician-modified deformed contours. The mean VOIs for these patients ranged from 98.2% to 99.7% (average: 99.3%) for the lung volume, from 96.1% to 99.3% (average: 98.3%) for the GTV, from 96.3% to 99.2% (average: 98.1%) for the heart, and from 96.1% to 99.1% (average: 98.1%) for the esophagus. Fig.6 shows an example of all anatomical structures (ROIs) represented in color-filled volumes. The original ROIs, which were drawn on CT5, were completely mapped to the rest of the phases automatically.
Table 3.
Volume overlap index (VOI) ± one standard deviation (%) for lung cancer cases.
| Patient number | Lung | GTV | Heart | Esophagus |
|---|---|---|---|---|
| 1 | 99.5 ± 2.7 | 96.1 ± 2.9 | 98.4 ± 0.5 | 98.7 ± 0.9 |
| 2 | 99.6 ± 2.5 | 98.9 ± 0.9 | 98.6 ± 0.4 | 99.1 ± 0.7 |
| 3 | 99.2 ± 0.2 | 99.3 ± 0.1 | 96.3 ± 3.2 | 96.4 ± 2.9 |
| 4 | 99.3 ± 0.2 | 97.1 ± 1.5 | 98.2 ± 0.7 | 98.4 ± 1.1 |
| 5 | 99.0 ± 0.2 | 99.1 ± 0.7 | 97.6 ± 0.7 | 97.5 ± 1.9 |
| 6 | 98.2 ± 0.4 | 96.4 ± 1.9 | 98.4 ± 0.4 | 96.0 ± 1.1 |
| 7 | 99.5 ± 0.1 | 99.3 ± 0.5 | 99.2 ± 0.6 | 99.1 ± 0.9 |
| 8 | 99.2 ± 0.5 | 98.5 ± 0.9 | 97.2 ± 1.4 | 98.8 ± 1.3 |
| 9 | 99.7 ± 0.0 | 98.4 ± 0.4 | 99.1 ± 0.2 | 98.3 ± 1.2 |
| Average | 99.3 ± 0.7 | 98.3 ± 1.1 | 98.1 ± 0.9 | 98.1 ± 1.3 |
Abbreviations GTV = gross tumor volume.
Fig. 6.
4D CT images for a lung case. A breathing cycle was divided into 10 equal-time phases. The reference contours were drawn on phase CT5, which is estimated to be the end expiration phase. The contours were then transformed to the rest phases using auto-contouring algorithm.
Prostate case
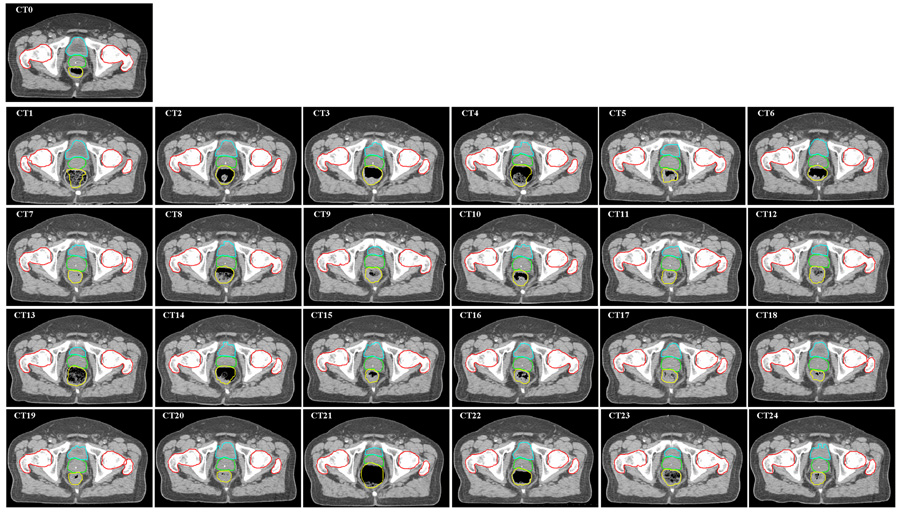
In Fig.7, the image labeled “CT0” shows an axial slice of the simulation CT image with physician-drawn contours for bladder, prostate, rectum, and femoral heads. The following images, CT1-CT24, show the corresponding slices for all repeat CT images overlaid with auto-propagated contours. These contours, although unmodified by physician, they matched well with the daily CT images. Most of the deformed rectums were acceptable, with the exceptions of CT1, CT4, CT13, and CT21, in which the contents inside the rectum were changed significantly.
Fig. 7.
Auto-propagation of contours for a prostate case. Original contours were drawn on simulation CT image (“CT0”). They were mapped automatically by the auto-contouring algorithm to daily CT images CT1-CT24. The deformed contours were overlaid on each CT image.
Speed of contour-propagation
The computational complexity of the deformable registration normally depends on the size of the image matrix to be registered. The computational time used in the auto-contour propagation depends on the number of the ROIs and their volumes. The typical time used for head-and-neck and prostate cases was 2 min per case, including 1 min for deformable image registration and 1 min for contour mapping and post-processing (which included the export of individual contours for up to 10 structures). The average time for the thoracic cases was approximately 3 min per pair of images undergoing registration. A slightly longer time was required for lung cancer cases because of the large volumes involved (1 min for deformable registration and 2 min for contour propagation). Overall, it took 27 min to map all contours from the CT5 phase to the rest of the phases automatically.
DISCUSSION
Although many image segmentation techniques have been investigated (26–28) and some convenient 2D contouring tools exist in some radiation treatment planning systems, organ or target delineation is still a time-consuming task. However, if a set of reference contours already exists for a patient, it is not surprising that an automatic contour-propagation method can be developed to aid in the contouring process on repeat CT images. To this end, we have designed a reliable automatic contour-propagation method based on our deformable image registration method. For practical reasons, auto-contouring of patient’s anatomy on repeat CT images is essential for image-guided adaptive radiotherapy.
In our implementation, we chose to use the volume deformation method, which is similar to that described by Zhang et al. (20). This method can avoid the need to handle ordered control points or re-sample surfaces using sparse points. It can also reduce the effect of imaging noise and artifacts or irregular distribution of control points. Alternatively, meshing or re-meshing of contours was described by Lu et al. (29) and Shekhar et al. (23).
Our auto-contouring algorithm on head-and-neck cases showed results similar to those reported by Zhang and colleagues, who compared their auto-segmentation method to physician-drawn reference ROIs in 32 daily CT images from 7 head-and-neck patients (20). They reported that the VOIs were approximately 80% for most ROIs; and the distances between the manually and automatically delineated ROI surfaces were mostly within 3 mm with a mean of 1 mm and standard deviation of <2 mm for most ROIs. Our study in 100 repeat CT images from 8 head-and-neck patients showed a mean VOI of 83% and a mean ASSD of 1.3 mm with a standard deviation of 0.4 mm when compared our deformed contours to physician-drawn contours from scratch.
Realizing that inter- and intra-observer variations in contouring may have led to uncertainties in the data, we asked radiation oncologists to directly modify the deformed contours to generate another set of comparisons. These modified contours reflect the accepted status of the deformed contours, similar to the process whereby a senior attending physician corrects contouring done by a resident in-training. Not surprisingly, because there was no inter-observer variation, these modified contours agree with the auto-segmented contours much better than the contours independently drawn from scratch (Table 1 and 2).
Our observations also indicate that the quality of the manual contours on the original CT image affects the results. Ideally, for the deformable registration to track changes in shape, contours should be drawn to follow exactly the edge of an organ or tumor that undergoes the largest change in image intensity. However, this is not practical because of the complex nature of human anatomy, the quality of the CT image, or the physician’s contouring skills. Inter-observer (30–32) and intra-observer (33, 34) variations have been reported by many investigators. These imperfect original contours can be propagated faithfully to daily CT images by the deformable registration algorithm, which introduce additional disagreement between automatically deformed contours and physician’s judgments.
Although deformable model based automated delineation may work well on images with higher contrast, such as thoracic CT images (35, 36) and MR images (37, 38), zigzag or irregular-shaped contours may still exist at low-contrast regions because of image noise and artifacts. Thus, contour smoothing and manual editing may still be necessary.
Imaging or motion artifacts are also a challenge for deformable image registration. For one thoracic patient, the tumor and surrounding tissues had distorted shapes and volumes for the mid-inspiration and the mid-expiration phases due to irregular breathing during 4DCT acquisition. Dental artifacts can also cause unexpected contour distortions, but fortunately, dental artifacts only affect a few axial slices. Our smoothing parameters built in the algorithm (22) effectively reduced large deviations from the original shape. The overall impact is still small.
In our experiments, we felt that images for prostate cancer patients were more difficult to deform correctly than those for head-and-neck and lung cancer patient, mostly because of the low soft tissue contrast at the boundaries of prostate, bladder and rectum. In addition, differences in rectal filling on different days may cause correspondence ambiguity. Strategies to solve this problem were proposed (39, 40). Studies on shape model may be also useful (19, 41).
Mapping planning contours to daily CT image would facilitate adaptive re-planning. If the contours are available on daily CT images, dose-volume histograms can be calculated to evaluate the necessity of replanning, or the contours can be used directly for IMRT optimization. In addition, the daily dose distribution can be transformed back to the planning CT using the same deformable image registration method to compare with the original plan and to estimate the cumulative doses delivered to the patient (9, 42).
Our current algorithm takes 1–2 min to complete the contour propagation process, which may be satisfactory for online adaptive replanning. Additional computational techniques, such as parallel processing, would further reduce the computing time. Recently, parallel computing using a graphics processing unit (GPU) was implemented for deformable image registration (43). A factor of 70 speedups was achieved by Sharp and his colleagues (43) using a data parallel design when compared to the CPU-based implementation. We believe new technologies such as these may soon be applicable in real-time contour propagation for clinical adaptive radiotherapy.
CONCLUSION
We have developed an efficient contour propagation method based on a deformable image registration technique. The current method uses the original contours defined on the planning CT as reference structures. We have demonstrated that the deformable image registration method can produce high-quality contours on subsequent CT images during the course of external beam radiotherapy or 4D-CT images of the same patient. It is important to note that these auto-deformed contours still need physician’s review or corrections if necessary. Incorrect original contours, image artifacts, or low contrast objects in the CT images can affect the quality of the computer-generated contours. Nevertheless, tracking patient’s anatomy with an automated, computer-assisted method is becoming necessary for practical applications of image-guided adaptive radiotherapy to further improve the dose conformity and dose optimality in these highly conformal radiation treatment strategies.
ACKNOWLEDGMENTS
This research was supported, in part, by a sponsored research grant from Varian Medical Systems, a seed grant from The University of Texas Center for Biomedical Engineering, and grant CA74043 from the National Cancer Institute. We would like to thank Lionel Santibañez and Kathryn B. Carnes from the Department of Scientific Publications for their editorial assistance.
Footnotes
Publisher's Disclaimer: This is a PDF file of an unedited manuscript that has been accepted for publication. As a service to our customers we are providing this early version of the manuscript. The manuscript will undergo copyediting, typesetting, and review of the resulting proof before it is published in its final citable form. Please note that during the production process errors may be discovered which could affect the content, and all legal disclaimers that apply to the journal pertain.
Conflict of Interest
The authors have no conflicts of interest with any parties involved in the conduct of this study.
REFERENCES
- 1.Ezzell GA, Galvin JM, Low D, et al. Guidance document on delivery, treatment planning, and clinical implementation of IMRT: Report of the IMRT subcommittee of the AAPM radiation therapy committee. Med. Phys. 2003;30:2089–2115. doi: 10.1118/1.1591194. [DOI] [PubMed] [Google Scholar]
- 2.Mackie TR, Kapatoes J, Ruchala K, et al. Image guidance for precise conformal radiotherapy. Int J Radiat Oncol Biol Phys. 2003;56:89–105. doi: 10.1016/s0360-3016(03)00090-7. [DOI] [PubMed] [Google Scholar]
- 3.Court LE, Dong L. Automatic registration of the prostate for computed-tomography-guided radiotherapy. Med. Phys. 2003;30:2750–2757. doi: 10.1118/1.1608497. [DOI] [PubMed] [Google Scholar]
- 4.Zeidan OA, Langen KM, Meeks SL, et al. Evaluation of image-guidance protocols in the treatment of head and neck cancers. Int J Radiat Oncol Biol Phys. 2007;67:670–677. doi: 10.1016/j.ijrobp.2006.09.040. [DOI] [PubMed] [Google Scholar]
- 5.Purdie TG, Bissonnette J-P, Franks K, et al. Cone-Beam Computed Tomography for On-Line Image Guidance of Lung Stereotactic Radiotherapy: Localization, Verification, and Intrafraction Tumor Position. Int J Radiat Oncol Biol Phys. 2007;68:243–252. doi: 10.1016/j.ijrobp.2006.12.022. [DOI] [PubMed] [Google Scholar]
- 6.Wang Z, Willett CG, Yin F-F. Reduction of Organ Motion by Combined Cardiac Gating and Respiratory Gating. Int J Radiat Oncol Biol Phys. 2007;68:259–266. doi: 10.1016/j.ijrobp.2006.11.057. [DOI] [PubMed] [Google Scholar]
- 7.Underberg RWM, Lagerwaard FJ, Slotman BJ, et al. Benefit of respiration-gated stereotactic radiotherapy for stage I lung cancer: An analysis of 4DCT datasets. Int J Radiat Oncol Biol Phys. 2005;62:554–560. doi: 10.1016/j.ijrobp.2005.01.032. [DOI] [PubMed] [Google Scholar]
- 8.Yan D, Xu B, Lockman D, et al. The influence of interpatient and intrapatient rectum variation on external beam treatment of prostate cancer. Int J Radiat Oncol Biol Phys. 2001;51:1111–1119. doi: 10.1016/s0360-3016(01)02599-8. [DOI] [PubMed] [Google Scholar]
- 9.Schaly B, Kempe JA, Bauman GS, et al. Tracking the dose distribution in radiation therapy by accounting for variable anatomy. Phys. Med. Biol. 2004:791–805. doi: 10.1088/0031-9155/49/5/010. [DOI] [PubMed] [Google Scholar]
- 10.Barker J, Jerry L, Garden AS, Ang KK, et al. Quantification of volumetric and geometric changes occurring during fractionated radiotherapy for head-and-neck cancer using an integrated CT/linear accelerator system. Int J Radiat Oncol Biol Phys. 2004;59:960–970. doi: 10.1016/j.ijrobp.2003.12.024. [DOI] [PubMed] [Google Scholar]
- 11.Jaffray DA, Siewerdsen JH, Wong JW, et al. Flat-panel cone-beam computed tomography for image-guided radiation therapy. Int J Radiat Oncol Biol Phys. 2002;53:1337–1349. doi: 10.1016/s0360-3016(02)02884-5. [DOI] [PubMed] [Google Scholar]
- 12.Court L, Rosen I, Mohan R, et al. Evaluation of mechanical precision and alignment uncertainties for an integrated CT/LINAC system. Med. Phys. 2003;30:1198–1210. doi: 10.1118/1.1573792. [DOI] [PubMed] [Google Scholar]
- 13.Yan D, Lockman D, Martinez A, et al. Computed Tomography Guided Management of Interfractional Patient Variation. Semin Radiat Oncol. 2005;15:168–179. doi: 10.1016/j.semradonc.2005.01.007. [DOI] [PubMed] [Google Scholar]
- 14.Brabbins D, Martinez A, Yan D, et al. A dose-escalation trial with the adaptive radiotherapy process as a delivery system in localized prostate cancer: Analysis of chronic toxicity. Int J Radiat Oncol Biol Phys. 2005;61:400–408. doi: 10.1016/j.ijrobp.2004.06.001. [DOI] [PubMed] [Google Scholar]
- 15.Keall P. 4-dimensional computed tomography imaging and treatment planning. Semin Radiat Oncol. 2004;14:81–90. doi: 10.1053/j.semradonc.2003.10.006. [DOI] [PubMed] [Google Scholar]
- 16.Court LE, Dong L, Lee AK, et al. An automatic CT-guided adaptive radiation therapy technique by online modification of multileaf collimator leaf positions for prostate cancer. Int J Radiat Oncol Biol Phys. 2005;62:154–163. doi: 10.1016/j.ijrobp.2004.09.045. [DOI] [PubMed] [Google Scholar]
- 17.Mohan R, Zhang X, Wang H, et al. Use of deformed intensity distributions for on-line modification of image-guided IMRT to account for interfractional anatomic changes. Int J Radiat Oncol Biol Phys. 2005;61:1258–1266. doi: 10.1016/j.ijrobp.2004.11.033. [DOI] [PubMed] [Google Scholar]
- 18.Wu Q, Djajaputra D, Lauterbach M, et al. A fast dose calculation method based on table lookup for IMRT optimization. Phys. Med. Biol. 2003:N159–N166. doi: 10.1088/0031-9155/48/12/401. [DOI] [PubMed] [Google Scholar]
- 19.Pekar V, McNutt TR, Kaus MR. Automated model-based organ delineation for radiotherapy planning in prostatic region. Int J Radiat Oncol Biol Phys. 2004;60:973–980. doi: 10.1016/j.ijrobp.2004.06.004. [DOI] [PubMed] [Google Scholar]
- 20.Zhang T, Chi Y, Meldolesi E, et al. Automatic Delineation of On-Line Head-And-Neck Computed Tomography Images: Toward On-Line Adaptive Radiotherapy. Int J Radiat Oncol Biol Phys. 2007;68:522–530. doi: 10.1016/j.ijrobp.2007.01.038. [DOI] [PubMed] [Google Scholar]
- 21.Wang H, Dong L, Lii MF, et al. Implementation and validation of a three-dimensional deformable registration algorithm for targeted prostate cancer radiotherapy. Int J Radiat Oncol Biol Phys. 2005;61:725–735. doi: 10.1016/j.ijrobp.2004.07.677. [DOI] [PubMed] [Google Scholar]
- 22.Wang H, Dong L, O'Daniel J, et al. Validation of an accelerated 'demons' algorithm for deformable image registration in radiation therapy. Phys. Med. Biol. 2005;50:2887–2905. doi: 10.1088/0031-9155/50/12/011. [DOI] [PubMed] [Google Scholar]
- 23.Shekhar R, Lei P, Castro-Pareja C, et al. Automatic segmentation of phase-correlated CT scans through nonrigid image registration using geometrically regularized free-form deformation. Med. Phys. 2007;34:3054–3066. doi: 10.1118/1.2740467. [DOI] [PubMed] [Google Scholar]
- 24.Gonzalez RC, Woods RE. Digital Image Processing. Addison-Wesley Publishing Company; 1993. [Google Scholar]
- 25.Goldberg-Zimring D, Talos I-F, Bhagwat JG, et al. Statistical validation of brain tumor shape approximation via spherical harmonics for image-guided neurosurgery. Acad. Radiol. 2005;12:459–466. doi: 10.1016/j.acra.2004.11.032. [DOI] [PMC free article] [PubMed] [Google Scholar]
- 26.Neumann A, Lorenz C. Statistical shape model based segmentation of medical images. Comput Med Imag Graph. 1998;22:133–143. doi: 10.1016/s0895-6111(98)00015-9. [DOI] [PubMed] [Google Scholar]
- 27.Shen D, Zhan Y, Davatzikos C. Segmentation of prostate boundaries from ultrasound images using statistical shape model. IEEE Trans Med Imag. 2003;22:539–551. doi: 10.1109/TMI.2003.809057. [DOI] [PubMed] [Google Scholar]
- 28.Rao M, Stough J, Chi Y-Y, et al. Comparison of human and automatic segmentations of kidneys from CT images. Int J Radiat Oncol Biol Phys. 2005;61:954–960. doi: 10.1016/j.ijrobp.2004.11.014. [DOI] [PubMed] [Google Scholar]
- 29.Lu W, Olivera GH, Chen Q, et al. Automatic re-contouring in 4D radiotherapy. Phys. Med. Biol. 2006;51:1077–1099. doi: 10.1088/0031-9155/51/5/002. [DOI] [PubMed] [Google Scholar]
- 30.Geets X, Daisne J-F, Arcangeli S, et al. Inter-observer variability in the delineation of pharyngo-laryngeal tumor, parotid glands and cervical spinal cord: Comparison between CT-scan and MRI. Radiother Oncol. 2005;77:25–31. doi: 10.1016/j.radonc.2005.04.010. [DOI] [PubMed] [Google Scholar]
- 31.Struikmans H, Warlam-Rodenhuis C, Stam T, et al. Interobserver variability of clinical target volume delineation of glandular breast tissue and of boost volume in tangential breast irradiation. Radiother Oncol. 2005;76:293–299. doi: 10.1016/j.radonc.2005.03.029. [DOI] [PubMed] [Google Scholar]
- 32.Rasch C, Barillot I, Remeijer P, et al. Definition of the prostate in CT and MRI: a multi-observer study. Int J Radiat Oncol Biol Phys. 1999;43:57–66. doi: 10.1016/s0360-3016(98)00351-4. [DOI] [PubMed] [Google Scholar]
- 33.Court LE, Dong L, Taylor N, et al. Evaluation of a contour-alignment technique for CT-guided prostate radiotherapy: an intra- and interobserver study. Int J Radiat Oncol Biol Phys. 2004;59:412–418. doi: 10.1016/j.ijrobp.2003.10.023. [DOI] [PubMed] [Google Scholar]
- 34.Breen SL, Publicover J, De Silva S, et al. Intraobserver and Interobserver Variability in GTV Delineation on FDG-PET-CT Images of Head and Neck Cancers. Int J Radiat Oncol Biol Phys. 2007;68:763–770. doi: 10.1016/j.ijrobp.2006.12.039. [DOI] [PubMed] [Google Scholar]
- 35.Zhang T, Orton NP, Tome WA. On the automated definition of mobile target volumes from 4D-CT images for stereotactic body radiotherapy. Med. Phys. 2005;32:3493–3502. doi: 10.1118/1.2106448. [DOI] [PubMed] [Google Scholar]
- 36.Rietzel E, Chen GTY, Choi NC, et al. Four-dimensional image-based treatment planning: Target volume segmentation and dose calculation in the presence of respiratory motion. Int J Radiat Oncol Biol Phys. 2005;61:1535–1550. doi: 10.1016/j.ijrobp.2004.11.037. [DOI] [PubMed] [Google Scholar]
- 37.Brock KK, Sharpe MB, Dawson LA, et al. Accuracy of finite element model-based multi-organ deformable image registration. Med. Phys. 2005;32:1647–1659. doi: 10.1118/1.1915012. [DOI] [PubMed] [Google Scholar]
- 38.Pekar V, McNutt TR, Kaus MR. Automated model-based organ delineation for radiotherapy planning in prostatic region. Int J Radiat Oncol Biol Phys. 2004;60:973–980. doi: 10.1016/j.ijrobp.2004.06.004. [DOI] [PubMed] [Google Scholar]
- 39.Davis B, Prigent D, Bechtel J, et al. Accommodating Bowel Gas in Large Deformation Image Registration for Adaptive Radiation Therapy of the Prostate. Med. Phys. 2004;31:1780–1780. [Google Scholar]
- 40.Gao S, Zhang L, Wang H, et al. A deformable image registration method to handle distended rectums in prostate cancer radiotherapy. Med. Phys. 2006;33:3304–3312. doi: 10.1118/1.2222077. [DOI] [PubMed] [Google Scholar]
- 41.Hoogeman MS, van Herk M, Yan D, et al. A model to simulate day-to-day variations in rectum shape. Int J Radiat Oncol Biol Phys. 2002;54:615–625. doi: 10.1016/s0360-3016(02)02946-2. [DOI] [PubMed] [Google Scholar]
- 42.Yan D, Jaffray DA, Wong JW. A model to accumulate fractionated dose in a deforming organ. Int J Radiat Oncol Biol Phys. 1999;44:665–675. doi: 10.1016/s0360-3016(99)00007-3. [DOI] [PubMed] [Google Scholar]
- 43.Sharp GC, Kandasamy N, Singh H, et al. GPU-based streaming architectures for fast cone-beam CT image reconstruction and demons deformable registration. Phys. Med. Biol. 2007;52:5771–5787. doi: 10.1088/0031-9155/52/19/003. [DOI] [PubMed] [Google Scholar]


