Abstract
CONSPECTUS
Understanding the spatial dynamics of biochemical networks is both fundamentally important for understanding life at the systems level and also has practical implications for medicine, engineering, biology, and chemistry. Studies at the level of individual reactions provide essential information about the function, interactions, and localization of individual molecular species and reactions in a network. However, analyzing the spatial dynamics of complex biochemical networks at this level is difficult. Biochemical networks are non-equilibrium systems containing dozens to hundreds of reactions with nonlinear and time-dependent interactions, and these interactions are influenced by diffusion, flow, and the relative values of state-dependent kinetic parameters.
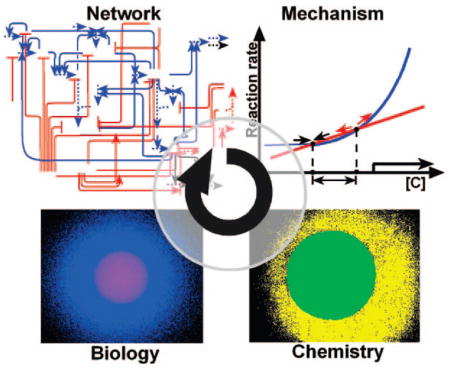
To achieve an overall understanding of the spatial dynamics of a network and the global mechanisms that drive its function, networks must be analyzed as a whole, where all of the components and influential parameters of a network are simultaneously considered. Here, we describe chemical concepts and microfluidic tools developed for network-level investigations of the spatial dynamics of these networks. Modular approaches can be used to simplify these networks by separating them into modules, and simple experimental or computational models can be created by replacing each module with a single reaction. Microfluidics can be used to implement these models as well as to analyze and perturb the complex network itself with spatial control on the micrometer scale.
We also describe the application of these network-level approaches to elucidate the mechanisms governing the spatial dynamics of two networks–hemostasis (blood clotting) and early patterning of the Drosophila embryo. To investigate the dynamics of the complex network of hemostasis, we simplified the network by using a modular mechanism and created a chemical model based on this mechanism by using microfluidics. Then, we used the mechanism and the model to predict the dynamics of initiation and propagation of blood clotting and tested these predictions with human blood plasma by using microfluidics. We discovered that both initiation and propagation of clotting are regulated by a threshold response to the concentration of activators of clotting, and that clotting is sensitive to the spatial localization of stimuli. To understand the dynamics of patterning of the Drosophila embryo, we used microfluidics to perturb the environment around a developing embryo and observe the effects of this perturbation on the expression of Hunchback, a protein whose localization is essential to proper development. We found that the mechanism that is responsible for Hunchback positioning is asymmetric, time-dependent, and more complex than previously proposed by studies of individual reactions.
Overall, these approaches provide strategies for simplifying, modeling, and probing complex networks without sacrificing the functionality of the network. Such network-level strategies may be most useful for understanding systems with nonlinear interactions where spatial dynamics is essential for function. In addition, microfluidics provides an opportunity to investigate the mechanisms responsible for robust functioning of complex networks. By creating nonideal, stressful, and perturbed environments, microfluidic experiments could reveal the function of pathways thought to be nonessential under ideal conditions.
Introduction
This Account describes chemical concepts and microfluidic tools developed for network-level investigations of the spatial dynamics of complex networks and illustrates the application of these concepts and tools to understanding hemostasis (blood clotting)4–6 and development of the Drosophila embryo.7 Complex reaction networks perform functions indispensable for the existence of living organisms, such as self-regulation and amplification.1,2 Understanding the spatial dynamics of biological networks is essential for understanding life at the systems level. A major interdisciplinary research effort approaches understanding these dynamics from two complementary directions that can be loosely described as studies at the level of individual reactions and studies at the network level. Studies at the level of individual reactions aim to identify and characterize individual molecular species as well as define their functions in a network, uncover their interaction with other molecules, and determine their spatial localization relative to other molecules and reactions. Chemistry has enabled studies at the level of individual reactions by providing the conceptual framework within which molecular interactions are analyzed and by providing both synthetic and analytical tools.3 For example, the identification and characterization of the Bicoid protein led to the discovery that the binding of Bicoid to hunchback regulates the establishment of the anterior body plan of the developing Drosophila embryo,8 shedding light on a portion of the spatial dynamics of embryogenesis. While characterization of individual reactions may provide an essential description of many aspects of a network, these approaches are not sufficient to understand some dynamic properties of the network.
The network of hemostasis serves as a case in point. The individual reactions of the hemostasis network have been analyzed in extensive detail (Figure 1). The molecular players and most of their interactions have been established and characterized,9 and the rate constants of many of these reactions have been measured. These investigations have led to diagnostic tools and therapies for controlling blood clotting. However, questions about the dynamics of the network persist, such as “what limits the size of the clot formed? That is, why do clots not continue to expand until all of the blood is involved?”10 Is it true that “only the more severe of the many small vascular injuries that are regularly sustained will initiate an enzyme cascade”?11 Also, can blood be exposed to active tissue factor, a stimulus of clotting, without initiation of clotting?12
FIGURE 1.
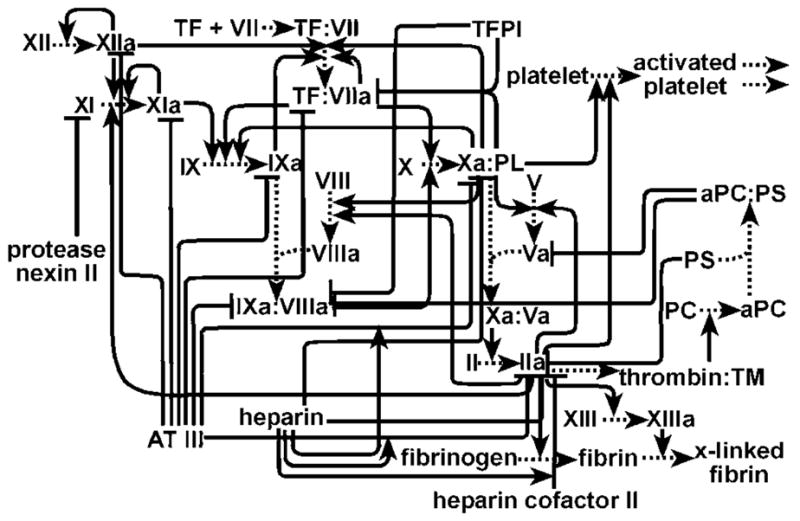
A network diagram of the complex reaction network of hemostasis. Only a portion of the molecular players and the connections between them are shown. Lines ending with an arrow indicate activating interactions, and lines ending with a bar indicate inhibitory interactions.
Furthermore, analyzing the spatial dynamics of complex biochemical networks at the level of individual reactions is difficult. Biochemical networks are nonequilibrium systems and may contain dozens to hundreds of reactions with nonlinear and time-dependent interactions, and the effects of diffusion and flow on these interactions are too complex to consider simultaneously. In addition, the overall dynamics can be sensitive to the relative values of kinetic parameters, which can depend on the state of the network.13 Computational modeling of all of these individual reactions in detail would be difficult even with unlimited computational power, because some of the components or interactions may be unknown or incorrectly understood due to experimental error or because they were measured out of context of the whole network. Therefore, to supplement studies of individual reactions, network-level approaches are needed to understand the spatial dynamics of complex networks. This need presents an opportunity, especially for chemistry, to develop new concepts and tools.
Network-level approaches attempt to achieve an overall understanding of a network and the global mechanisms that drive its function by analyzing and probing a network as a whole instead of breaking it down into its constituent parts. By doing so, network-level approaches can shed light on phenomena that cannot be described by considering the individual components of a network alone. For instance, network-level experiments revealed how ventricle fibrillation during sudden cardiac death is triggered and controlled by patterns of action potentials that propagate in a wave-like fashion.14 In another example, transfer of cytoplasm from one end of a developing Drosophila embryo to the other demonstrated that components from a specific location are sufficient to generate the entire head or tail structure.15
There are two difficulties, however, in using network-level approaches to understand spatial dynamics of networks. The first is simplification–how do we treat the network as a whole but simplify it in a meaningful way? How do we predict its dynamics even without knowing all of the components? The second is experimental control–how do we recreate and control the nonuniform spatial environments to model, observe, and probe dynamics of these networks? Chemical concepts and microfluidics are emerging as powerful methods to overcome these difficulties.
Modular Approaches to Simplify and Model Whole Complex Networks
Modular approaches can be used to simplify complex systems while still treating them as a whole. A module is a group of components that work together to perform a function. Such an approach is used in engineering and physics, and this approach has been used in chemistry to describe the staggering complexity of organic molecules. Physical organic chemists use modularization to elucidate and predict the mechanisms of organic reactions. In organic molecules, modules are functional groups–specific combinations of electrons and nuclei. Functional groups are further organized into classes, such as nucleophiles and electrophiles. General mechanisms are developed to describe the interactions of functional groups and to predict organic reactions. Modules and mechanisms devised for one set of molecules are applicable to other molecules and reactions.16 Modularization is also becoming a common theme in systems biology2,17–19 and has been proposed as an underlying cause of robustness and evolvability. In addition, simplified kinetic models have been used to understand many properties of networks, such as amplification in enzyme kinetics,20 oscillations during the cell cycle,13,21 feedback control and bistability in cell signaling,22 ventricle fibrillation in the heart muscle,14 and many other phenomena.13 We believe that organizing the components of a complex reaction network into modules is a valuable approach to simplifying and understanding mechanisms that govern these networks. The modular approach can also be used to build simplified theoretical and experimental models of complex networks.
“What I cannot create I do not understand”, said Richard Feynman. His dictum is also that of a chemist and underlies the logic of creating chemical models. For example, synthetic chemical models were developed to understand the function and mechanism of enzymes.23 They enabled the correct measurement of the dissociation energy of the cobalt–carbon bond in coenzyme B12 and helped understand the mechanism by which weakening of this bond takes place.24 Beyond the scope of individual molecules or enzymes, synthetic biologists have used synthetic models of complex networks to provide insights into the regulatory processes of protein19,25 and gene networks,26 including bistability leading to hysteresis,27 oscillations,28 and pattern formation in cell–cell communication.29 Nonlinear chemical systems are especially interesting, because they display spatial patterns,30 amplification,31 and oscillations.30,32 We used a nonlinear chemical system and microfluidics to construct a system that performed 5000-fold chemical amplification with a threshold response.31 Why make a simplified experimental model of a complex system? For many systems, one could argue that once a modular mechanism is proposed, it can be tested by computer simulations. Experimental models remain useful for two reasons. First, if a simple experimental model reproduces the function of the complex system, one gains confidence in the proposed modular mechanism because it is satisfied by at least one self-consistent set of realistic parameters. Second, experimental models could perform useful functions, such as catalysis performed by a model of an enzyme.
New tools are needed to construct models of complex reaction networks and to perturb and analyze the networks themselves. To do so, reactions must be initiated at the right place and the right time, and the whole system must be maintained away from equilibrium. We use microfluidics to accomplish these goals.
Microfluidics Provides Spatial Control for Experiments at the Network Level
Microfluidics provides wonderful opportunities for experimental analysis of the dynamics of complex networks. It provides precise spatial and temporal control over reactions, enabling experiments that were difficult or impossible to conduct otherwise and that have direct biological applications.33,34 Multiple laminar streams provide control of reactions and fluid–fluid interfaces and provide access to gradients in solution and on surfaces. These techniques have been applied to a number of questions in cell migration and signaling.35 Complex microfabricated environments are used to control cellular development,36 motility,37 and population dynamics.34,38 Micropatterned phospholipid bilayers39 and patterned self-assembled monolayers40 can be integrated with microfluidics to understand cell migration and attachment.41 These techniques have been combined to culture and even to engineer tissues.42
Modeling and Microfluidics To Understand the Spatial Dynamics of Hemostasis
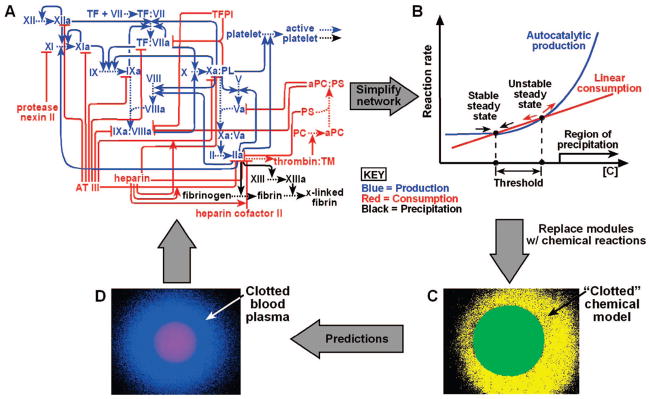
We combined these chemical approaches with microfluidics to investigate the dynamics of initiation and propagation in hemostasis. We focused on answering the questions posed in the Introduction.10–12 We approached this problem in four steps (Figure 2): (i) simplify the complexity of the network by using a modular mechanism (Figure 2A,B), (ii) experimentally test the modular mechanism with a chemical model of the hemostasis network by using microfluidics, (iii) use the modular mechanism and the chemical model to predict the dynamics of initiation and propagation of blood clotting (Figure 2C), and (iv) test the predictions with human whole blood and blood plasma by using microfluidics (Figure 2D).
FIGURE 2.
Chemical approaches and microfluidics were combined to understand the dynamics of initiation and propagation in hemostasis in four steps: (A) a network diagram of hemostasis with the reactions of each module shown in a corresponding color; (B) kinetic diagram (rate plot) of the three modules that were used to design the chemical model; (C) microphotograph showing “clotting” in the chemical model system, built with three chemical reactions used to represent the three modules; (D) microphotograph showing that clotting of human blood plasma displays the dynamics predicted by the modular mechanism and the chemical model. Panels A and B adapted in part with permission from ref 4. Copyright 2006 National Academy of Sciences, U.S.A. Panels C and D adapted in part with permission from ref 5. Copyright 2004 Wiley-VCH Verlag GmbH & Co. KGaA.
Simplifying the Complexity of Hemostasis by Using a Modular Mechanism
We hypothesized that threshold responses are responsible for control of spatial dynamics of initiation and propagation of blood clotting. To simplify the hemostasis network, its ~80 known reactions were separated into three modules (Figure 2A).5 Here, a module refers to a group of biochemical reactions within the network that work together to perform a function and have defined overall kinetics. Three modules were defined for the whole hemostasis network: production, consumption, and precipitation (Figure 2B). The production module produces an activator, C, of clotting with higher-order autocatalysis, while the consumption module linearly consumes C. Other kinetic schemes may be used, such as production with simple autocatalysis and consumption with Michaelis–Menten kinetics, as long as the production curve has higher upward curvature than the consumption curve. The precipitation module forms a clot at a high concentration of C, [C]. These modules were selected so that the competition between the production and consumption modules created three steady states in the system, leading to a threshold response to [C] (Figure 2B, only two steady states are shown). Together, these modules and their interactions provide a mechanistic description of the threshold responses in hemostasis.
The Chemical Model Implemented with Microfluidics Reproduces the Function of Hemostasis
A synthetic chemical model based on this modular mechanism was developed by replacing each module with a chemical reaction with the same overall kinetics. This chemical model consisted of three nonbiological reactions, where the activator, C, was acid, H3O+. The production and consumption modules were represented by a solution containing two competing chlorite–thiosulfate reactions, where one reaction autocatalytically produces H3O+ and the other linearly consumes H3O+.43 The precipitation module was represented by using sodium alginate, which will precipitate or “clot” at high concentrations of H3O+. This “clotting” was visualized by using a pH-sensitive dye. To determine whether the reaction mixture reproduced the overall dynamics of the network, we used microfluidics to test whether the reaction mixture would self-repair by localized “clotting”.5 “Damage” was introduced by puncturing the microfluidic device with a syringe needle (Figure 3B, green). In the absence of damage, the chemical reaction mixture did not “clot” (Figure 3A). When damage was introduced, the chemical reaction mixture initiated spontaneous “clot” formation with precipitation of alginic acid, and this “clot” remained localized to the damaged channel (Figure 3B, yellow).5
FIGURE 3.
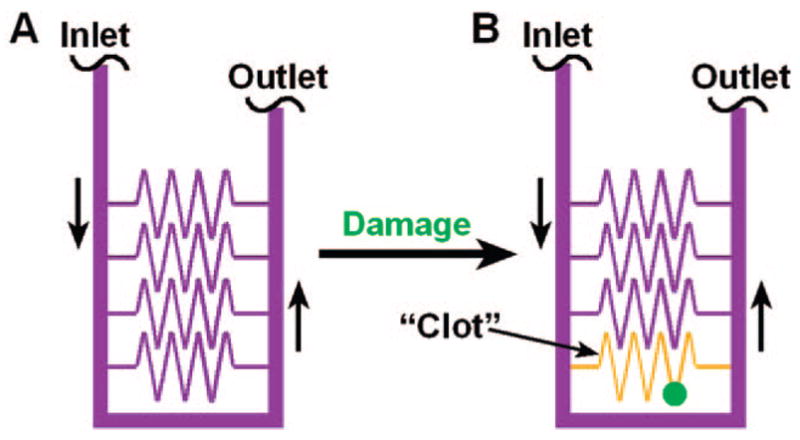
The chemical model reproduced a function of the complex network of hemostasis–self-repair by localized “clotting”:5 (A) Schematic drawing showing the geometry of the microfluidic device used to test the function of the chemical model. In the absence of damage (green), the chemical reaction mixture did not “clot”. (B) After damage was introduced by puncturing a channel, “clotting” (yellow) initiated and remained localized to the damaged channel. Black vertical arrows indicate the direction of flow. Adapted with permission from ref 5. Copyright 2004 Wiley-VCH Verlag GmbH & Co. KGaA.
The Modular Mechanism and the Chemical Model Predict the Spatial Dynamics of Hemostasis
Models are meaningful when they make nontrivial predictions. Two functions critical to a normal clotting response are ensuring that clotting initiates and remains localized to areas of substantial vessel damage. According to the modular mechanism, both initiation and propagation of clotting are regulated by a threshold response to [C]. This threshold response is manifested by the occurrence of clotting only when [C] exceeds a threshold concentration necessary to initiate clotting, [Cthresh]. This mechanism and the chemical model made two predictions.
Prediction 1: Initiation of Clotting Is Regulated by a Threshold Response to the Dimensions of the Clotting Stimulus on a Surface
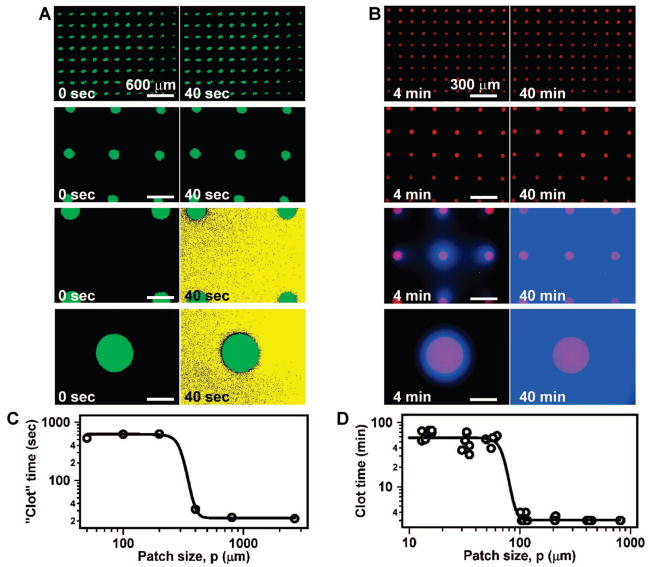
In the chemical model, initiation of “clotting” is regulated by a threshold response to [C] (Figure 4A). We predicted that “clotting” would also show a threshold response to the size of a patch of stimulus.4,44,45 Experimentally, “clotting” initiated on patches larger than a threshold size but not on patches smaller than a threshold size (Figure 4B). This threshold to patch size is regulated by the competition between reaction, which produces C, and diffusion, which removes C (Figure 4C). For a large patch, diffusion only removes C from the edge of the patch, allowing a high [C] to accumulate in the center. For a small patch, diffusion is able to remove C from the entire patch, preventing [C] from reaching the threshold.
FIGURE 4.
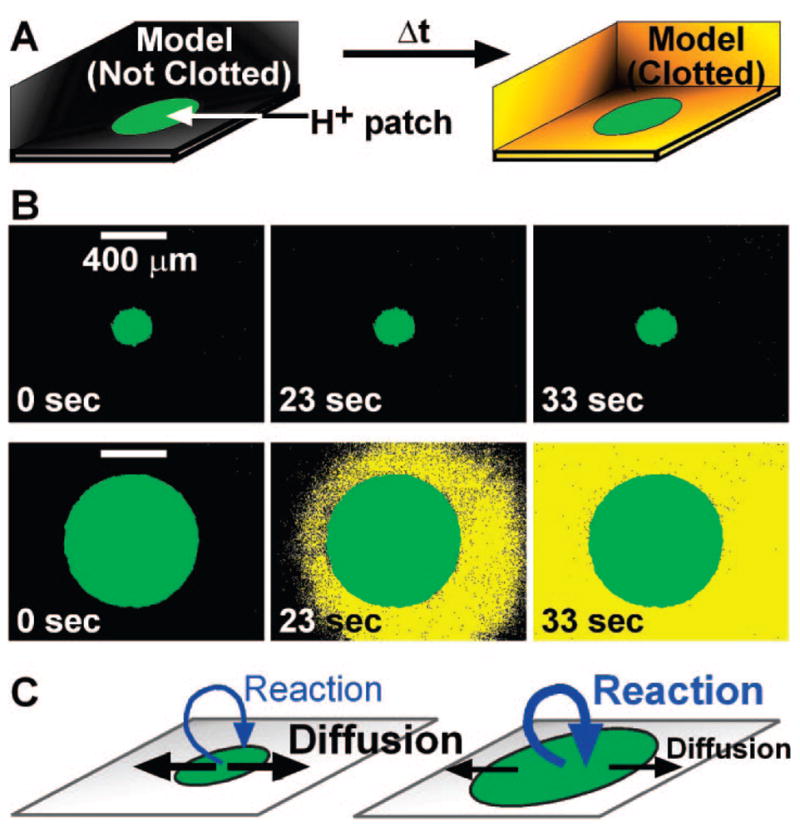
The chemical model predicted the existence of a threshold patch size necessary to initiate blood clotting: (A) When the chemical reaction mixture was exposed to large patches of stimulus (green) in a microfluidic chamber, initiation of “clotting” (yellow) occurred. Experimentally, the chemical reaction mixture described above was placed over surface patches that produced H3O+ when exposed to UV light. “Clotting” in the reaction mixture resulted from a switch from basic to acidic conditions, the precipitation of alginic acid, and increased fluorescence of a pH-sensitive dye. (B) Time-lapse fluorescent microphotographs show that the chemical reaction mixture does not “clot” on small patches, but does “clot” on large patches. (C) Schematic explanation of the effect shown in panel B. On a small patch, diffusion dominates, maintaining the [C] below [Cthresh]. On a large patch, diffusion is less effective, and reaction dominates, allowing [C] to exceed [Cthresh]. Adapted with permission from ref 4. Copyright 2006 National Academy of Sciences, U.S.A.
The size of an individual patch, not the total surface area of an array of patches, regulates the threshold response of initiation.4 When the chemical reaction mixture was exposed to arrays of patches of different sizes (Figure 5A), initiation occurred in a threshold-dependent manner. In these experiments, the threshold patch size was ~200 μm (Figure 5C). For the chemical reaction mixture, a simple scaling equation could be used to estimate the value of this threshold patch size from the “clot” time (reaction time) and the diffusion coefficient of C.45
FIGURE 5.
Initiation of clotting in the chemical model and in human blood plasma displayed a threshold response the size of a patch of stimulus: (A) Time-lapse fluorescent microphotographs show that initiation of “clotting” (yellow) of the chemical model depends on the size of an individual patch of stimulus (green) and not the total surface area of patches. Experiments with the chemical model were performed in the same fashion as shown in Figure 4. (B) Time-lapse fluorescent microphotographs show that initiation of clotting of human blood plasma (visualized by a blue thrombin-sensitive fluorescent dye) also depends on the size of an individual patch of stimulus (red) and not the total surface area of patches. (C, D) Quantification of the threshold patch size in the chemical model (C) and in human blood plasma (D). Reprinted with permission from ref 4 with minor modifications. Copyright 2006 National Academy of Sciences, U.S.A.
To test this prediction, human blood plasma was exposed to arrays of patterned supported lipid bilayers with patches of reconstituted tissue factor as the stimulus (Figure 5B).4 When clotting initiated, thrombin was produced, indicated by fluorescence of a blue thrombin-sensitive substrate. As predicted, initiation occurred in a threshold-dependent manner. In these experiments, the threshold patch size was ~50 μm (Figure 5D). The scaling relationship between reaction time and the threshold patch size was also obeyed for human blood plasma.45
Prediction 2: Propagation of Clotting Is Regulated by a Threshold Response to the Shear Rate at Vessel Junctions
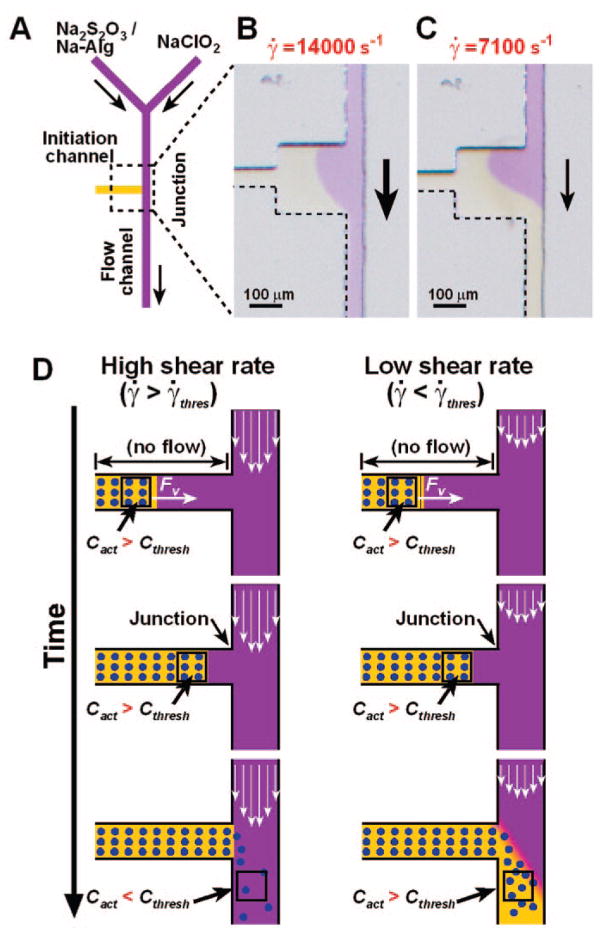
To show that propagation of “clotting” is regulated by a threshold response to [C], the leading edge of a propagating “clot” was exposed to different shear rates, γ̇[s−1].5 Shear rate describes the effectiveness of removal of C by the flow. A microfluidic device was designed to allow initiation of “clotting” in the initiation channel (horizontal) without causing “clotting” in the connecting flow channel (vertical, Figure 6). The “clot” propagated up to the junction of these two channels. Whether propagation continued through the junction depended on γ̇ in the flow channel (Figure 6B, C). The threshold dynamics of propagation is also explained by the competition between production and removal of C (Figure 6D). According to this mechanism, a clot will propagate as a reactive front if [C] remains above [Cthresh].
FIGURE 6.
The chemical model predicted that localization of a propagating “clot” to a damaged vessel is dependent on shear rate, γ̇: (A) Simplified schematic drawing of the microfluidic device used to test the dependence of “clot” (yellow) propagation through a junction on γ̇. Experimentally, “clotting” of the chemical reaction mixture was initiated in the initiation channel (horizontal) in the absence of flow, and propagation of the “clot” from the initiation channel into the flow channel (vertical) was monitored. (B) When γ̇ in the flow channel was above the threshold γ̇, “clot” propagation remained localized to the initiation channel. (C) When γ̇ in the flow channel was below the threshold γ̇, “clot” propagation did not remain localized to the initiation channel. In panels A–C, black arrows indicate the direction of flow. Adapted with permission from ref 5. Copyright 2004 Wiley-VCH Verlag GmbH & Co. KGaA. (D) Schematic drawing showing the proposed mechanism regulating “clot” propagation. Adapted with permission from ref 5. Copyright 2004 Wiley-VCH Verlag GmbH & Co. KGaA.
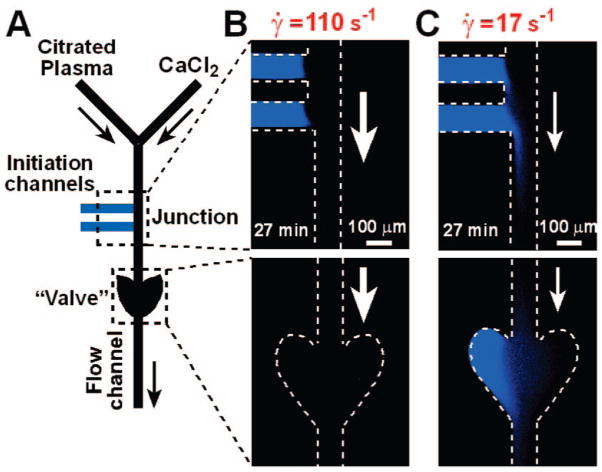
To test this prediction with human blood plasma, microfluidic channels coated with phospholipids were used.6 Clotting was initiated in the initiation channel without causing clotting in the flow channel (Figure 7A). Propagation46 through the junction stopped or continued depending on γ̇ in the flow channel (Figure 7B, C).
FIGURE 7.
Localization of clotting of human blood plasma is dependent on shear rate, γ̇: (A) Simplified schematic drawing of the microfluidic device used to test the dependence of clot (blue) propagation through a junction on γ̇. Experimentally, clotting of human blood plasma was initiated in the initiation channels in the absence of flow and propagated to the junction between the initiation channels and the flow channel. As human blood plasma was flowed through the flow channel at a specific γ̇, propagation of clotting was monitored in the flow channel at both the junction and the “valve”. (B) When the γ̇ in the flow channel was above the threshold γ̇, clotting remained localized to the initiation channels and did not propagate through the junction. (C) When γ̇ in the flow channel was below the threshold γ̇, the clot propagated through the junction, into the flow channel, and into the “valve”. Arrows indicate the direction of flow. Reprinted in part with permission from ref 6. Copyright 2007 American Chemical Society.
Overall, this approach provided mechanistic insights into the role of transport phenomena and threshold responses in the regulation of blood clotting. These insights may be useful for the development of therapies to control initiation and propagation of clotting beyond sights of vascular damage. In addition, the microfluidic devices developed in this approach could evolve into more sensitive and more predictive diagnostic tools.
Microfluidic Tools to Determine the Dynamics of Patterning of the Drosophila Embryo
We are currently using a similar approach to understand robustness of embryonic development. The embryo begins as an undifferentiated single cell, and in the process of development, it patterns itself into progressively finer features, ultimately leading to the complex body plan of the adult organism. This patterning is robust–it takes place reliably at different temperatures and for embryos of different sizes. For example, during early development of the Drosophila embryo, the protein Hunchback is expressed in one half of the embryo. In other words, the embryo “knows” the location of its middle and can find its middle regardless of temperature. Robustness of development, temperature compensation, and regulation of size are biological problems of intense interest. In addition, there is a fascinating chemical problem: what is the simplest chemical system that can “find its middle”? Would this system operate by a mechanism similar to the one used by embryos?
The development of the Drosophila embryo has been extensively studied, but we still do not know all of the molecular players and their roles in orchestrating development and making it robust.47 Prior to fertilization, maternal copies of bicoid mRNA are deposited into the embryo and are localized to the anterior pole.8,48 Upon fertilization, bicoid mRNA is translated into Bicoid protein, which forms a concentration gradient along the antero–posterior axis of the embryo.8 Binding assays have shown that Bicoid binds to the promoter region of the hunchback gene, activating transcription of hunchback mRNA and subsequent translation of Hunchback protein.8 Presumably due to activation by a threshold level of Bicoid, Hunchback is expressed only in the anterior half of the embryo. However, known molecular interactions do not explain how Hunchback is expressed in only one half of the body of the embryo at different environmental temperatures. It is possible that the patterning network is intrinsically temperature-compensated,49 although both the rate of development50 and Bicoid concentration gradient17 are affected by temperature.
The simplest mechanism for “finding the middle” relies on two opposing gradients emanating from the two poles of the embryo. The gradients could be of concentration or, more broadly speaking, of activity of molecules. One gradient is of activators, such as Bicoid, and the other gradient is of inhibitors, such as Oskar, Nanos, or Caudal. Hunchback is expressed only where the concentration of the activators is higher than the concentration of inhibitors. As long as the gradients cross in the middle of the embryo, and as long as they have the same temperature sensitivity, this mechanism provides robust expression of Hunchback in just one half of the embryo, regardless of temperature or the size of the embryo. This mechanism also predicts that Hunchback expression should shift if one side of the embryo is heated while the other side is cooled. To understand the dynamics of the network that maintains robust Hunchback position and to test the opposing gradient model in particular, network-level approaches are needed. To address this need, we developed a microfluidic platform to control and perturb the environment around a developing embryo.7,51
Using Microfluidics To Probe the Mechanism of Robust Hunchback Expression
We used dual-stream laminar flow to control independently the temperature of each half of a developing Drosophila embryo suspended in a microfluidic channel, creating a temperature step (T-step) across the embryo (Figure 8A, B). The flow and temperature profiles were characterized experimentally and by numerical simulations.51 Surprisingly, embryos exposed to a T-step developed normally.7 The position of the Hunchback boundary did not shift, rejecting the simplistic opposing gradient model (Figure 8C). However, when the orientation of the T-step was reversed between 65 and 100 min of development, Hunchback expression was more variable (Figure 8D), suggesting that there is a critical time point in robust Hunchback positioning.7 These results suggest that the mechanism that determines the Hunchback boundary is asymmetric, time-dependent, and more complex than two opposing gradients.
FIGURE 8.
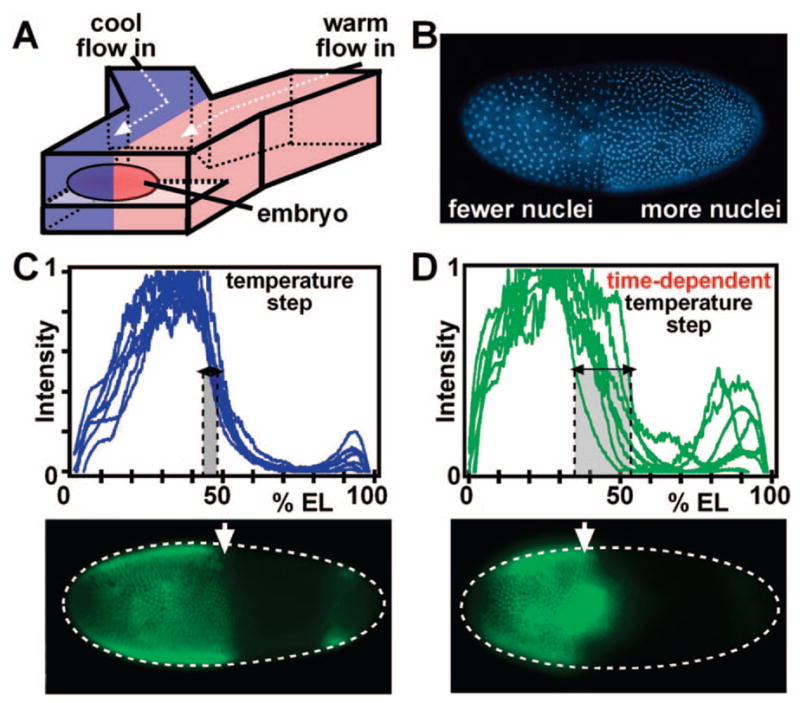
A microfluidic platform was developed to differentially control the temperature of each half of a developing Drosophila embryo in both space and time: (A) schematic drawing of the microfluidic device with an embryo exposed to two different temperatures; (B) in embryos exposed to the temperature step (T-step), the cool half developed more slowly than the warm half, illustrated by the difference in nuclear density; (C) the position of the Hunchback boundary, determined by immunostaining, is normal in embryos developed in a T-step; (D) a time-dependent T-step induced variation in the location of the boundary. EL stands for embryo length. Adapted with permission from ref 7. Copyright 2005 Nature Publishing Group.
To understand robustness of embryonic development fully, the molecular players and the correction mechanisms must be identified. Yet, this has proven difficult. Interestingly, “nonessential” molecular components and pathways are being discovered. They are active in early development, but removing them does not seem to affect development. There is a tantalizing possibility that these newly discovered components are involved in the compensation mechanisms responsible for robustness of development. Why are they nonessential? It may be difficult to identify compensation mechanisms when development takes place under ideal laboratory conditions with no perturbations for which to compensate. It is possible that these “nonessential” components are, in fact, responsible for robustness, but their function needs to be re-examined under perturbed and more stressful conditions. Microfluidics provides an opportunity to test this hypothesis by perturbing, in space and time, development of embryos with mutations in the “nonessential” pathways. These experiments would represent the convergence of both reaction and network level analysis.
Conclusions
Understanding spatial dynamics of complex reaction networks is an exciting challenge for chemistry. The approach described here relies on separating these networks into modules and creating simple experimental or computational models by replacing each module by a single reaction. Then, microfluidics is used to build experimental models and to probe and control the complex network itself. This approach is likely to be most useful for systems with nonlinear interactions and where spatial dynamics is essential for function. Interactions in the immune system and bacterial communities are certainly interesting in this respect. Connecting these network-level approaches to the knowledge provided by studies at the level of individual reactions is clearly important–to design a small molecule that affects the network in the desired direction, we need to know the components of each module. The convergence of analysis at the level of individual reactions and of entire networks is especially appealing, as it may lead to conceptually different ways of controlling complex networks, with potential relevance to medicine and engineering. Rather than focusing on inhibiting or activating a single enzyme or a receptor, we may focus on shifting a threshold, controlling the position of a steady state, or controlling a spatial concentration profile. We are also excited by the chemical opportunities. How do we use modular mechanisms to construct simple chemical systems that perform functions reminiscent of the functions of living systems? At what level of complexity do we see emergence of new functions?44 At what level of complexity do these systems begin to evolve? Exploring these questions and directions will certainly be intensely interesting, and would have the potential to impact both fundamental and applied science.
Acknowledgments
This work was supported in part by NSF CAREER Award CHE-0349034, ONR Grant N00014-03-10482, NIH Grant R01 GM077331, and the Dreyfus Teacher-Scholar Award. R.F.I. is a Cottrell Scholar of Research Corporation and an A. P. Sloan Research Fellow. Some of this work was performed at the MRSEC microfluidic facility funded by the NSF.
Biographies
Christian J. Kastrup is a graduate student in the Department of Chemistry at The University of Chicago.
Matthew K. Runyon is a graduate student in the Department of Chemistry at The University of Chicago.
Elena M. Lucchetta is a posdoctoral scholar in the Department of Chemistry at The University of Chicago.
Jessica M. Price received her B.A. from Lake Forest College.
Rustem F. Ismagilov received his Ph.D. from the University of Wisconsin, Madison, where he worked with Stephen F. Nelsen. He did his postdoctoral work with George M. Whitesides at Harvard University. He is now a Professor of Chemistry at The University of Chicago.
References
- 1.Milo R, Shen-Orr S, Itzkovitz S, Kashtan N, Chklovskii D, Alon U. Network motifs: Simple building blocks of complex networks. Science. 2002;298:824–827. doi: 10.1126/science.298.5594.824. [DOI] [PubMed] [Google Scholar]
- 2.Hartwell LH, Hopfield JJ, Leibler S, Murray AW. From molecular to modular cell biology. Nature. 1999;402:C47–C52. doi: 10.1038/35011540. [DOI] [PubMed] [Google Scholar]
- 3.(a) Bertozzi CR, Kiessling LL. Chemical glycobiology. Science. 2001;291:2357–2364. doi: 10.1126/science.1059820. [DOI] [PubMed] [Google Scholar]; (b) Jessani N, Cravatt BF. The development and application of methods for activity-based protein profiling. Curr Opin Chem Biol. 2004;8:54–59. doi: 10.1016/j.cbpa.2003.11.004. [DOI] [PubMed] [Google Scholar]
- 4.Kastrup CJ, Runyon MK, Shen F, Ismagilov RF. Modular chemical mechanism predicts spatiotemporal dynamics of initiation in the complex network of hemostasis. Proc Natl Acad Sci USA. 2006;103:15747–15752. doi: 10.1073/pnas.0605560103. [DOI] [PMC free article] [PubMed] [Google Scholar]
- 5.Runyon MK, Johnson-Kerner BL, Ismagilov RF. Minimal functional model of hemostasis in a biomimetic microfluidic system. Angew Chem Int Ed. 2004;43:1531–1536. doi: 10.1002/anie.200353428. [DOI] [PubMed] [Google Scholar]
- 6.Runyon MK, Johnson-Kerner BL, Kastrup CJ, Van Ha TG, Ismagilov RF. Propagation of blood clotting in the complex biochemical network of hemostasis is described by a simple mechanism. J Am Chem Soc. 2007;129:7014–7015. doi: 10.1021/ja072602p. [DOI] [PubMed] [Google Scholar]
- 7.Lucchetta EM, Lee JH, Fu LA, Patel NH, Ismagilov RF. Dynamics of Drosophila embryonic patterning network perturbed in space and time using microfluidics. Nature. 2005;434:1134–1138. doi: 10.1038/nature03509. [DOI] [PMC free article] [PubMed] [Google Scholar]
- 8.Ephrussi A, Johnston D. Seeing is believing: The bicoid morphogen gradient matures. Cell. 2004;116:143–152. doi: 10.1016/s0092-8674(04)00037-6. and references cited therein. [DOI] [PubMed] [Google Scholar]
- 9.Mann KG, Butenas S, Brummel K. The dynamics of thrombin formation. Arterioscler Thromb Vasc Biol. 2003;23:17–25. doi: 10.1161/01.atv.0000046238.23903.fc. and references cited therein. [DOI] [PubMed] [Google Scholar]
- 10.Morrissey JH. Tissue factor: in at the start... and the finish. J Thromb Haemostasis. 2003;1:878–880. doi: 10.1046/j.1538-7836.2003.00219.x. [DOI] [PubMed] [Google Scholar]
- 11.Beltrami E, Jesty J. The role of membrane patch size and flow in regulating a proteolytic feedback threshold on a membrane: Possible application in blood coagulation. Math Biosci. 2001;172:1–13. doi: 10.1016/s0025-5564(01)00064-5. [DOI] [PubMed] [Google Scholar]
- 12.(a) Butenas S, Mann KG. Active tissue factor in blood. Nat Med. 2004;10:1155–1156. doi: 10.1038/nm1104-1155b. [DOI] [PubMed] [Google Scholar]; (b) Bogdanov VY, Hathcock J, Nemerson Y. Active tissue factor in blood? Reply. Nat Med. 2004;10:1156. doi: 10.1038/nm1104-1155b. [DOI] [PubMed] [Google Scholar]
- 13.Tyson JJ, Chen KC, Novak B. Sniffers, buzzers, toggles and blinkers: Dynamics of regulatory and signaling pathways in the cell. Curr Opin Cell Biol. 2003;15:221–231. doi: 10.1016/s0955-0674(03)00017-6. [DOI] [PubMed] [Google Scholar]
- 14.Witkowski FX, Leon LJ, Penkoske PA, Giles WR, Spano ML, Ditto WL, Winfree AT. Spatiotemporal evolution of ventricular fibrillation. Nature. 1998;392:78–82. doi: 10.1038/32170. [DOI] [PubMed] [Google Scholar]
- 15.Frohnhofer HG, Nusslein-Volhard C. Organization of anterior pattern in the Drosophila embryo by the maternal gene bicoid. Nature. 1986;324:120–125. [Google Scholar]
- 16.(a) Whitesides GM, Ismagilov RF. Complexity in chemistry. Science. 1999;284:89–92. doi: 10.1126/science.284.5411.89. [DOI] [PubMed] [Google Scholar]; (b) Kastrup CJ, Ismagilov RF. A physical-organic mechanistic approach to understanding the complex reaction network of hemostasis (blood clotting) J Phys Org Chem. 2007;20:711–715. [Google Scholar]
- 17.Houchmandzadeh B, Wieschaus E, Leibler S. Establishment of developmental precision and proportions in the early Drosophila embryo. Nature. 2002;415:798–802. doi: 10.1038/415798a. [DOI] [PubMed] [Google Scholar]
- 18.(a) McAdams HH, Shapiro L. A bacterial cell-cycle regulatory network operating in time and space. Science. 2003;301:1874–1877. doi: 10.1126/science.1087694. [DOI] [PubMed] [Google Scholar]; (b) Stelling J, Sauer U, Szallasi Z, Doyle FJ, Doyle J. Robustness of cellular functions. Cell. 2004;118:675–685. doi: 10.1016/j.cell.2004.09.008. [DOI] [PubMed] [Google Scholar]
- 19.Bhattacharyya RP, Remenyi A, Yeh BJ, Lim WA. Domains, motifs, and scaffolds: The role of modular interactions in the evolution and wiring of cell signaling circuits. Annu Rev Biochem. 2006;75:655–680. doi: 10.1146/annurev.biochem.75.103004.142710. [DOI] [PubMed] [Google Scholar]
- 20.Goldbeter A, Koshland DE. An amplified sensitivity arising from covalent modification in biological-systems. Proc Natl Acad Sci USA. 1981;78:6840–6844. doi: 10.1073/pnas.78.11.6840. [DOI] [PMC free article] [PubMed] [Google Scholar]
- 21.Pomerening JR, Kim SY, Ferrell JE. Systems-level dissection of the cell-cycle oscillator: Bypassing positive feedback produces damped oscillations. Cell. 2005;122:565–578. doi: 10.1016/j.cell.2005.06.016. [DOI] [PubMed] [Google Scholar]
- 22.Ferrell JE. Self-perpetuating states in signal transduction: Positive feedback, double-negative feedback and bistability. Curr Opin Cell Biol. 2002;14:140–148. doi: 10.1016/s0955-0674(02)00314-9. [DOI] [PubMed] [Google Scholar]
- 23.(a) White MC, Doyle AG, Jacobsen EN. A synthetically useful, self-assembling MMO mimic system for catalytic alkene epoxidation with aqueous H2O2. J Am Chem Soc. 2001;123:7194–7195. doi: 10.1021/ja015884g. [DOI] [PubMed] [Google Scholar]; (b) Tshuva EY, Lippard SJ. Synthetic models for non-heme carboxylate-bridged diiron metalloproteins: Strategies and tactics. Chem Rev. 2004;104:987–1011. doi: 10.1021/cr020622y. [DOI] [PubMed] [Google Scholar]
- 24.Halpern J, Kim SH, Leung TW. Cobalt carbon bond-dissociation energy of coenzyme-B12. J Am Chem Soc. 1984;106:8317–8319. [Google Scholar]
- 25.Ross J. New approaches to the deduction of complex reaction mechanisms. Acc Chem Res. 2003;36:839–847. doi: 10.1021/ar020285f. [DOI] [PubMed] [Google Scholar]
- 26.Sprinzak D, Elowitz MB. Reconstruction of genetic circuits. Nature. 2005;438:443–448. doi: 10.1038/nature04335. [DOI] [PubMed] [Google Scholar]
- 27.Isaacs FJ, Hasty J, Cantor CR, Collins JJ. Prediction and measurement of an autoregulatory genetic module. Proc Natl Acad Sci USA. 2003;100:7714–7719. doi: 10.1073/pnas.1332628100. [DOI] [PMC free article] [PubMed] [Google Scholar]
- 28.Elowitz MB, Leibler S. A synthetic oscillatory network of transcriptional regulators. Nature. 2000;403:335–338. doi: 10.1038/35002125. [DOI] [PubMed] [Google Scholar]
- 29.Basu S, Gerchman Y, Collins CH, Arnold FH, Weiss R. A synthetic multicellular system for programmed pattern formation. Nature. 2005;434:1130–1134. doi: 10.1038/nature03461. [DOI] [PubMed] [Google Scholar]
- 30.(a) Cirak F, Cisternas JE, Cuitino AM, Ertl G, Holmes P, Kevrekidis IG, Ortiz M, Rotermund HH, Schunack M, Wolff J. Oscillatory thermomechanical instability of an ultrathin catalyst. Science. 2003;300:1932–1936. doi: 10.1126/science.1083909. [DOI] [PubMed] [Google Scholar]; (b) Mikhailov AS, Showalter K. Control of waves, patterns and turbulence in chemical systems. Phys Rep-Rev Sec Phys Lett. 2006;425:79–194. [Google Scholar]
- 31.Gerdts CJ, Sharoyan DE, Ismagilov RF. A synthetic reaction network: Chemical amplification using nonequilibrium autocatalytic reactions coupled in time. J Am Chem Soc. 2004;126:6327–6331. doi: 10.1021/ja031689l. [DOI] [PubMed] [Google Scholar]
- 32.Kurin-Csorgei K, Epstein IR, Orban M. Systematic design of chemical oscillators using complexation and precipitation equilibria. Nature. 2005;433:139–142. doi: 10.1038/nature03214. [DOI] [PubMed] [Google Scholar]
- 33.(a) Song H, Chen DL, Ismagilov RF. Reactions in droplets in microflulidic channels. Angew Chem Int Ed. 2006;45:7336–7356. doi: 10.1002/anie.200601554. [DOI] [PMC free article] [PubMed] [Google Scholar]; (b) deMello AJ. Control and detection of chemical reactions in microfluidic systems. Nature. 2006;442:394–402. doi: 10.1038/nature05062. [DOI] [PubMed] [Google Scholar]; (c) El-Ali J, Sorger PK, Jensen KF. Cells on chips. Nature. 2006;442:403–411. doi: 10.1038/nature05063. [DOI] [PubMed] [Google Scholar]; (d) Squires TM, Quake SR. Microfluidics: Fluid physics at the nanoliter scale. Rev Mod Phys. 2005;77:977–1026. [Google Scholar]; (e) Karlsson M, Davidson M, Karlsson R, Karlsson A, Bergenholtz J, Konkoli Z, Jesorka A, Lobovkina T, Hurtig J, Voinova M, Orwar O. Biomimetic nanoscale reactors and networks. Annu Rev Phys Chem. 2004;55:613–649. doi: 10.1146/annurev.physchem.55.091602.094319. [DOI] [PubMed] [Google Scholar]; (f) Whitesides GM. The origins and the future of microfluidics. Nature. 2006;442:368–373. doi: 10.1038/nature05058. [DOI] [PubMed] [Google Scholar]; (g) Mao HB, Yang TL, Cremer PS. A microfluidic device with a linear temperature gradient for parallel and combinatorial measurements. J Am Chem Soc. 2002;124:4432–4435. doi: 10.1021/ja017625x. [DOI] [PubMed] [Google Scholar]; (h) Wheeler AR, Throndset WR, Whelan RJ, Leach AM, Zare RN, Liao YH, Farrell K, Manger ID, Daridon A. Microfluidic device for single-cell analysis. Anal Chem. 2003;75:3581–3586. doi: 10.1021/ac0340758. [DOI] [PubMed] [Google Scholar]; (i) King KR, Wang SH, Irimia D, Jayaraman A, Toner M, Yarmush ML. A high-throughput microfluidic real-time gene expression living cell array. Lab Chip. 2007;7:77–85. doi: 10.1039/b612516f. [DOI] [PMC free article] [PubMed] [Google Scholar]
- 34.Weibel DB, DiLuzio WR, Whitesides GM. Microfabrication meets microbiology. Nat Rev Microbiol. 2007;5:209–218. doi: 10.1038/nrmicro1616. [DOI] [PubMed] [Google Scholar]
- 35.(a) Takayama S, Ostuni E, LeDuc P, Naruse K, Ingber DE, Whitesides GM. Laminar flows - Subcellular positioning of small molecules. Nature. 2001;411:1016–1016. doi: 10.1038/35082637. [DOI] [PubMed] [Google Scholar]; (b) Jeon NL, Baskaran H, Dertinger SKW, Whitesides GM, Van de Water L, Toner M. Neutrophil chemotaxis in linear and complex gradients of interleukin-8 formed in a microfabricated device. Nat Biotechnol. 2002;20:826–830. doi: 10.1038/nbt712. [DOI] [PubMed] [Google Scholar]; (c) Olofsson J, Bridle H, Sinclair J, Granfeldt D, Sahlin E, Orwar O. A chemical waveform synthesizer. Proc Natl Acad Sci USA. 2005;102:8097–8102. doi: 10.1073/pnas.0500230102. [DOI] [PMC free article] [PubMed] [Google Scholar]
- 36.(a) Chin VI, Taupin P, Sanga S, Scheel J, Gage FH, Bhatia SN. Microfabricated platform for studying stem cell fates. Biotechnol Bioeng. 2004;88:399–415. doi: 10.1002/bit.20254. [DOI] [PubMed] [Google Scholar]; (b) Lee PJ, Hung PJ, Shaw R, Jan L, Lee LP. Microfluidic application-specific integrated device for monitoring direct cell-cell communication via gap junctions between individual cell pairs. Appl Phys Lett. 2005;86:223902. [Google Scholar]
- 37.(a) DiLuzio WR, Turner L, Mayer M, Garstecki P, Weibel DB, Berg HC, Whitesides GM. Escherichia coli swim on the right-hand side. Nature. 2005;435:1271–1274. doi: 10.1038/nature03660. [DOI] [PubMed] [Google Scholar]; (b) Mao HB, Cremer PS, Manson MD. A sensitive, versatile microfluidic assay for bacterial chemotaxis. Proc Natl Acad Sci USA. 2003;100:5449–5454. doi: 10.1073/pnas.0931258100. [DOI] [PMC free article] [PubMed] [Google Scholar]
- 38.(a) Keymer JE, Galajda P, Muldoon C, Park S, Austin RH. Bacterial metapopulations in nanofabricated landscapes. Proc Natl Acad Sci USA. 2006;103:17290–17295. doi: 10.1073/pnas.0607971103. [DOI] [PMC free article] [PubMed] [Google Scholar]; (b) Balagadde FK, You LC, Hansen CL, Arnold FH, Quake SR. Long-term monitoring of bacteria undergoing programmed population control in a microchemostat. Science. 2005;309:137–140. doi: 10.1126/science.1109173. [DOI] [PubMed] [Google Scholar]
- 39.Groves JT, Boxer SG. Micropattern formation in supported lipid membranes. Acc Chem Res. 2002;35:149–157. doi: 10.1021/ar950039m. [DOI] [PubMed] [Google Scholar]
- 40.Whitesides GM, Ostuni E, Takayama S, Jiang XY, Ingber DE. Soft lithography in biology and biochemistry. Annu Rev Biomed Eng. 2001;3:335–373. doi: 10.1146/annurev.bioeng.3.1.335. [DOI] [PubMed] [Google Scholar]
- 41.(a) Mrksich M. A surface chemistry approach to studying cell adhesion. Chem Soc Rev. 2000;29:267–273. [Google Scholar]; (b) Mossman KD, Campi G, Groves JT, Dustin ML. Altered TCR signaling from geometrically repatterned immunological synapses. Science. 2005;310:1191–1193. doi: 10.1126/science.1119238. [DOI] [PubMed] [Google Scholar]
- 42.Langer R, Tirrell DA. Designing materials for biology and medicine. Nature. 2004;428:487–492. doi: 10.1038/nature02388. [DOI] [PubMed] [Google Scholar]
- 43.Nagypal I, Epstein IR. Systematic design of chemical oscillators. 37. Fluctuations and stirring rate effects in the chlorite thiosulfate reaction. J Phys Chem. 1986;90:6285–6292. [Google Scholar]
- 44.Kastrup CJ, Shen F, Ismagilov RF. Response to shape emerges in a complex biochemical network and its simple chemical analogue. Angew Chem Int Ed. 2007;46:3660–3662. doi: 10.1002/anie.200604995. [DOI] [PubMed] [Google Scholar]
- 45.Kastrup CJ, Shen F, Runyon MK, Ismagilov RF. Characterization of the threshold response of initiation of blood clotting to stimulus patch size. Biophys J. 2007;93:2969–2977. doi: 10.1529/biophysj.107.109009. [DOI] [PMC free article] [PubMed] [Google Scholar]
- 46.Lobanova ES, Ataullakhanov FI. Unstable trigger waves induce various intricate dynamic regimes in a reaction-diffusion system of blood clotting. Phys Rev Lett. 2003;91:138301. doi: 10.1103/PhysRevLett.91.138301. [DOI] [PubMed] [Google Scholar]
- 47.De Renzis S, Elemento O, Tavazoie S, Wieschaus EF. Unmasking activation of the zygotic genome using chromosomal deletions in the Drosophila embryo. PLoS Biol. 2007;5:1036–1051. doi: 10.1371/journal.pbio.0050117. [DOI] [PMC free article] [PubMed] [Google Scholar]
- 48.For definitions and illustrations, see http://www.flybase.org.
- 49.(a) Mehra A, Hong CI, Shi M, Loros JJ, Dunlap JC, Ruoff P. Circadian rhythmicity by autocatalysis. PLoS Comput Biol. 2006;2:816–823. doi: 10.1371/journal.pcbi.0020096. [DOI] [PMC free article] [PubMed] [Google Scholar]; (b) Hong CI, Conrad ED, Tyson JJ. A proposal for robust temperature compensation of circadian rhythms. Proc Natl Acad Sci USA. 2007;104:1195–1200. doi: 10.1073/pnas.0601378104. [DOI] [PMC free article] [PubMed] [Google Scholar]
- 50.French V, Feast M, Partridge L. Body size and cell size in Drosophila: The developmental response to temperature. J Insect Physiol. 1998;44:1081–1089. doi: 10.1016/s0022-1910(98)00061-4. [DOI] [PubMed] [Google Scholar]
- 51.Lucchetta EM, Munson MS, Ismagilov RF. Characterization of the local temperature in space and time around a developing Drosophila embryo in a microfluidic device. Lab Chip. 2006;6:185–190. doi: 10.1039/b516119c. [DOI] [PubMed] [Google Scholar]


