

Abstract
Edge-region grouping (ERG) is proposed as a unifying and previously unrecognized class of relational information that influences figure-ground organization and perceived depth across an edge. ERG occurs when the edge between two regions is differentially grouped with one region based on classic principles of similarity grouping. The ERG hypothesis predicts that the grouped side will tend to be perceived as the closer, figural region. Six experiments are reported that test the predictions of the ERG hypothesis for six similarity-based factors: common fate, blur similarity, color similarity, orientation similarity, proximity, and flicker synchrony. All six factors produce the predicted effects, although to different degrees. In the seventh experiment, the strengths of these figural/depth effects were found to correlate highly with the strength of explicit grouping ratings of the same visual displays. The relations of ERG to prior results in the literature are discussed, and possible reasons for ERG-based figural/depth effects are considered. We argue that grouping processes mediate at least some of the effects we report here, although ecological explanations are also likely to be relevant in the majority of cases.
When a human observer views the visible environment, optical events are interpreted as arising from physical objects that differ not only in their direction from the observer's viewpoint, but in their distance as well. The ecological basis of such distance (or depth) information, the algorithms capable of computing it, and the neural mechanisms responsible for extracting it all rest critically on the foundation of the classic depth cues, such as binocular disparity, motion parallax, shading, and occlusion (see Howard, 2002, and Howard and Rogers, 2002, for comprehensive reviews.) The present article argues for the existence of a previously unrecognized class of depth information that we call edge-region grouping (ERG).
In an environment of opaque objects, when two surfaces at different distances project to adjacent regions in an optical image, the image edge between them necessarily corresponds to the physical edge of the closer surface. If the visual system could somehow determine to which image region such a depth edge belongs, it could therefore determine which of the two surfaces is closer: namely, the one to which the edge belongs. This is essentially the rationale for postulating a visual process called edge assignment, border ownership, and various other pairings of these terms (e.g., Nakayama, Shimojo, & Silverman, 1989). Psychological studies of figure-ground organization provide important information about this process of edge assignment and the factors that influence it, including not only the classical cues of surroundedness, size, orientation, contrast, and symmetry (Rubin, 1958), but the more recently discovered cues of edge convexity (Kanizsa & Gerbino, 1976), lower region (Vecera, Vogel, & Woodman, 2002), spatial frequency (Klymenko & Weisstein, 1986), flicker (Wong & Weisstein, 1987), attention (Baylis & Driver, 1995; Vecera, et al., 2004), top-bottom polarity (Hulleman & Humphreys, 2004), shape familiarity (e.g., Peterson, 1994), extremal edges (Palmer & Ghose, 2008), and gradient cuts (Ghose & Palmer, 2007). To this list we propose adding edge-region grouping (ERG) as a previously unrecognized class of information about edge assignment that systematically influences perceived depth and figure-ground organization.
The nature of ERG can most easily be understood by considering the central question of edge assignment as follows: To which of its two attached image regions does a given edge belong? This quite natural formulation in terms of “belongingness” strongly suggests that differential grouping between an edge and its attached regions might influence perceived depth and figural assignment via the classical Gestalt grouping principles of common fate (similarity of motion), proximity (similarity of position), and various other forms of similarity grouping (Wertheimer 1923). The relevance of such grouping principles to figure-ground processing has not previously been evident at least in part because the displays typically used consist of homogeneous regions divided by simple contrast or chromatic edges, in which case the edge has no visual properties in common with its attached regions. If the attached regions are textured, however, or if the edge itself is a separate visual entity, such as a line, then various bases for ERG become available. Based on the argument stated above, the ERG hypothesis thus predicts that similarity grouping of an edge with one of its attached regions will cause the grouped region to be perceived as closer and figural.
To illustrate the ERG hypothesis with a concrete example, consider grouping by common fate (i.e., similarity of motion). If the texture on one side of an edge moves synchronously and rigidly with the edge, whereas the texture on the other side is stationary or moves in a different direction, the edge should group with the region whose elements have the same motion vector. The ERG hypothesis predicts that the edge-grouped side should be perceived as closer and figural. Indeed, this is the case, as the results of Experiment 1 and the phenomenology arising from examples of such motion displays unequivocally show (for an animated demonstration, see Supplementary Materials).
For reasons that will become important later, we also want to postulate the inverse-ERG hypothesis, which states that once an edge has been assigned to a region, for any reason, that edge is consequently grouped with that region. The inverse-ERG hypothesis follows directly from the definitions of edge assignment and grouping. It is essentially the flip-side of the ERG hypothesis (that edge-region grouping causes the edge-grouped side to be seen as figural) because the inverse-ERG hypothesis postulates that the assignment of the edge to the figural region causes the edge to group with that region. We further note that, unlike the ERG hypothesis, the inverse-ERG hypothesis is completely general in that it concerns the effects of any factor that influences relative depth across an edge, be they classical figure-ground factors, edge-region grouping factors, depth cues that operate over an edge, or even attentional factors. The ERG hypothesis applies only to grouping factors arising from similarities between the edge and its adjacent regions. Neither hypothesis has previously been remarked upon, to our knowledge, and both will be important for understanding the phenomena reported in this article, but the primary focus will be on testing the ERG hypothesis.
We report the perceptual effects of ERG on depth perception and figural status for six grouping factors: similarity grouping based on motion (common fate), spatial position (proximity), color, orientation, blur, and flicker. With the possible exception of blur similarity (which has seldom, if ever, been discussed explicitly as a factor in the grouping literature but is nevertheless a perfectly valid form of visual similarity), these are all well-documented principles of similarity grouping, and we make no claim to be proposing any new grouping principles in this article. There are two features of the ERG hypothesis that do appear to be novel, however. One is the proposal that an edge can be grouped with texture and/or other surface properties of its adjacent regions based on similarity of shared features. For reasons that are not entirely clear to us, edges have seldom been discussed as being grouped with anything except other edges, as in applications of the principles of good continuation and/or closedness that can be used to link together different parts of the same physical edge (e.g., Elder & Zucker, 1996). It is not that anyone has ever stated that edges cannot group with texture elements; it is just that no one, to our knowledge, has ever proposed or evaluated the possibility that they can. Given that edges can and often do have properties in common with certain aspects of adjacent regions, however, there is good reason to suppose that the visual system would take advantage of this fact, especially if it provides ecologically valid information about environmental depth. The nature of this important environmental information constitutes the second novel aspect of the ERG hypothesis: the prediction that the side that groups most strongly with the edge will be perceived as closer and figural. This follows directly from the eminently plausible ecological argument that an edge will tend to be visually more similar to the surface to which it is physically attached than to the surface it occludes. It is also supported empirically by the results of the seven experiments reported below.
The depth and figure-ground effects we describe here are not all as novel as we originally believed. After collecting the data, we found that two of the depth effects we thought we had discovered had been previously reported by others as isolated cues to depth: common fate by Yonas, Craton, and Thompson (1987) and blur similarity by Marshall, Burbeck, Ariely, Rolland, and Martin (1996) and others (e.g., Mather & Smith, 2002). None of these results were discussed as arising from grouping phenomena, however, and the none of the authors related them to each other or to the more general principle of ERG that we propose unifies and underlies them. The other four are newly discovered phenomena of depth perception and figure-ground organization that are predicted by the ERG hypothesis, although even two of these have some precedent in prior results (e.g., Klymenko & Weisstein, 1986; Wong and Weisstein, 1987; Yonas, et al., 1987), as we will explain below. The important connections between these figural/depth effects and classical grouping principles were not recognized until now.
The ERG hypothesis thus both unifies several known effects that were previously thought to be unrelated and predicts new effects that are confirmed in the experiments reported below. More than that, however, the ERG hypothesis suggests a single, plausible, ecological rationale for these effects. Because opaque surfaces occlude farther adjacent surfaces but not nearer ones, occluding edges of opaque objects physically belong to the nearer surface. As a result, the edge tends to have projected visual properties that are more similar to those of the surface to which it is attached than to those of the surface it occludes. If the nearer surface moves while the farther surface does not, for example, the edge moves with the texture on the nearer surface. If the farther surface moves while the nearer surface does not, the edge still has the same motion as the texture on the nearer surface: namely, no motion at all. All of the grouping factors we examine below can thus be understood within an ecological rationale of this form, although some factors do so more plausibly than others.
General Methods
Experiments 1-6 used the same general methods. First, the display conditions employed simple bipartite displays that were devised to test crucial predictions of the ERG hypothesis. A full display set was then constructed with the necessary controls to counterbalance possible artifacts, such as the side (left/right) and color (red/green in Experiment 3 and white/black for other experiments) of the region that the ERG hypothesis predicts will be seen as closer and figural. Participants were shown an individually randomized series of the full set of displays, controlled by Presentation software (Neurobehavioral Systems, Inc., Albany, CA: http://www.neurobs.com). After a 500 ms blank inter-trial interval, a fixation point was presented for 1 s, followed by a 250 ms presentation of the display unless stated otherwise. Participants made two responses, the first indicating whether they saw the left, right, or neither side as closer and figural, and the second indicating their rating of the strength of that perception and/or their confidence in the judgment they made (1 = weak, 2 = medium, or 3 = strong). These two responses were combined into a seven-point scale that we will call a figural/depth rating, because it encompasses both figure-ground organization and perceived depth across an edge, that was computed by assigning +1 to the first response if the chosen side conformed to the ERG hypothesis, −1 if the opposite side was chosen, and 0 if neither side was chosen, and then multiplying this value by the strength rating. This procedure produces a signed variable that ranges from −3 (strongly inconsistent with the ERG hypothesis) to +3 (strongly consistent with the ERG hypothesis). The expected value of this figural/depth rating is 0 if responses are random with respect to the ERG predictions, positive if they are consistent with them, and negative if they are inconsistent with them.
The figural/depth rating provides a concise, composite representation of figure-ground judgments and the strength of the perception (or their confidence in the judgment). Nevertheless, one may want to determine which of the factors that comprise it (strength/confidence ratings, figure-ground judgments, or both) is affected by the stimulus manipulations. To this end, we also present the average percentages of trials for which observers judged as figural the side consistent with ERG, the side inconsistent with ERG, or neither (i.e., a neutral judgment). An effect of grouping on figure-ground judgments will be reflected as a preference to choose the side predicted by the ERG hypothesis as figural compared to choosing the opposite (non-grouped) side or neither side as figural.
Participants
All participants were students at the University of California, Berkeley, who received partial course credit in their undergraduate psychology course for their participation. All gave informed consent, and the University of California, Berkeley, Committee for the Protection of Human Subjects approved the experimental protocol. The mean age of participants was about 20 years.
Displays
Participants viewed the computer screen from approximately 60 cm. Each display was presented within a square region about 5° (of visual angle) wide and centered at fixation against a neutral gray background. The square region was divided by a pseudo-randomly generated curved edge that had endpoints near the horizontal midpoints of the square's top and bottom. This created two regions of approximately equal size. The regions were about equally convex and concave and did not depict any familiar shape on either side. These features avoided contamination by the known figural factors of lower region, smaller area, convexity, and meaningfulness. Unless otherwise specified, each region was randomly covered with square dots that were 0.15° wide and opposite in color to their regional background. The dots were distributed randomly across the region with an average spacing of 0.40°. Participants saw a particular display only one time over the course of an experiment.
Instructions
The experimenter explained the term figural by showing the classic face/vase drawing (Rubin, 1921), asking the participant if he/she had seen the drawing before, and then explaining how it could be seen in two ways. The experimenter clearly stated that the figural region is the one that seems to “have shape” or “be the object” and “looks like it is in front.” The experimenter stressed that there was no correct answer, that the regions did not need to look like any recognizable shape to be seen as figural, and that the same display could be seen in different ways at different times. Participants were also instructed to report only his/her first perception, and the brief presentation duration made multiple perceptions unlikely.
Experiment 1: Common Fate
First, we examined whether perceived depth and figure-ground status are affected by ERG via the well-known grouping principle of common fate (i.e., motion similarity). The ERG hypothesis predicts that the edge will be grouped with the region whose texture elements have the same motion vector and that this grouping will cause that side to be perceived as closer and figural. To avoid contamination of the closely related depth cue of accretion/deletion of texture (Gibson, Kaplan, Reynolds, & Wheeler, 1969), the edge never occluded any texture elements during its motion.
We investigated three cases. In the moving-edge condition (Figure 1A) the edge moved horizontally, while the texture on one side moved rigidly with it and the texture on the other side was stationary. The ERG hypothesis predicts that the moving side should be perceived as closer and figural. To eliminate the possibility that moving texture alone might cause the result, we included the stationary-edge condition (Figure 1B) in which only the texture on one side moved. If moving texture alone caused a figural/depth effect, the moving side should be seen as closer and figural, even when the edge is stationary. ERG predicts the opposite result, however: The moving side should be seen as the farther ground, because the stationary side now has the same motion vector as the edge (namely, zero). The opposite-motion condition (Figure 1C) was similar to Yonas et al.'s (1987) displays: Texture on both sides of the edge moved in opposite directions, and the edge moved rigidly with one of them. The ERG hypothesis predicts a bias toward seeing the side that has the same motion vector as the edge as closer and figural.
Figure 1.
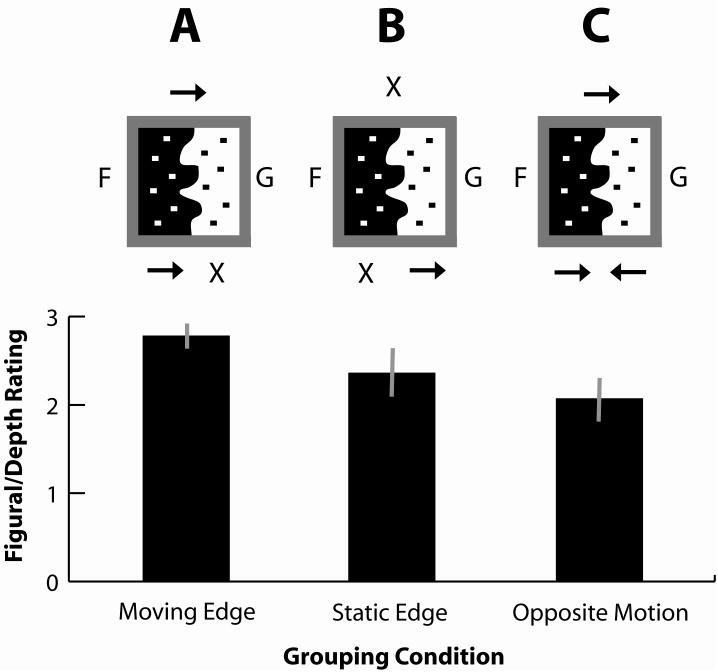
Figural/depth ratings on a scale of -3 (inconsistent with edge-region grouping) to +3 (consistent with edge-region grouping) as a function of edge-region motion similarity condition. The conditions -- moving-edge (A), static-edge (B), and opposite-motion (C) -- are depicted symbolically above the results. The icon (arrow or “X”) above each display example indicates the motion of the edge. The motions of the textured regions are indicated by the icons below the display example. “X” indicates no motion of the corresponding portion of the display (edge or textured region). Arrows pointing in the same direction indicate that the two elements were moving together in common fate. The “F” and “G” located laterally to each display example indicates the side of the display predicted as figure (F) and ground (G) by the ERG hypothesis. Examples of the animated displays for this experiment can be seen in the Supplementary Materials section of the journal website. Error bars represent standard errors of the mean.
Methods
Seven male and eight female participants were shown five replications of 12 conditions in a 3 × 2 × 2 within-subjects design defined by grouping condition (moving edge, static edge, or opposite motion; see Figures 1A, 1B, and 1C, respectively), side of the grouped texture (left/right), and background color of the region containing the grouped texture (black/white). Moving elements oscillated horizontally by 0.15° at 2.5 Hz for 2 seconds, beginning rightward or leftward at random and moving at constant speed until their direction changed instantaneously at the endpoints. No texture elements lay in the motion path of the edge. Each trial began with a 1000-ms fixation cross, followed by five oscillations in the display, after which the presentation ended.
Results and Discussion
Average ratings on the −3 to +3 scale are shown below the corresponding display diagrams in Figure 1. Participants were strongly biased toward seeing the grouped side as closer and figural, as indicated by the highly positive ratings. The ratings were significantly greater than zero for the moving-edge condition, t(14) = 38.93, p < 0.0001, static-edge condition, t(14) = 10.74, p < 0.0001, and opposite-motion condition, t(14) = 12.11, p < 0.0001. The moving-edge condition produced significantly higher ratings than the opposite-motion condition, F(1,14) = 15.64, p < 0.001, η2 = 0.53, and marginally higher ratings than the static-edge condition, F(1,14) = 3.74, p < 0.07, η2 = 0.21. The static-edge and opposite-motion conditions did not differ reliably, F(1,14) = 2.46, p < 0.13, η2 = 0.15.
The figure-ground judgment data for Experiment 1, summarizing the qualitative judgments of which side, if any, appeared to be the closer figure, are shown in Table 1 for all three grouping conditions. The grouped side was judged figural significantly more often than 50% in the moving-edge condition, t(14) = 149.0, p < 0.0001, in the static-edge condition, t(14) = 5.91, p < 0.0001, and in the opposite motion condition, t(14) = 12.04, p < 0.0001. The static-edge and moving-edge conditions did not differ in terms of the percentage of trials on which the grouped side was chosen as figural, F(1,14) = 2.39, p = 0.144, η2 =0.15. The static edge condition also did not differ significantly from the opposite motion condition, F(1,14) = 0.82, p < 0.79, η2 = 0.01. However, the grouped side was chosen less frequently in the opposite motion condition than in the moving-edge condition, F(1,14) = 6.38, p < 0.024, η2 = 0.31.
Table 1. Common Fate: Average percentage of trials on which each judgment was made.
| Grouping Condition | Grouped side judged figural | Neutral Judgments | Non-grouped side judged figural |
|---|---|---|---|
| Moving Edge | 99.7% | 0.0% | 0.3% |
| Static Edge | 89.3% | 9.7% | 1.0% |
| Opposite Motion | 91.3% | 8.0% | 0.7% |
ERG via common fate thus creates a very compelling perception of relative depth across the shared edge and of a figure against a ground as measured by both the signed rating data and the categorical judgment data. The opposite motion condition replicates the finding of Yonas, et al. (1987), although they interpreted their result as a generalization of motion parallax and did not consider perceptual grouping as a cause. The possibility that textural motion itself is responsible for the effect is eliminated by the static edge and opposite motion conditions, because both confirm the predictions of the ERG hypothesis and contradict those based on absolute motion.
Absolute motion did influence the ratings, albeit weakly, in that the moving edge condition (in which ERG and absolute motion are consistent) produced higher ratings than the static edge condition (in which they conflict). The bias toward perceiving the edge-grouped side as closer is clearly much stronger than the bias toward perceiving the moving side as closer, however. The difference between the ratings in the moving and static edge conditions can largely be attributed to higher strength/confidence ratings for the moving edge condition. Although the grouped (and moving) side was judged figural in the moving edge condition more often than in the static edge condition, this difference was not significant, possibly due to ceiling effects given that both conditions were chosen on over 90% of the trials. The difference in ratings between the moving edge condition and the opposite motion condition are more plausibly attributed to differences in which side was chosen, because participants were significantly less likely to choose the grouped side in the opposite motion condition than in the moving edge condition. For both conditions, though, the grouped side was overwhelmingly chosen more often than the non-grouped side. The reason for the absolute motion effect is unclear, but compatible with the possibility that motion might draw attention to the moving region exogenously (although the effect of motion on attention is controversial; see Hillstrom & Yantis, 1994), and that attention itself might then bias perception toward seeing the moving region as figure (Vecera, Flevaris, & Filapek, 2004).
The effects that we have observed cannot be attributed to other depth cues such as accretion and deletion of texture. We ensured that the edge never occluded any texture elements in its (or the elements') oscillatory paths of motion. One might wonder whether the implied accretion/deletion of texture, based on extrapolation of the motion of either the edge or the texture elements is a relevant factor.1 Although we have not done a formal experiment to test this possibility we have generated a demonstration display in which the edge and texture elements oscillate vertically instead of horizontally with no differential implied accretion and deletion on the two sides because neither set of dots is moving toward the edge. (see Supplemental Materials). We informally asked four colleagues (all of whom were naïve to the experimental hypothesis) to report their perception of the figure-ground organization of this display. All four chose the side predicted by edge-region grouping. Although it is possible that the proposed implied accretion/deletion cue may contribute marginally to the effects we observed, it seems unlikely to explain them. Further study is necessary to quantitatively estimate its contribution, if any.
Some readers have objected that the present effects may arise not so much from the edge and similarly moving texture being grouped as it does from the edge and differently moving texture being discriminated. We agree that our data do not allow these alternatives to be distinguished, but we note that this objection applies to all grouping phenomena and has no special status here. In general, the fact that A goes with B rather than with C can be explained by greater similarity between A and B, greater difference between A and C, or both. In any case, the possibility that the edge may be discriminated more strongly from the farther region does not detract from the hypothesis that “relative belongingness” (which is usually termed grouping) produces the results we observed.
Experiment 2: Blur Similarity
Another similarity-based form of ERG with strong ecological justification is blur similarity. If the textures of adjacent visible surfaces and the edge between them are sharp and if the eyes fixate on one of the two surfaces, the projected image of the fixated surface will also be sharp, because the lens of the eye accommodates the fixated surface. If there is a depth difference between the fixated surface and surfaces adjacent to it, surfaces at both closer and farther viewing distances will be blurred, to a degree determined by their distances from the fixated surface and the optical properties of the accommodated lens. Because both closer and farther surfaces are blurred, absolute blur is not useful for determining the relative depth of two arbitrarily chosen regions. If the two surfaces project to image regions sharing a common depth edge, however, edge-region blur similarity can disambiguate relative depth: The edge will tend to belong to the region whose texture has the same (or most similar) degree of blur as the edge. The reason is that the edge and texture from the same physical surface will lie at the same (or very similar) distances from the observer, whereas the texture from the farther surface will be at a different distance. Assuming that the physical edge and textures involved are all sharp, both the edge and closer texture will be sharp if the eye is accommodated for the closer surface (Figure 2A), and both will be blurry if the eye is accommodated for the farther surface (Figure 2B). Marshall et al. (1996) and others (e.g., Mather and Smith, 2002) previously reported depth effects due to relative blur of edges and textures in adjacent regions, but they did not relate them to grouping principles. We independently rediscovered these blur similarity effects in the present study in the more general context of edge-region grouping.
Figure 2.
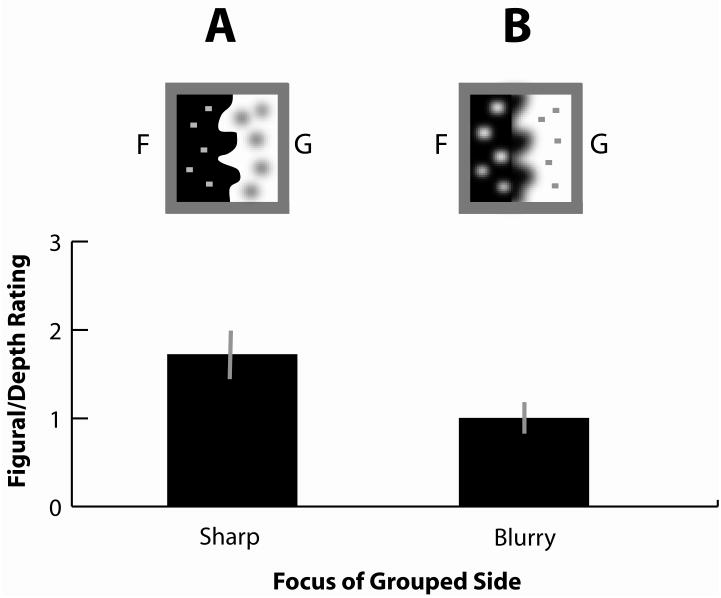
Figural/depth rating as a function of edge-texture blur similarity for two types of edge: blurry and sharp (in these conditions the grouped side is blurry and sharp, respectively). Positive ratings indicate results consistent with the ERG hypothesis. (A) An example display in which the edge is in sharp focus and grouped with the sharp texture elements on the left side of the display. (B) An example display in which the edge is blurry and grouped with the blurry texture elements on the left side of the display. Error bars represent standard errors of the mean.
Methods
Six male and seven female participants were shown ten replications of 8 conditions in a 2 × 2 × 2 within-subjects design, defined by edge condition (sharp/blurred), color of the grouped side (black/white), and grouped side (left/right). The dots on one side and/or the edge itself were blurred using a Gaussian kernel with a 6-pixel radius (0.18°). Because blurring the 5-pixel dots used in the other experiments significantly reduced the dot-to-background contrast, the size of the dots was increased to 9 pixels (0.27°) in the present experiment. This produced blurred dots whose contrast was about equal to the sharp dots (see Figure 2). The texture on one side was always blurred and the other always sharp, but the edge was blurred on half the trials and sharp on the other half. The ERG hypothesis predicts that the side whose texture has the same blur as the edge will tend to be seen as closer and figural.
Results and Discussion
Figure 2 shows the average figural/depth ratings for sharp and blurred edges. As predicted by the ERG hypothesis, textured regions with the same blur as the edge were seen as closer and figural, having ratings significantly greater than zero overall, F(1,12) = 24.21, p < 0.0001, η2 = 0.67. The ratings were significantly higher when the grouped edge and texture were both sharp than when they were both blurred, F(1,12) = 17.71, p < 0.001, η2 = 0.59. This result indicates that absolute blur influences perceived depth and figural status, such that blurred elements tend to be seen as farther and ground-like. This effect is consistent with the well known depth cue of aerial (or atmospheric) perspective, in which the images of objects at large distances are blurred due to the scattering of light by tiny particles in the atmosphere. The size of the relative and absolute blur effects indicates that relative blur is the more potent factor, however, as ecological considerations lead one to expect. No other factors or interactions reached statistical significance.
The figure-ground judgment data for Experiment 2 are shown in Table 2 for both the sharp and blurry conditions. Participants chose the grouped side more often than the non-grouped side in the sharp condition, t(12) = 7.00, p < 0.0001, and in the blurry condition, t(12) = 3.13, p < 0.009. Participants also chose the grouped side as figural more often in the sharp condition than in the blurry condition, F(1,12) = 12.82, p < 0.004, η2 = 0.52. These results show that the figure-ground judgments mirror the ratings data. Thus, differences in the figure-ground ratings can be attributed to differences in perceived figure-ground organization rather than changes in strength/confidence alone, although strength/confidence may also play a role.
Table 2. Blur Similarity: Average percentage of trials on which each judgment was made.
| Focus of Grouped Side | Grouped side judged figural | Neutral Judgments | Non-grouped side judged figural |
|---|---|---|---|
| Sharp | 75.2% | 13.6% | 11.1% |
| Blurry | 62.7% | 13.1% | 24.0% |
A potentially related finding in the literature is Klymenko and Weisstein's (1986) report that high spatial frequency textures appear to be perceived as closer and figural. This is analogous to the absolute blur effect in the present experiment: All else being equal, sharper (i.e., less blurred) regions contain higher spatial frequencies and tend to be perceived as closer. The ERG hypothesis suggests, however, that many of their effects are probably due to the fact that the edges between regions in their displays were sharp, and therefore should be seen to group more strongly with the high-spatial-frequency side thereby causing it to be seen as closer and figural. The ERG hypothesis clearly predicts that the effect of absolute spatial frequency should reverse if the edge is sufficiently blurred, and that is the result we obtained in the present study.
Experiment 3: Color Similarity
Another well-known grouping principle is color similarity (Wertheimer, 1923). It does not apply to ERG with standard figure-ground displays, because an edge gradient is not associated with any single color that could cause differential grouping: The edge corresponds to a change in color from one side to the other. We therefore used a “line-edge” between two regions whose color could be manipulated relative to the adjacent regions in terms of their background colors and/or the colors of their texture elements. The ERG hypothesis predicts that the side whose color composition is more similar to the color of the edge should be seen as closer and figural, even though colored line edges are not ecologically frequent. We studied three conditions of surface color similarity: background color, texture color, and both together. The ERG hypothesis predicts that all three conditions will show figural/depth effects and that the combined effect of both background color and texture color will be greater than the effect of either of those factors alone, because the similar region should group more strongly with the edge when both factors support it.
Methods
Eight male and seven female participants were shown 20 replications of 12 conditions in a 2 × 2 × 3 within-subjects design. The first factor specified the color of the 0.15°-wide central edge in the display, which was either red or green at equiluminant levels2 (Figure 3). Equiluminance of the red and green colors was determined for each participant separately using standard flicker photometry methods (Wagner & Boynton, 1972) before the ERG experiment began. The second factor specified whether the region biased by color similarity was located on the left or right side of the display. The third factor specified the basis for the biased region being grouped with the edge: region color only (Figure 3A), texture color only (Figure 3B), or both region and texture color (Figure 3C). In the region-only condition, the color of the region on the grouped side was homogeneous in a lighter shade of the color of the edge, and the non-grouped side was homogeneous in an equiluminant shade of the other color. In the texture-only condition, the backgrounds of both adjacent regions were white in color, the dots on the grouped side were exactly the same color as the edge, and the dots on the other side were the luminance-matched other hue. In the texture-and-region condition, the texture dots in the grouped region were the same color as the edge and that region was filled with a lighter shade of the same color. The non-grouped side contained texture dots of the other color equiluminant to the grouped dots, and that region was filled with a lighter version of the color equiluminant to the color that filled the grouped region. See Supplemental Materials for full color versions.
Figure 3.
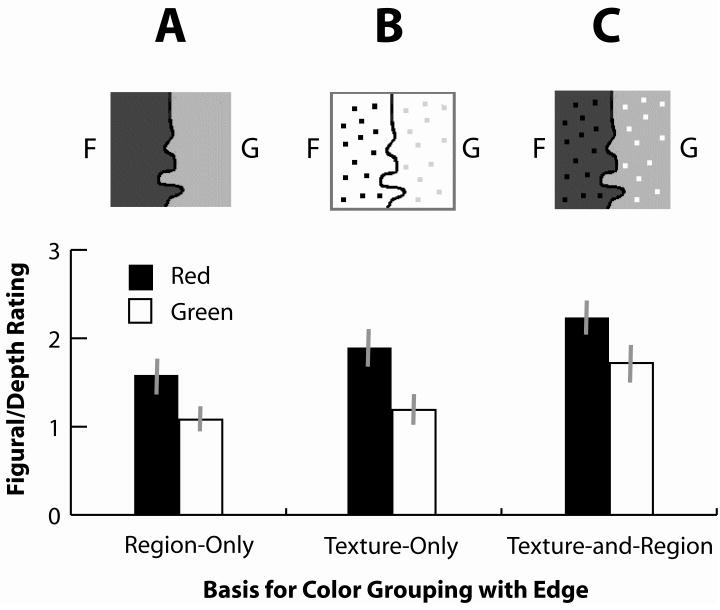
Figural/depth rating as a function of edge-region color similarity of three different types (region-only, texture-only, or region-and-texture). Positive ratings indicate results consistent with the ERG hypothesis. Example displays are depicted for (A) the region-only condition, (B) the texture-only condition, and (C) the texture-and-region condition. The left side of each display example is predicted to be figural by the ERG hypothesis. These examples do not accurately represent the appearance of the displays in the experiment, using lightness similarity to demonstrate color similarity relationships that were present in the actual displays. Example displays using the colors employed in the actual experiment can be seen in the Supplementary Materials section of the journal website. Error bars represent standard errors of the mean.
Results and Discussion
Figure 3 shows the average figural/depth ratings as a function of the color of the grouped surface and edge and the type of grouping (region only, texture only, or both region and texture). Overall, regions grouped with the edge by color similarity were strongly biased to be seen as closer and figural (i.e., ratings were significantly greater than zero), F(1,14) = 221.84, p < 0.00001, η2 = 0.94. There was a significant effect of the type of grouping, F(2,28) = 60.23, p < 0.0001, η2 = 0.81, due to the fact that the effect was stronger in the texture-and-region condition than in the region-only condition, F(1,14) = 192.18, p < 0.00001, η2 = 0.93, and in the texture-only condition, F(1,14) = 51.52, p < 0.0001, η2 = 0.79. The edge-region grouping effect was also stronger in the texture-only condition than in the region-only condition, F(1,14) = 8.95, p < 0.01, η2 = 0.39.
These effects of relative color were modulated by absolute color, in that the red regions and textures produced higher figural ratings than green regions and textures, F(1,14) = 54.58, p < 0.0001, η2 = 0.79. This relatively pronounced difference should not be due to different perceived luminances or contrasts because the shades of red and green were equated for luminance individually for each participant. It may arise from chromostereopsis, however, due to the differential refraction of light of different wavelengths as it passes through the cornea and lens of the eye. Long wavelength (i.e., red) light is bent less than short wavelength (i.e., blue) light, resulting in the perception of red objects as closer than blue ones for most (but not all) observers (Kishto, 1965). Similar, but less pronounced, effects can be produced with red and green, as in our study. Another possible explanation is that red may be seen as figural because it attracts more attention, and attended regions tend to be seen as figural (Vecera et al., 2004). The present data cannot discriminate between these possibilities, however, which will require further study.
Table 3 shows the average percentage of times the grouped and non-grouped sides were judged figural and how often neutral judgments occurred. Participants were more likely to choose the grouped side than the non-grouped side as figural in all three color similarity conditions: region-only, t(14) = 18.17, p < 0.0001, texture-only, t(14) = 17.95, p < 0.0001, and both, t(14) = 28.77, p < 0.0001. The results were also affected by the type of grouping. Participants were more likely to choose the grouped side as figural in the texture-only condition than in the region-only condition, F(1,14) = 5.01, p < 0.04, η2 = 0.26. Participants were also more likely to choose the grouped side as figural in the both condition than in the region-only condition, F(1,14) = 185.4, p < 0.0001, η2 = 0.93, and in the texture-only condition, F(1,14) = 34.182, p < 0.0001, η2 = 0.71. There was also a significant effect of color in all three grouping conditions: region-only, F(1,14) = 30.94, p < 0.001, η2 = 0.69, texture-only, F(1,14) = 51.84, p < 0.001, η2 = 0.79, and both, F(1,14) = 24.01, p < 0.001, η2 = 0.63. These results reflect the same pattern as those in the figure-ground ratings data. This suggests that the effects in figure-ground ratings are largely driven by initial assignment of figure-ground organization, although there may also be correlated differences in strength/confidence ratings.
Table 3. Color Similarity: Average percentage of trials on which each judgment was made.
| Grouping Condition and color of grouped Side | Grouped side judged figural | Neutral Judgments | Non-grouped side judged figural |
|---|---|---|---|
| Region Only – Red | 82.0% | 8.3% | 10.0% |
| Region Only – Green | 67.0% | 8.5% | 24.0% |
| Texture Only – Red | 87.7% | 8.2% | 4.2% |
| Texture Only – Green | 69.3% | 9.3% | 21.5% |
| Both – Red | 94.2% | 3.7% | 2.2% |
| Both – Green | 82.8% | 4.8% | 12.3% |
One ecological consideration that may be relevant to the present color similarity effects for the region-based conditions (i.e., region-only and texture-and-region) is the shading and highlighting patterns that are often found near extremal edges (Palmer and Ghose, 2008). Extremal edges are depth edges that arise when a curved surface occludes itself, such as the edge of a cylinder, when it is viewed against a farther background surface. Such gradual changes in surface orientation typically produce a gradual luminance gradient with approximately constant hue toward the extremal edge. Such conditions are approximated in the present displays by the step-edge change in brightness between the colored edge and the same-hued background of the attached region: the luminance changes, whereas the hue does not. Palmer and Ghose (2008) recently used general viewpoint considerations to argue that extremal edges are more likely to be closer to the observer than the region on the opposite side and predicted depth and figural effects due to such luminance gradients. Their results strongly confirmed this prediction, and further studies showed that it is more powerful than classical figural cues (e.g., size, convexity, familiarity, and surroundedness) in governing perceived depth across the edge (Ghose & Palmer, in preparation). The ecological significance of the present color similarity effects may thus result from such situations. Analogous effects might also occur when the edge is lighter than the background color of the similar region, for this occurs when the light source on the same side as the extremal edge produces a highlight there. Testing this prediction must await further experimental investigation.
It is a good deal less clear why the color similarity between texture elements and a shared edge should matter from an ecological standpoint, however. Further, we note that the texture-alone effect was slightly greater than the region-alone effect. It is possible that this difference in effect size is due to the greater similarity of the colors in the texture-alone condition (i.e., identity in both hue and luminance) than in the region-alone condition (i.e., identity in hue but only moderate similarity in luminance). The existence of this difference may therefore provide some additional support for similarity grouping as a mediating mechanism for the depth and figural effects we have observed.
It is worth mentioning that edge region grouping by color similarity may explain the figural bias effect that occurs in the so-called watercolor illusion (Pinna, Brelstaff, & Spillmann, 2001). In this illusion, two regions are divided by a double line-edge border that is darker on one side and lighter and colored on the other. There are two important aspects of the illusion. One is that illusory color spreads throughout the region bounded by the lighter colored side of the edge. ERG does not explain this interesting spreading phenomenon. The other aspect, however, is that the region containing the illusory color is perceived as figure (as opposed to ground) and closer than the other side. This effect is consistent with ERG and the present findings, because the edge on that side has the same hue as the illusory color, thus producing a situation in which the edge should group with the side containing the illusory color and therefore should be seen as figural and closer. We have not yet explored this connection with the watercolor illusion systematically, however.
Experiment 4: Orientation Similarity
Another feature that can be shared by edges and texture elements is orientation. This fact suggests that edge-texture grouping by orientation similarity may also produce depth and figural effects: The edge should group with the side whose texture elements are more similar in orientation to the edge, and that side should be seen as closer and figural. If the central edge consists of alternating diagonal segments, for example, it should group with the region containing diagonal texture elements more strongly than one containing horizontal and vertical elements. According to the ERG hypothesis, then, the region with diagonal texture elements should appear closer and figural (Figure 4B). The opposite should occur if the central edge is composed of horizontal and vertical line segments. We also studied displays containing texture elements of a single orientation on each side (Figure 4A), expecting that the effects should be larger when both orientations of the edge segments were present in the texture. Ecological examples of figural/depth effects due to ERG based on orientation similarity are not terribly obvious. The texture of wood grain in boards and tree bark tends to be roughly parallel to their longer global edges, but the sort of systematic ecological data that one would like to see on edge-texture consistency in orientation is not available, at least to our knowledge.
Figure 4.
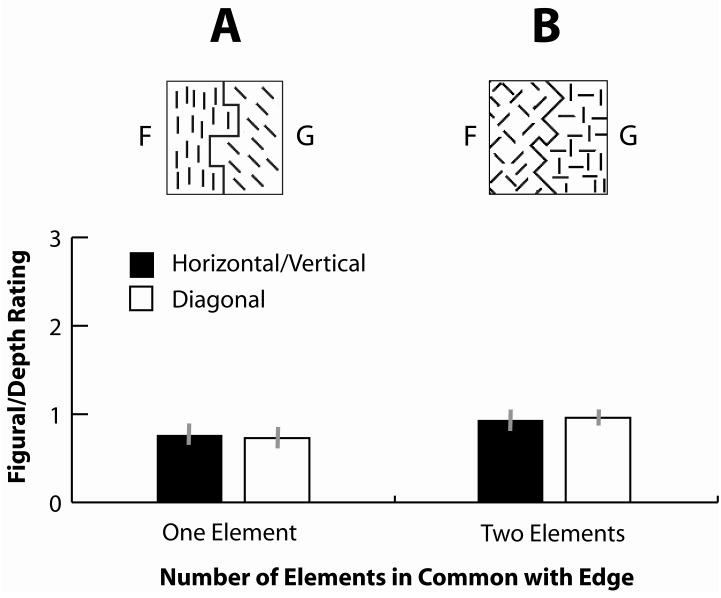
Figural/depth rating as a function of edge-texture orientation similarity in terms of the number of orientations in common between the edge and texture elements and the orientation of the elements on the grouped side. Positive ratings indicate results consistent with the ERG hypothesis. Example displays are shown for conditions in which (A) the grouped side has one orientation in common with the line edge and the edge contains horizontal and vertical segments and (B) the grouped side has two orientations in common with the line edge and the edge contains diagonal segments. The left side regions in the two examples are predicted to be figural by the ERG hypothesis. Error bars represent standard errors of the mean.
Methods
Ten male and fifteen female participants were shown 10 replications of eight conditions in a 2 × 2 × 2 within-subjects design, defined by edge orientation (horizontal-and-vertical or left-and-right diagonal), number of textural orientations (one/two), and grouped side (left/right). The central edge consisted of either horizontal and vertical line segments or left-diagonal and right-diagonal line segments that were black and 0.15° wide (see Figure 4). The textural orientations were either horizontal or vertical alone (one textural orientation), right diagonal or left diagonal alone (one textural orientation), both horizontal and vertical (two textural orientations), or both diagonal left and diagonal right (two textural orientations). Each region was randomly covered with black texture elements that were 0.15° thick and 0.60° long.
Results and Discussion
Figure 4 shows average figural/depth ratings as a function of texture orientation on the grouped side and the number of textural orientations in common with the grouped edge. Regions grouped with the edge by textural orientation similarity were clearly biased toward being seen as closer and figural, F(1,24) = 148.03, p < 0.0001, η2 = 0.85. Regions with both textural orientations in common with the edge were also rated reliably higher than those with only one component in common, F(1,24) = 5.143, p < 0.03, η2 = 0.145, as expected from similarity considerations. There was no difference between horizontal-vertical and diagonal edge conditions, F(1,24) = 0.014, p < 0.9, η2 = 0.001, or any significant interactions, F(1,24) = 0.051, p < 0.82, η2 = 0.002. The figure-ground judgment data are shown in Table 4. Mirroring the figure-ground ratings, participants were significantly more likely to choose the grouped side than the ungrouped side overall, F(1,24) = 256.4, p < 0.0001, η2 = 0.914, and there was no difference between conditions having horizontal/vertical elements and diagonal elements on the grouped side, F(1,24) = 0.238, p < 0.636, η2 = 0.04. However, unlike the results of the figure-ground ratings data, we found no significant difference between the one element and two element similarity conditions for the figure-ground judgments, F(1,24) = 0.260, p < 0.12, η2 = 0.050. This suggests that the modulation of the figure-ground ratings due to the different levels of orientational similarity were likely related to differences in confidence and/or strength rather than differences in figure-ground assignment.
Table 4. Orientation Similarity: Average percentage of trials on which each judgment was made.
| # Elements in Common and Orientation of Grouped Elements | Grouped side judged figural | Neutral Judgments | Non-grouped side judged figural |
|---|---|---|---|
| One – Horizontal/Vertical | 60.0% | 19.8% | 20.2% |
| One – Diagonal | 58.3% | 19.5% | 22.2% |
| Two – Horizontal/Vertical | 61.5% | 17.3% | 21.2% |
| Two – Diagonal | 64.0% | 20.7% | 15.3% |
Experiment 5: Proximity
Another well-known grouping principle that could produce ERG is proximity (similarity of position). If the texture elements on one side are nearer the edge than those on the other side, the ERG hypothesis predicts that the more proximal texture should appear to lie on the closer, figural side. Yonas et al. (1987) reported a proximity effect in their moving texture experiments, but they did not interpret it in terms of grouping and did not investigate whether any corresponding effects occurred with static textures such as the ones we use here.
Methods
Fourteen male and eleven female participants were shown ten replications of six conditions in a 3 × 2 within-subjects design defined by edge type (line-edge as shown in Figure 5B, contrast-edge whose grouped side was white, and contrast-edge whose grouped side was black as shown in Figure 5A), and grouped side (left/right).
Figure 5.
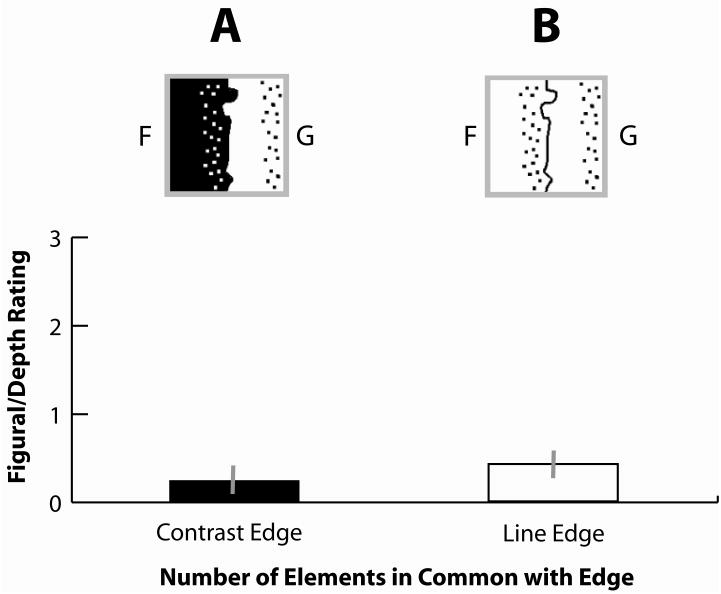
Figural/depth rating as a function of edge-texture proximity for two types of edges: contrast edges and line edges. Positive ratings indicate results consistent with the ERG hypothesis. Example displays are shown for the conditions with (A) a contrast edge (grouped left by proximity) and (B) a line edge (grouped left by proximity). The left side of each display would be predicted to be figural by the ERG hypothesis. Error bars represent standard errors of the mean.
Results and Discussion
Figure 5 shows average figural/depth ratings for line-edge and contrast edge conditions. Although the effects of proximity were not as strong as those of other factors reported above, regions whose texture elements were closer were given average figural/depth ratings that were reliably greater than zero, F(1,24) = 5.74, p < 0.025, η2 = 0.19, indicating an effect of edge-region grouping by proximity. No other main effects or interactions were present. Table 5 shows the average percentage of trials in which the grouped side, non-grouped side, and neutral judgments were made. The grouped side was chosen as figural reliably more often than the non-grouped side in both the contrast edge, F(1,23) = 5.63, p < 0.023, η2 = 0.20, and line edge conditions, F(1,23) = 9.21, p < 0.006, η2 = 0.26. Unlike in the ratings results, the grouped side was significantly more likely to be chosen as figural in the contrast edge condition than in the line edge condition, F(1,23) = 6.45, p < 0.018, η2 = 0.22.
Table 5. Proximity: Average percentage of trials on which each judgment was made.
| Type of Edge | Grouped side judged figural | Neutral Judgments | Non-grouped side judged figural |
|---|---|---|---|
| Contrast Edge | 51.5% | 7.7% | 40.8% |
| Line Edge | 37.8% | 49.2% | 12.9% |
There were significantly more neutral responses in the line edge condition than in the contrast edge condition, F(1,23) = 32.52, p < 0.0001, η2 = 0.59. It is possible that this difference reflects the difference in ecological validity between the two kinds of edges: contrast edges are ubiquitous in natural images, whereas line edges are typically found only in drawings and other human artifacts. We note that the displays in Experiments 3 (on color similarity) and 4 (on orientation similarity) also employed line edges without producing such large numbers of neutral responses, but the present experiment is the only one in which contrast and line edges were judged/rated by the same participants under otherwise similar conditions. It is therefore possible that the large number of neutral responses we find here signifies a real difference that was not revealed in previous experiments due to methodological considerations. Another possibility is that the line-edge condition in this experiment promotes grouping of the two regions into a single, divided region in which neither side is more figural than the other (i.e., a mosaic interpretation). The idea is that because both sides contain the same regional color and the same colored texture elements, they are effectively grouped together rather than split apart, leading to a large number of neutral responses. In the contrast-edge condition, however, the different background and textural colors oppose grouping the two regions, leading to segmentation and figure-ground competition between them. This does not occur with the line-edge conditions in Experiments 3 and 4 because different regional and/or textural colors in Experiment 3 and different textural orientations in Experiment 4 similarly oppose grouping the two sides in those conditions, which then leads to segmentation and figure-ground competition, with relatively fewer neutral responses.
It is perhaps somewhat surprising that proximity has such a small effect, given its well known influence in grouping demonstrations in which all other factors are equalized. One possibility is that grouping by proximity is not actually as strong a cue to grouping as perceptual psychologists have supposed, at least relative to other grouping factors. Along these lines, a recent study of grouping (i.e., region segmentation) in computer vision has shown that the distance between two small neighborhoods in an image provides no additional benefit in predicting human segmentation performance after similarities of color and texture have been taken into account (Fowlkes, Martin & Malik, 2003) Another possible explanation for the weakness of edge-texture proximity effects is that the correlation between proximity and depth differences is not ecologically robust. The primary ecological situation that we can think of in which proximity might be relevant occurs when a curved textured surface (e.g., a uniformly textured cylinder) projects a self-occluding extremal edge3 against a flat textured background, because the texture elements will be nearer the edge on the closer, curved side (Palmer & Ghose, 2008). The present displays do not simulate this situation precisely because the texture elements were simply displaced by a constant distance rather than changing in density, but self-occluded curved surfaces that contain texture do suggest a possible ecological basis for ERG via proximity. Another possible explanation, of course, is that proximity grouping between an elongated edge and small texture elements is weak because of the difference in shape between the elements involved. Proximity might be considerably stronger if all of the elements in question had similar shapes. We investigate the relative strength of proximity in perceived grouping within our present displays directly in Experiment 7.
Experiment 6: Flicker Synchrony
Previous research by Wong and Weisstein (1987) demonstrated that a flickering region tends to be perceived as ground rather than figure when the other region does not flicker. This finding has always puzzled us somewhat, because the onsets and offsets of the flickering texture should draw attention to that region (Yantis & Jonides, 1996), and exogenous attention to the region should cause it to be seen as figural (Vecera et al., 2004). The ERG hypothesis provides a plausible alternative explanation, however: If the texture elements flicker on just one side in the presence of a non-flickering edge (as was the case in the majority of Wong and Weisstein's experiments), the non-flickering texture should be grouped with the non-flickering edge, causing that side to be seen as closer and figural, thus relegating the flickering side to ground status. The ERG hypothesis thus predicts that Wong and Weinstein's result should reverse if the edge flickers synchronously with the flickering texture, because the edge should now be grouped with the flickering side, making that side appear closer and figural.
Flicker may also be important for distinguishing between explanations based on grouping versus strict ecological image statistics. Elements that flicker or otherwise change synchronously are strongly grouped (Palmer & Levitin, 1998; Lee & Blake, 1999; Sekuler & Bennett, 2001). According to the ERG hypothesis, synchronously flickering the edge and the texture on one side should cause them to be grouped and therefore to be seen as closer and figural. However, there are few natural situations we can think of in which an edge and texture on one side flicker differently from texture on the other side as a result of depth relations between the two surfaces. It can be produced under special circumstances using stroboscopic illumination on one surface and constant illumination on the other, but such conditions seem ecologically infrequent. If depth and figure-ground effects due to flicker synchrony are obtained, an account in terms of grouping seems more plausible than one directly based on ecological image statistics.
Methods
Fifteen male and fifteen female participants were shown ten replications of 12 conditions in a 3 × 2 × 2 within-subjects design. The first factor was edge-flicker condition (see Figure 6). In the static edge condition (Figure 6A), just the texture on one side flickered, as in Wong and Weisstein's (1987) displays. In the flickering edge condition (Figure 6B), the edge flickered synchronously with the texture on the flickering side and thus should group with it. In the asynchronous flickering-edge condition (Figure 6C), the edge flickered 180° out of phase with the flickering side. The other factors were grouped side (left/right) and flicker rate (6 Hz or 10 Hz). Animated examples of these displays are available in the Supplemental Materials. Each flickering display was presented for 1500 ms before responses were recorded.
Figure 6.
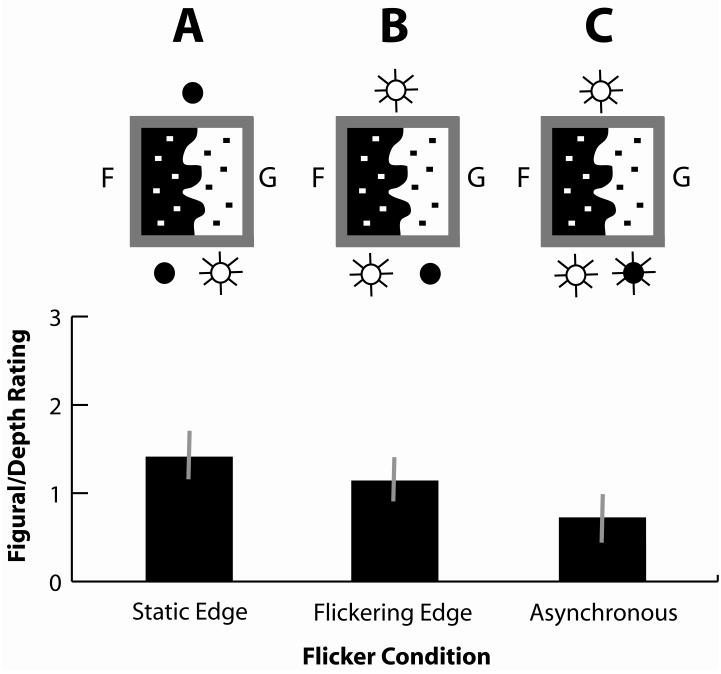
Figural/depth rating as a function of flicker synchrony for three conditions: (A) static edges (similar to Weisstein and Wong's conditions), (B) flickering edges, and (C) asynchronously flickering edges. Symbols above the figures represent edge flicker conditions, and symbols below them represent textural flicker conditions. Filled circles represent static, unflickering elements, open circles with flares represent flickering elements, and filled circles with flares represent elements that flicker in counterphase to the elements with open circles and flares. Positive ratings indicate results consistent with the ERG hypothesis. Error bars represent standard errors of the mean.
Results and Discussion
Figure 6 shows mean figural/depth ratings for the edge-flicker conditions. As predicted by the ERG hypothesis, all average signed ratings are strongly positive, confirming that the side grouped with the edge via flicker tended to be seen as closer and figural, F(1,29) = 52.76, p < 0.0001, η2 = 0.64. No other factors or interactions produced significant effects.
The ratings were somewhat higher for the static-edge condition than the flickering-edge condition, a trend that is consistent with the possibility that a flickering texture itself tends to be seen as ground, as Wong and Weisstein (1986) suggested, but the difference is not statistically reliable in the present data, F(1,29) = 0.429, n.s. In any case, the trend for a flickering region to be seen as ground is negligible compared with the relational flicker effects that were predicted by the ERG hypothesis. The asynchronous flicker condition was rated significantly lower than the static edge condition, F(1,29) = 12.54, p < 0.001, η2 = 0.34. It was also rated lower than the flickering edge condition, but this difference did not reach statistical significance, F(1,29) = 2.52, n.s. We were surprised that the asynchronous flicker condition produced such a robust effect, given the lack of temporal coincidence of the events in these displays. Several ad hoc explanations seem reasonable. One is that the degree of similarity produced by flicker alone (without it being synchronous with the flickering of the edge) is sufficient to cause some grouping of the flickering edge and the flickering texture. Another possibility is that participants categorized the asynchronous displays as being like the flickering edge displays and therefore felt that they should give similar responses (i.e., that reflects a category-contingent demand characteristic.) Yet a third possibility, consistent with our own introspective experience on viewing the displays, is that asynchronous flicker often produced perception of apparent motion from the edge to the flickering texture, and this perceived motion may have itself caused a different motion-based sort of similarity grouping than we intended to study. Further research is needed to evaluate these possibilities, however.
Table 6 shows the results for the figure-ground judgments. In all three flicker conditions the grouped side was chosen as figural more often than the non-grouped side: static-edge, t(29) = 5.02, p < 0.0001, flickering-edge, t(29) = 5.00, p < 0.0001, and asynchronous, t(29) = 3.91, p < 0.001. The figure-ground judgments largely mirrored the results of the figure-ground ratings. The grouped side was chosen more often in the static edge condition than in the flickering edge condition but this difference was not significant, F(1,29) = 0.913, n.s. The grouped side was chosen as figural less often in the asynchronous condition than in both the static edge, F (1,29) = 4.95, p < 0.03, η2 = 0.15, and the flickering edge, F(1,29) = 18.75, p < 0.001, η2 = 0.39, conditions. Notice that the difference between the asynchronous condition and the flickering edge condition was significant in the judgment data but not in the figure-ground ratings data. Interestingly, the asynchronous condition also differed from the other two conditions by having a higher proportion of neutral judgments (static vs asynchronous, F(1,29) = 23.66, p < 0.0001, η2 = 0.45, and flickering vs. asynchronous, F(1,29) = 24.65, p < 0.0001, η2 = 0.46). This suggests that subjects were less likely to perceive any type of figure-ground organization in the asynchronous condition.
Table 6. Flicker Synchrony: Average percentage of trials on which each judgment was made.
| Focus of Grouped Side | Grouped side judged figural | Neutral Judgments | Non-grouped side judged figural |
|---|---|---|---|
| Static Edge | 71.7% | 9.1% | 19.2% |
| Flickering Edge | 63.9% | 17.0% | 19.0% |
| Asynchronous | 52.3% | 28.8% | 18.8% |
The present findings indicate that grouping by flicker synchrony also produces figural/depth effects, as predicted by the ERG hypothesis. They replicate Wong and Weisstein's (1987) finding that flickering regions are perceived as a farther ground in the presence of a non-flickering edge, but they also support a radical reinterpretation in terms of ERG, because the opposite result is obtained when the edge flickers synchronously with one side.
Experiment 7: Grouping Ratings versus Figural/Depth Ratings
The results of Experiments 1-6 provide clear and compelling evidence that the six qualitatively different grouping principles we studied influence figural status and perceived depth as predicted by the ERG hypothesis. Several important issues remain, however. One is the question of whether the edges actually are grouped differentially with the side predicted by the grouping principles. We have assumed that they should be simply because of previous findings that involved grouping among similarly shaped elements, but no prior research has actually shown differential grouping between texture elements and edges due to similarity. This generalization needs to be tested directly.
In the present experiment we studied perceived grouping between a shared edge and adjacent regions by collecting explicit ratings of edge-region grouping strength for the same displays we used in the previous six experiments. Participants were asked to indicate whether the edge appeared to group with the left side, right side, or neither side, and to rate the strength of that perception. No mention whatsoever was made in the instructions to these participants about either figure-ground organization or depth. These measurements were intended to determine whether the sort of edge-texture grouping we assumed actually does occur in these displays.
Second, we found substantial differences between the strength of the figural/depth effects we measured for different grouping factors in Experiments 1-6. To take the most extreme example, ERG based on common fate produced very high figural/depth ratings (between +2 and +3 on a scale from -3 to +3) and figure-ground judgments, whereas ERG based on proximity produced much weaker effects (about +0.5 on the same scale). Because these differences arose from different groups of participants viewing different sets of displays, it is unclear whether comparisons across experiments accurately reflect the strength of the different factors or whether they are artifacts driven by contextual differences that influenced how the participants in the different experiments used the rating scale. The present experiment investigates this issue by having a single group of participants make figural/depth ratings for the entire range of displays. If the present measures of figural/depth effects replicate these differences and correlate strongly with those obtained in the previous experiments, then there is good reason to believe that they are real.
The third issue is perhaps the most interesting and important: Why might different grouping factors produce differences in the strength of ERG effects – assuming they are real – in the first place? One possible explanation appeals directly to ecological statistics: Perhaps the strength of the figural/depth effect for a given grouping factor is a function of how tightly that factor is coupled with the ecological statistics of depth relations for adjacent regions in projected images of natural scenes. Given our results, for example, a strictly ecological account implies that common motion of edges and texture elements should be a much better predictor of depth in natural images than edge-texture proximity. Although we do not have relevant ecological data to test this hypothesis, it makes intuitive sense, at least for these two grouping principles. For some of the other cases, however, the intuitions are far less compelling. Perhaps most problematic is the ecological status of the flicker synchrony effects obtained in Experiment 6. Not only do these displays use line-edges, which are seldom encountered in the natural world, but there seem to be few ecological conditions in which edges, textures, or edges-and-textures appear and disappear simultaneously as they do in these displays. Some readers have suggested that it occurs when viewing surfaces through a picket fence as one moves past it, but the surfaces behind the fence do not appear and disappear: They are sequentially occluded and disoccluded by the slats in the manner described by Gibson et al., (1969) as accretion and deletion of texture. Such events are more consistent with the present analysis of edge region grouping by common fate (Experiment 1) than by flicker synchrony (Experiment 6). A closer approximation would be turning a light on and off in a near or far room at night, so that one wall is illuminated intermittently while the other is illuminated constantly. This would simultaneously, but selectively, cause the appearance and disappearance of texture in either the closer or farther wall, but because the depth edge between the two surfaces is constantly visible in both cases, it does not produce the same visual events as those in our displays. We acknowledge that such arguments are not definitive in the absence of actual ecological data and proper statistical analyses, but we find them sufficiently compelling to cast doubt on the hypothesis that ecological depth structure can account for all of the effects we report above.
Another possible explanation of the differences we measured is a straightforward corollary of the ERG hypothesis itself: Differences in the strength of figural/depth effects should arise naturally from corresponding differences in the strength of the grouping effects that produce them. That is, if the perception of figural status and depth based on ERG is actually mediated by perceptual grouping processes, then the strength of figural/depth ratings should covary with the strength of the corresponding grouping effects. For example, if common fate between edges and textures causes them to group more strongly than proximity between edges and textures does, then the ERG hypothesis predicts that figural/depth ratings for common fate will be stronger than for proximity. In the present experiment we test this hypothesis by having the same set of participants make both grouping and figural/depth ratings for all of the displays from Experiments 1-6. To avoid having the grouping ratings contaminated by the figural/depth ratings, all of the grouping ratings were made first. If grouping strength mediates the effectiveness of figural/depth effects, then the correlation between the grouping ratings and the figural/depth ratings should be high. We can also determine whether having participants make the grouping ratings first (in the present experiment) influenced their subsequent figural/depth ratings by comparing them with the corresponding ratings made by uncontaminated participants in Experiments 1-6. If there is no contamination, then the two sets of figural/depth ratings should be strongly correlated.
Methods
Participants
The participants were 11 students at the University of California, Berkeley. The students participated for course credit.
Design and Procedure
The displays used in this experiment were exactly the same as those used in the previous six experiments. All conditions were randomly ordered within each block. The subject saw five repeated measures for each condition but each repeated measure had a differently shaped edge. The displays were shown for the same duration as in Experiments 1-6.
Each participant completed two phases, the first of which required explicit grouping ratings and the second of which required figural/depth ratings as in the previous experiments. During the first phase the participant was instructed to decide whether the edge “grouped” or “went with” the left, right, or neither region and then to rate the strength or confidence of that grouping judgment. These two responses were combined as in the previous experiments into a single grouping rating on a 7-point scale: -3 to +3, with 0 indicating neutral grouping. Positive values indicated a judgment consistent with the grouping principle while negative values indicated an inconsistent judgment. No mention of depth or figure-ground organization was made during this first phase of the experiment.
In the second phase, the participant was shown the same displays as in phase 1 in a different random order, but they were now instructed to make figural/depth judgments and strength/confidence ratings instead of grouping judgments. These responses were collected and combined exactly as in Experiments 1-6. The experimenter clearly stated that the judgments in phase 2 did not need to be related to those in phase 1. Each phase began with 10 practice trials and contained two breaks. The conditions of the practice trials were randomly selected from the full set of conditions.
Results and Discussion
Ratings were averaged across subjects for each condition separately in the grouping and the figural/depth phases of the experiment. For the initial analyses, the data were also averaged across subconditions within each grouping principle – e.g., the static edge, moving edge, and opposite motion types in the common fate displays – to yield a single measure of grouping strength and a single measure of figural/depth strength for each of the six qualitatively different grouping principles used in Experiments 1-6: common fate, blur similarity, color similarity, orientation similarity, proximity, and flicker synchrony, respectively. For reasons to be discussed shortly, we believe that these averaged ratings are the best and purest test of the ERG-based prediction that there should be a strong correlation between the strength of perceived grouping and the strength of perceived figural/depth across the six grouping factors we studied in Experiments 1-6.
The effectiveness of the grouping principles in influencing the explicit edge-region grouping ratings was evident in the fact that all six principles produced positive grouping ratings, F(1,10) = 26.60, p < 0.001, η2 = 0.73. Moreover, there were significant variations due to the different grouping principles as indicated by an overall one-way within-subjects ANOVA (with the 6 different grouping factors as the 6 levels of the factor), F(5,10) = 7.64, p < 0.001, η2 = 0.43. Paired comparisons indicated that grouping ratings in the common fate condition were stronger than those in all of the other conditions (Flicker Synchrony, t(10) = 2.63, p < 0.03; Blur Similarity, t(10) = 3.56, p < 0.005; Proximity, t(10) = 3.61, p < 0.005; Orientation Similarity, t(10) = 3.07, p < 0.015) except the color similarity grouping principle, t(10) = 0.712, n.s. The color similarity grouping principle, in turn, was significantly stronger than all of the other grouping principles (Flicker Synchrony, t(10) = 2.48, p < 0.032; Blur Similarity, t(10) = 5.00, p < 0.001; Proximity, t(10) = 3.43, p < 0.006; Orientation Similarity, t(10) = 3.49, p < 0.006) except for common fate. In addition, the flicker synchrony principle was stronger than the proximity principle, t(10) = 2.47, p < 0.034, but none of the other differences were significant in the corresponding paired comparisons. These results clearly show that these grouping factors affected the grouping of edges and texture elements, as we assumed they would.
We also examined the effectiveness of the grouping principles in influencing the figural/depth ratings. Again, all six principles produced positive figural/depth ratings, F(1,10) = 65.06, p < 0.001, η2 = 0.87, and there were significant variations due to the different grouping principles as indicated by an overall ANOVA, F(1,10) = 13.89, p < 0.001, η2 = 0.58. Paired comparisons indicated that figural/depth ratings in the common fate condition were stronger than those in all of the other conditions (Flicker Synchrony, t(10) = 3.92, p < 0.003; Color Similarity, t(10) = 2.56, p < 0.028; Blur Similarity, t(10) = 6.38, p < 0.001; Proximity, t(10) = 10.03, p < 0.001; Orientation Similarity, t(10) = 5.98, p < 0.001). Figural/depth ratings for the color similarity grouping principle were significantly stronger than all of the other grouping principles (Blur Similarity, t(10) = 3.64, p < 0.005; Proximity, t(10) = 3.45, p < 0.006; Orientation Similarity, t(10) = 2.47, p < 0.034) except for flicker synchrony, t(10) = 0.74, n.s., and common fate which was stronger than color as described above. The flicker synchrony principle had a stronger effect on figural/depth ratings than the proximity grouping principle, t(10) = 2.97, p < 0.014. The orientation grouping principle had a stronger figural/depth effect than the proximity grouping principle, t(10) = 2.67, p < 0.023. None of the other comparisons between grouping principles were significant. These results clearly show that the grouping factors also produce reliable differences in figural/depth judgments, consistent with our findings in Experiments 1-6, but now using a within-participant design.
We examined the ERG-predicted covariation between grouping and figural/depth perception first by comparing the average grouping rating for each grouping principle in Experiment 7 with the corresponding average figural/depth rating in Experiment 7, as plotted in Figure 7A. The correlation between these two measures was strong and significant, r = 0.95, p < 0.003. Next, to determine whether the grouping ratings in phase 1 might have influenced the figural/depth ratings in phase 2, we compared the figural/depth ratings from the present experiment with the same ratings obtained in Experiments 1-6. As shown in Figure 7B, the correlation between these two sets of ratings was also strong and reliable, r = 0.94, p < 0.005. Because each principle was studied individually in Experiments 1-6 using different participants, this high correlation shows that the differences noted in the strength of the effects in those experiments were, in fact, made on the same effective rating scale. Finally, to eliminate any possibility that prior grouping ratings in Experiment 7 might have contaminated the figural/depth ratings, we determined the correlation between the grouping ratings in Experiment 7 (which were uncontaminated by any figural/depth ratings because they were collected before either depth or figure-ground were mentioned) and the figural/depth ratings in Experiments 1-6 (which were uncontaminated by any grouping ratings because these participants never made any grouping ratings) and still found a strong and significant relationship, r = 0.92, p < 0.01.
Figure 7.
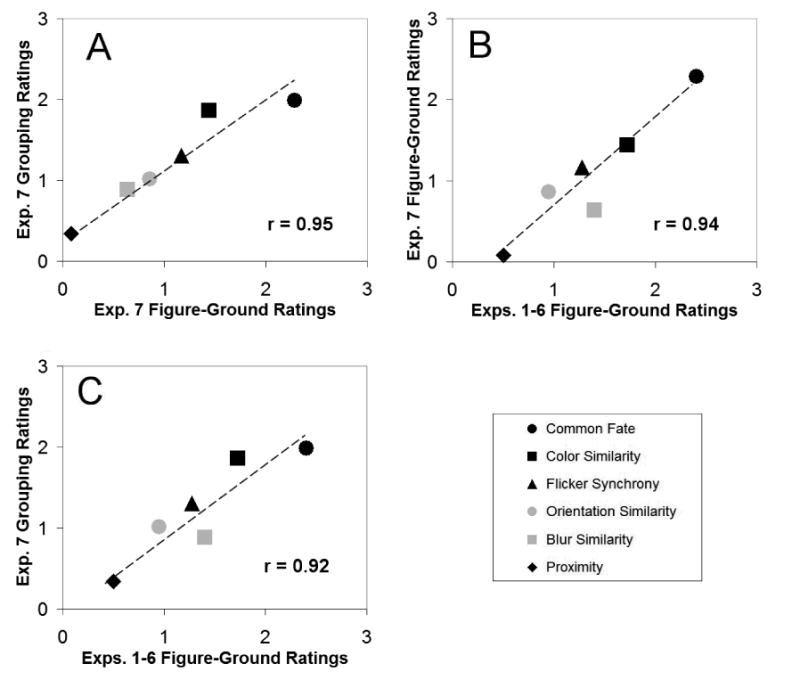
Results of Experiment 7 averaged over the subconditions of each experiment. (A) Figural/depth ratings from Experiment 7 are plotted against grouping ratings by the same participants in the same conditions. (B) Figural/depth ratings from Experiments 1-6 are plotted against figural/depth ratings from Experiments 1-6 to demonstrate the reliability of the figure-ground ratings across groups of participants. (C). Figural/depth ratings from Experiments 1-6 are plotted against grouping ratings from Experiment 7.
In response to requests by other readers, we also computed and report below the same correlations just described, but including all the major subconditions from Experiments 1-6 (see Table 7). We preface this discussion by noting an important caveat: These subconditions include variation that is not predicted by or relevant to the ERG hypothesis, because they include variables that do not concern the similarity between the edge and adjacent regions. That is, the ERG hypothesis itself only predicts high correlations between grouping and figural/depth ratings due to variables that concern the similarity relation between the edge and adjacent regions (e.g., the relative motion, blur, or color of the edge with respect to regional motion, blur, or color), whereas the subconditions within each experiment include differences due to non-relational variables (e.g., whether the edge and grouped region are both moving or both stationary, whether they are both sharp or both blurred, and whether they are both red or both green). For instance, in the color experiment, red is generally perceived as closer than green, either because of chromostereopsis or attentional effects, and in the blur experiment, sharp elements are generally perceived as closer than blurred elements because of atmospheric perspective. However, we have no reason to believe that red things are more similar to each other than are green things or that sharp things are more similar to each other than are burred things. Thus, whereas color and blur should affect FG ratings for the stated reasons that are unrelated to ERG, the ERG hypothesis does not predict corresponding differences in grouping ratings. Such considerations lead us to expect lower correlations between the two grouping and figural/depth ratings when the subconditions within experiments were included than when they were eliminated by averaging. For the same reasons, we argue that examining correlations across subconditions within a single grouping factor are inappropriate for evaluating the validity ERG hypothesis.
Table 7. Average figure-ground and grouping ratings for Experiments 1-6 and Experiment 7 for all grouping factors and major subconditions.
| Grouping Factor | Grouping Rating Experiment 7 | Figure-Ground Rating Experiment 7 | Figure-Ground Rating Experiments 1-6 |
|---|---|---|---|
| Common Fate Grouped Side Moving | 2.23 | 2.65 | 2.78 |
| Common Fate Opposite Motion | 2.17 | 2.45 | 2.07 |
| Common Fate Grouped Side Static | 1.55 | 1.74 | 2.36 |
| Flicker – Grouped Side Flickers | 1.51 | 0.60 | 1.14 |
| Flicker – Grouped Side Static | 1.10 | 1.72 | 1.41 |
| Flicker – Grouped Side Asynchronous | 1.48 | 0.19 | 0.72 |
| Color Similarity – Texture – Red | 2.05 | 1.75 | 1.89 |
| Color Similarity – Texture – Green | 2.13 | 1.76 | 1.19 |
| Color Similarity – Region – Red | 1.89 | 1.50 | 1.58 |
| Color Similarity – Region – Green | 1.66 | 1.36 | 1.08 |
| Color Similarity – Both – Red | 1.93 | 1.51 | 2.23 |
| Color Similarity – Both – Green | 1.31 | 0.73 | 1.72 |
| Blur Similarity – Grouped Blurry | 0.72 | 0.29 | 1.00 |
| Blur Similarity – Grouped Sharp | 1.03 | 0.97 | 1.72 |
| Proximity – Contrast Edge | 0.32 | 0.03 | 0.24 |
| Proximity – Line Edge | 0.35 | 0.12 | 0.42 |
| Orientation – One Element | 0.76 | 0.56 | 0.74 |
| Orientation – Two Elements | 1.26 | 1.14 | 0.93 |
The correlation between figural/depth ratings and grouping ratings including all of the major subconditions in Experiment 7 was significant, r = 0.82, p < 0.0001. This correlation was maintained when collected in different groups of participants as shown by the significant correlation between figural/depth ratings from subconditions of Experiments 1-6 and the grouping ratings from subconditions of Experiment 7, r = 0.73, p < 0.001. The figural/depth ratings from subconditions of Experiment 7 and those from subconditions of Experiments 1-6 were also significantly correlated, r = 0.80, p < 0.0001, again demonstrating the reliability for various subconditions across different groups of participants and different testing contexts (i.e., limited display variations in Experiments 1-6 and diverse display variations in Experiment 7).
The correlation coefficient between Experiment 7 figural ratings and Experiment 7 grouping ratings was lower when the subconditions were separated versus when they were averaged, but the difference was not reliable, z = 1.07, p < 0.29. The same was true for separated versus averaged correlations between Experiment 7 grouping ratings and Experiments 1-6 figural ratings, z = 1.04, p < 0.30, and those between Experiment 7 figural ratings and Experiments 1-6 figure ratings, z = 1.01, p < 0.32.
To further examine the effects across subconditions, we computed the interaction between task and subcondition variables for each grouping factor separately. This interaction reflects whether the effects of subcondition variables within a grouping principle (e.g., moving vs. static regions for common fate grouping or red vs. green regions for color grouping) differed reliably between different tasks or groups of participants (for instance, between grouping and figure-ground tasks in Experiment 7). First, we compared results from grouping and figure-ground tasks within Experiment 7, which are within-subjects comparisons. We found no significant interactions between task and subcondition variables for any of the grouping principles (Common Fate, F(2, 20) = 0.113, p < 0.893, η2 = 0.011; Flicker, F(2,20) = 2.209, p < 0.136, η2 = 0.18; Color, F(5,50) = 0.305, p < 0.908, η2 = 0.03; Blur, F(1,10) = 0.449, p < 0.518, η2 = 0.04; Proximity, F(1,10) = 0.258, p < 0.622, η2 = 0.02; and Orientation, F(1,10) = 0.121, p < 0.735, η2 = 0.01). This indicates that the pattern of grouping ratings across subconditions did not differ significantly from the pattern of figure-ground ratings across subconditions within each grouping principle.
Next, we examined the subcondition interactions between figure-ground ratings in Experiment 7 and those in Experiments 1-6 for each principle, which are between-subjects comparisons. We found significant interactions for the common fate, flicker, and blur grouping principles: F(2,48) = 4.216, p < 0.02, η2 = 0.15; F(5,120) = 5.937, p < 0.0001, η2 = 0.19; and F(1,22) = 4.164, p < 0.05, η2 = 0.16, respectively. These interactions could have arisen in several ways. Experiment 7 and Experiments 1-6 involved different sets of participants who may have perceived some of the displays differently. Experiment 7 ratings were done in the context of all of the grouping principles whereas Experiments 1-6 were done with each grouping principle presented separately to a different group of participants. This could have caused differences in the effective rating scale used. For instance, in the figural/depth judgments, the red ratings were higher than the green ratings to a greater extent in Experiment 3 than in Experiment 7, F(1, 24) = 12.46, p < 0.002, η2 = 0.55. This difference might be due to a compression effect arising in Experiment 7 when many different factors had to be rated on the same scale. The other significant difference we found for color was a cross-over interaction between Experiments 3 and 7 that cannot be explained by compression effects: whereas the figural/depth ratings in Experiment 3 were highest in the both-grouped condition and lowest in the region-only condition, those in Experiment 7 showed the opposite pattern, with both-grouped ratings being lowest and region-only ratings being highest, F(2, 48) = 7.832, p < 0.001, η2 = 0.41. We have no coherent explanation for this difference.
Finally, we evaluated the subconditions interaction between figure-ground ratings in Experiments 1-6 and the grouping ratings in Experiment 7 for each grouping principle separately, which are between-subjects comparisons. This interaction was significant only for the Color grouping principle, F(5,120) = 5.52, p < 0.0001, η2 = 0.187, which indicates that the pattern of results across color subconditions was different in the Experiment 7 grouping ratings than in the figure-ground ratings from Experiments 1-6. This could be due to differences in participants, use of the rating scale (as described above for the interaction for figure-ground ratings in Experiment 7 with those in Experiments 1-6), or other unknown factors.
Despite the few differences described above, the grouping and figural/depth ratings are remarkably similar even when the data were not averaged across subconditions (e.g., the main effect indicating that red elements are perceived to be closer than green ones). This is somewhat surprising if similarity between the edge and regions was the only factor at work because so many other factors varied in the subconditions across the grouping factors. One logical possibility is that the correlations are high simply because participants were unable to differentiate the grouping task and the figural/depth task and therefore treated them as if they were the same.4 Let us call this the task confusion hypothesis. (If true, it seems more likely that participants thought “grouping” actually referred to perceived depth than vice versa because it is hard to imagine people being confused about what depth means, but either or both are logically possible.) We find the task confusion hypothesis unlikely for several reasons. First, participants did not express confusion over the instructions when they were initially given. Second, nobody ever remarked that the second task was the same as the first when the second was explained to them or asked how the second task differed from the first. Third, no one expressed difficulty in adequately summarizing the tasks they had performed during the post-experimental debriefing session. Finally, participants were always given the grouping task before the figure-ground task and thus should not have been influenced toward making figure-ground judgments by previous experience when instructed to give grouping judgments.
Even if the task confusion hypothesis were true, however, it is extremely unlikely to undermine the validity of the ERG hypothesis. The unavoidable fact is that something in our displays gave rise to the measured bias in the figural/depth ratings, and the grouping factors we manipulated are the only viable candidates, because the displays included no known cues to figure-ground organization, and all factors other than edge-region relationships were counterbalanced in all cases. Thus, even if the grouping ratings in Experiment 7 were actually based on perceptions of figural/depth rather than grouping, the ERG hypothesis stands as the only explanation for the variations we observed in the figural/depth ratings. The sole circumstance in which the ERG hypothesis could fail to be supported by the results of the seven experiments just described would be if participants were unable to make figural/depth judgments for the current displays and always made grouping/belongingness ratings instead. In this case we would only have demonstrated that grouping factors affect grouping ratings, with no implications for the former's effects on figure-ground organization. If this were true, however, the entire literature on both perceived depth and figure-ground organization would be thrown into question. Not only would conclusions based on subjective ratings about which region looks closer and figural be reinterpretable as actually reflecting perceived grouping instead, but also those based on indirect “objective” measures such as short-term visual matching (Driver & Baylis, 1996), since the latter depend on the former for their validity. And this problem would arise not only for the present ERG factors, but for depth factors as universally accepted as relative motion and binocular disparity and for figural factors as well established as surroundedness and smaller size. We do not believe this to be a serious possibility.
A second, and we believe more plausible, explanation for the strong correlations between grouping and figural/depth ratings is the inverse-ERG hypothesis. As we noted in the introduction, the causal relations between ERG and figure-ground organization are actually bidirectional: the differential grouping of an edge with one of its regions can causally affect figural/depth perception (i.e., the ERG hypothesis), and figural/depth perception can causally affect the differential grouping of an edge with one of its attached regions (i.e., the inverse-ERG hypothesis5). Experiments 1-6 demonstrated the validity of the ERG hypothesis. The very definitions of edge assignment and of grouping imply the validity of the inverse-ERG hypothesis. The argument for the latter assertion is simply that once an edge is assigned to the figural region, that edge necessarily belongs to (i.e., is grouped with) that region. According to this bidirectional account, the high correlations between grouping and figural/depth ratings may be a reflection of the ERG relation, the inverse-ERG relation, or both.
We collected some further data to address this issue. The inverse-ERG hypothesis clearly implies that even non-ERG figural/depth factors should lead to high ratings of grouping strength for the figural side. We therefore presented a separate group of participants with displays containing the well-known, non-ERG figure-ground factors of familiarity, convexity, contrast, size, and contrast combined with convexity in addition to the six ERG factors based on similarity grouping studied in Experiment 7 and asked them to make ratings of the grouping/belongingness of the edge. The correlation between these ERG ratings and the corresponding ratings from the main part of Experiment 7 show that they replicated the previous pattern of results, r = 0.95, p < .0004. In addition, however, we found that participants reliably rated the edge to be grouped with the side containing the classic, non-ERG figural factors for each of the five cases (see Table 8), even though these displays contained no known grouping factors. We take this as evidence in support of the inverse-ERG hypothesis and the bidirectional account.
Table 8. Average grouping ratings (accompanied by relevant inferential statistics) for judgments of displays with non-ERG figure-ground factors and replications of the conditions in Experiment 7.
| Non-ERG Grouping Factor | Grouping Rating | Inferential Stats (rating's difference from 0) N = 12 |
|---|---|---|
| Convexity | 0.82 | t(1,11) = 9.60, p < 0.001 |
| Familiarity | 1.26 | t(1,11) = 11.2, p < 0.001 |
| Size | 0.63 | t(1,11) = 6.07, p < 0.001 |
| Contrast | 0.93 | t(1,11) = 12.44, p < 0.001 |
| Convexity + Contrast | 1.21 | t(1,11) = 4.83, p < 0.001 |
|
| ||
| ERG Grouping Factor | Grouping Rating | Inferential Stats (rating's difference from 0) N = 12 |
|
| ||
| Common Fate | 2.15 | t(1,11) = 11.89, p < 0.001 |
| Flicker Synchrony | 1.57 | t(1,11) = 6.29, p < 0.001 |
| Color Similarity | 1.77 | t(1,11) = 7.99, p < 0.001 |
| Blur Similarity | 0.70 | t(1,11) = 4.03, p < 0.002 |
| Proximity | 0.54 | t(1,11) = 3.44, p < 0.005 |
| Orientation Similarity | 0.80 | t(1,11) = 7.28, p < 0.001 |
Overall, the results of Experiment 7 show that the variability observed in the strength of the figural/depth ratings in the first six experiments was indeed real and that it may well be linked to the strength of the grouping ratings for the corresponding grouping factors in the same visual displays. Even if the grouping ratings were not “pure” in the sense of being a direct index of grouping strength but were derived indirectly from the strength of figural/depth perception, the effects we measured of ERG variables could only have arisen from manipulations of grouping factors in our displays. Figure-ground and grouping ratings within particular grouping principles and among subconditions were not always well-correlated (e.g. the color subconditions described above). However, these deviations from perfect correspondence have little bearing on the ERG hypothesis itself, because correlations for within-factor subconditions in the present experiments should not be used to evaluate it. These small deviations do raise some concern about the validity of the inverse ERG hypothesis, however, as anything that affects figure-ground ratings should cause a corresponding change in grouping ratings. This does appear to have been the case in at least some subconditions. A proper understanding of the inverse-ERG relation will require further study.
Before leaving this topic, it is important to note that our claim that the within-factor subconditions studied in Experiments 1-6 are not relevant to evaluating the ERG-hypothesis does not imply that all within-factor variables are likewise irrelevant. It is easy to generate within-factor conditions in which the strength of the grouping between edge and regions is systematically varied for a single factor by manipulating relative similarity, and such conditions should indeed produce corresponding variations in perceived figural/depth judgments. To take color as an example again, if the left region contains red texture elements and the right region contains blue ones, then varying the color of the edge quantitatively in equal steps between red and blue (via magentas, purples, and violets) should produce a corresponding shift in how strongly the edge groups with the two sides and therefore how strongly the more similar side is seen as closer and figural. Indeed, we have evidence for just such within-factor effects for both color and motion, which will be reported in a separate article in the near future.
Finally, we note that the correlations between grouping and figure-ground ratings show only that an explanation in which grouping plays a mediating role in these figural/depth effects is possible; it does not show that the ecological account in terms of statistical regularities is wrong. Both factors may well be at work. Indeed, it seems likely that the strength of the various grouping principles themselves is derived from their coupling with some sort of ecological statistics related to relative depth across an edge; see Fowlkes et al. (2003) for corroborating ecological evidence. In the absence of relevant ecological data for all of the variables we have studied here, however, a reasonable explanation of the observed differences in figural/depth effects is that they may be mediated by differences in the strength of grouping effects, as predicted by the ERG hypothesis. It is important to point out that the significant variation in the strength of grouping principles that we observed should not be used to infer the relative strength of these grouping principles more generally. In our experiments, grouping operated on textures and edges, elements that differ significantly from traditional display elements used to study grouping. Furthermore, the relative strength of grouping principles is bound to depend on many experimental parameters that were beyond the scope of our studies.
General Discussion
Overall, the results of these experiments provide compelling evidence that ERG is a significant factor in perceiving relative depth across an edge and figural status in simple two-region displays. Every grouping principle we studied produced a reliable bias in the predicted direction, and several of them were quite powerful6. In addition to these effects due to edge-region relations, we found several much weaker biases due to non-relational variables: Regions tended to be seen as closer and figural if their textures were moving rather than stationary, sharp rather than blurred, red rather than green, and (perhaps) static rather than flickering.
It is possible that at least some of these effects may be mediated by attention. Recent findings suggest that attention to a region can cause it to be seen as figural, under both endogenous conditions (Baylis & Driver, 1995) and exogenous conditions (Vecera, et al., 2004). One possible account of edge-region grouping is that grouping mechanisms alter the distribution of attention across the visual scene and focus it on the grouped region. Attention would then serve as a mediating factor that biases the grouped side to be perceived as figural. There are at least some cases (e.g., flickering) for which an attentional account seems to make the wrong prediction (that the flickering side should be seen as closer, because it is more attention-grabbing than the static side), but the present data cannot differentiate in general between this attention-mediated hypothesis and a direct effect of grouping on figure-ground organization without further evidence. Indeed, differentiating between them may be difficult given recent findings that regions perceived as figural tend to attract more attention than ground regions, even when non-ERG cues to figure-ground organization are used (Lazareva, Castro, Vecera, & Wasserman, 2006; Nelson & Palmer, 2007). Thus, whether attention is a causal factor in determining figure-ground organization or not is unclear, and Occam's razor dictates that until there is a good reason to include it in a theoretical account, it should not be included. Determining the relationship between ERG and attention is clearly an important question for further research, however, and future results may eventually dictate its inclusion in process models of figural/depth judgments based on ERG.
In addition to generating new cues to figure-ground organization, the edge-region grouping hypothesis provides a unified interpretation for previously unrelated findings about cues to depth perception and figure-ground organization within a single, coherent framework (e.g., Marshall et al., 1996; Yonas et al., 1987; Wong & Weisstein, 1987; Klymenko & Weisstein, 1986). It also clarifies previously puzzling findings (e.g., Wong & Weisstein, 1987) and provides a reasonable ecological rationale for many of the ERG effects we observed. Nevertheless, the ecological bases for some of the effects are unclear at best. Flicker synchrony seems particularly difficult to understand in terms of image statistics in natural situations. This problem, together with the suggestive results of Experiment 7 showing strong covariation between grouping and figural/depth ratings lead us to believe that grouping between edges and textures provides a better account of the results.
We used two measures of figural/depth in our experiment: figure-ground judgments and strength/confidence ratings. The meaning of the figure-ground judgments is relatively straight-forward. They presumably reflect the participant's perception of the display in terms of figure-ground organization. However, the proper interpretation of the strength/confidence ratings is less clear. One interpretation of strength/confidence is that higher strength ratings reflect a perception of more depth. However, we did not explicitly instruct participants to use the strength/confidence ratings as a metric to represent the amount of depth they perceived. Another interpretation of strength/confidence is in terms of the stability of the perception. Participants may have used higher ratings to indicate a more stable perception of figure-ground organization. This interpretation seems less likely because of the short duration of the displays that were used in most of the experiment (250 ms for experiments with static displays). There was little time for multi-stability or lack thereof to be appreciated. Another alternative is that the measure was used by participants to reflect the ease, rapidity, or clarity with which the display produced a figure-ground organization, without any reference to a particular amount of depth induced. Further research in which strength/confidence ratings are studied together with other measures (e.g. a depth-nulling method) may be able to clarify the meaning of this measure. In most of our results, the figure-ground ratings showed effects similar to the figure-ground judgments. This suggests that the strength/confidence ratings did not add significantly more information. In those cases where the results differed between the two measures, the exact meaning of the effects due to strength ratings remains unclear.
Previously, we have suggested that perceptual grouping occurs at many different levels of visual processing (Palmer, Brooks, & Nelson, 2003). The present results on edge-region grouping provide further evidence supporting this hypothesis. In contrast to the model of organizational processing set forth by Palmer and Rock (1994) in which visual grouping was assumed to occur only after figure-ground organization, the present results suggest that perceptual grouping can play an important role in determining the figural status of regions and therefore must have some influence before figure-ground organization. It is unclear, based on the present results, whether the grouping mechanisms that influence figure-ground organization are the same as those that group elements after it has occurred, however.
Our results show that grouping between edges and regions in otherwise ambiguous displays can cause figure-ground assignment of the edge to the grouped region. An important adjunct to this hypothesis is that grouping between edges and regions seems also to be a consequence of figure-ground organization. In other words, when figural factors, including classic non-ERG cues, cause an edge to be assigned to a region, it will be perceived as grouped with that region. This inverse-ERG hypothesis provides a further connection between processes of perceptual grouping and figure-ground organization. Overall, we hold that a strong mutual influence of perceptual grouping and figure-ground organization provides a plausible, coherent, and ecologically reasonable rationale for the new figure-ground effects that we have shown here as well as several effects (i.e., blur, common motion, flicker) that were described previously in the literature.
Supplementary Material
Acknowledgments
We thank Marshal Shepardson, Alice Tsui, Parul Vora, and Christian Reyes for help in collecting data. Joseph L. Brooks was supported by an NIMH Cognitive Neuroscience Training Grant and Royal Society International Post-doctoral Fellowship.
Footnotes
We acknowledge an anonymous reviewer for suggesting the possibility of implied accretion/deletion as a monocular cue to depth although we know of no evidence to support its existence. The demonstration described in the text shows that common fate can have an effect without implied accretion/deletion of texture.
Figure-ground assessment is often difficult along borders between equiluminant regions, but the border between the regions in these color displays (and along which the figure-ground judgment is made) always consist of a line-edge with substantial luminance contrast relative to the adjacent regions. In the texture-only condition, the adjacent regions are both white. In the region-only condition, the grouped region is a lighter shade of the edge color (red or green) and the ungrouped region is filled with a lighter shade of the other color (green or red, respectively). The texture-and-region conditions have the same contrast along the edge as the region-only displays. Thus, the border has substantial luminance contrast with its adjacent regions despite the texture elements of the display being equated for luminance with the line-edge color.
An extremal edge is a horizon of self-occlusion that arises when a smoothly curved, convex, opaque surface hides a portion of itself from view with respect to a particular viewpoint.
We acknowledge an anonymous reviewer for raising this objection.
The inverse-ERG hypothesis (that figural/depth status causally affects edge-region grouping) should not be confused with the negation of the ERG hypothesis (that edge-region grouping does not causally affect figural/depth perception).
In pilot experiments we also included displays in which the edge-region grouping hypothesis predicted no bias. For instance, in a pilot color grouping experiment we included conditions in which the texture dots in both regions were the same color, either blue or red, and the edge was the opposite color. In this case, neither side groups with the edge by color and thus there should be no systematic bias in figure-ground organization. This is exactly what we found. The figural/depth ratings were approximately zero in these conditions. Similarly, there is no preference reflected in the figure-ground judgments. We had similar conditions in pilot experiments for the proximity, orientation similarity, and flicker synchrony grouping principles. All produced figural/depth ratings of approximately zero and no bias in the figure-ground judgments. These informal results show that the edge region-grouping hypothesis is also accurate in its prediction in conditions in which there should be no bias.
Publisher's Disclaimer: The following manuscript is the final accepted manuscript. It has not been subjected to the final copyediting, fact-checking, and proofreading required for formal publication. It is not the definitive, publisher-authenticated version. The American Psychological Association and its Council of Editors disclaim any responsibility or liabilities for errors or omissions of this manuscript version, any version derived from this manuscript by NIH, or other third parties. The published version is available at http://www.apa.org/journals/xhp/
Contributor Information
Stephen E. Palmer, Department of Psychology, University of California, Berkeley
Joseph L. Brooks, UCL Institute of Cognitive Neuroscience, University College London, London, United Kingdom
References
- Baylis GC, Driver J. One-sided edge assignment in vision: 1. Figure-ground segmentation and attention to objects. Current Directions in Psychological Science. 1995;4:140–146. [Google Scholar]
- Driver J, Baylis GC. Edge-assignment and figure-ground segmentation in short-term visual matching. Cognitive Psychology. 1996;31:248–306. doi: 10.1006/cogp.1996.0018. [DOI] [PubMed] [Google Scholar]
- Elder JH, Zucker SW. Computing contour closure. Proceedings of the 4th European Conference on Computer Vision; Cambridge, UK. 1996. pp. 399–412. [Google Scholar]
- Fowlkes CC, Martin DR, Malik J. Learning affinity functions for image segmentation: Combining patch-based and gradient-based approaches. IEEE Workshop on Computer Vision and Pattern Recognition (CVPR); June 2003; Madison Wisconsin. 2003. [Google Scholar]
- Ghose T, Palmer SE. Gradient cut alignment: A cue to ground in figure-ground and depth perception. Paper presented at the Annual Meeting of the Vision Science Society; Sarasota, FL. May, 2007.2007. [Google Scholar]
- Ghose T, Palmer SE. Extremal edges versus other principles of figure-ground organization. doi: 10.1167/10.8.3. (in preparation) [DOI] [PubMed] [Google Scholar]
- Gibson JJ, Kaplan GA, Reynolds HN, Wheeler K. The change from visible to invisible: A study of optical transitions. Perception and Psychophysics. 1969;5(2):113–116. [Google Scholar]
- Hillstrom AP, Yantis S. Visual motion and attention capture. Perception and Psychophysics. 1994;55:399–411. doi: 10.3758/bf03205298. [DOI] [PubMed] [Google Scholar]
- Howard IP. Seeing in depth, Vol 1: Basic Mechanisms. Toronto, ON, Canada: University of Toronto Press; 2002. [Google Scholar]
- Howard IP, Rogers BJ. Seeing in depth, Vol 2: Depth perception. Toronto, ON, Canada: University of Toronto Press; 2002. [Google Scholar]
- Hulleman J, Humphreys GW. A new cue to figure-ground coding: Top-bottom polarity. Vision Research. 2004;44(24):2779–2791. doi: 10.1016/j.visres.2004.06.012. [DOI] [PubMed] [Google Scholar]
- Kanizsa G, Gerbino W. Convexity and symmetry in figure-ground organization. In: Henle M, editor. Vision and artifact. New York: Springer; 1976. pp. 25–32. [Google Scholar]
- Kishto BN. The color stereoscopic effect. Vision Research. 1965;5:313–329. doi: 10.1016/0042-6989(65)90007-6. [DOI] [PubMed] [Google Scholar]
- Klymenko V, Weisstein N. Spatial frequency differences can determine figure-ground organization. Journal of Experimental Psychology: Human Perception and Performance. 1986;12(3):324–330. doi: 10.1037//0096-1523.12.3.324. [DOI] [PubMed] [Google Scholar]
- Lazareva OF, Castro L, Vecera SP, Wasserman EA. Figure-ground assignment in pigeons: Evidence for a figural benefit. Perception and Psychophysics. 2006;68(5):711–24. doi: 10.3758/bf03193695. [DOI] [PubMed] [Google Scholar]
- Lee S, Blake R. Visual form created solely from temporal structure. Science. 1999;284:1165–1168. doi: 10.1126/science.284.5417.1165. [DOI] [PubMed] [Google Scholar]
- Marshall JA, Burbeck CA, Ariely D, Rolland JP, Martin KE. Occlusion edge blur: A cue to relative visual depth. Journal of the Optical Society of America. 1996;13:681–688. doi: 10.1364/josaa.13.000681. [DOI] [PubMed] [Google Scholar]
- Mather G, Smith DRR. Blur discrimination and its relation to blur-mediated depth perception. Perception. 2002;31(10):1211–1219. doi: 10.1068/p3254. [DOI] [PubMed] [Google Scholar]
- Nakayama K, Shimojo S, Silverman G. Stereoscopic depth: Its relation to image segmentation, grouping, and the recognition of occluded objects. Perception. 1989;18(1):55–68. doi: 10.1068/p180055. [DOI] [PubMed] [Google Scholar]
- Nelson RA, Palmer SE. Familiar shapes attract attention in figure-ground displays. Perception and Psychophysics. 2007;69(3):382–392. doi: 10.3758/bf03193759. [DOI] [PubMed] [Google Scholar]
- Palmer SE, Brooks JL, Nelson R. When does grouping happen? Acta Psychologia. 2003;114:311–330. doi: 10.1016/j.actpsy.2003.06.003. [DOI] [PubMed] [Google Scholar]
- Palmer S, Ghose T. Extremal Edges: A Powerful Cue to Depth Perception and Figure-Ground Organization. Psychological Science. 2008;19(1) doi: 10.1111/j.1467-9280.2008.02049.x. [DOI] [PubMed] [Google Scholar]
- Palmer SE, Levitin DS. Synchrony: A new principle of perceptual grouping. Paper presented at the Psychonomic Society Meeting; Dallas TX. 1998. [Google Scholar]
- Palmer SE, Rock I. Rethinking perceptual organization: The role of uniform connectedness. Psychonomic Bulletin & Review. 1994;1:29–55. doi: 10.3758/BF03200760. [DOI] [PubMed] [Google Scholar]
- Peterson MA, Gibson BS. Must figure-ground organization precede object recognition? An assumption in peril. Psychological Science. 1994;5(5):253–259. [Google Scholar]
- Pinna B, Brelstaff G, Spillmann L. Surface color from boundaries: A new ‘watercolor’ illusion. Vision Research. 2001;41:2669–2676. doi: 10.1016/s0042-6989(01)00105-5. [DOI] [PubMed] [Google Scholar]
- Rubin E. Figure and ground. In: Beardslee DC, Wertheimer M, editors. Readings in perception (1958, pp. 194 – 203) Princeton, NJ: Van Nostrand; 1921. Original work published 1921. [Google Scholar]
- Sekuler AB, Bennett PJ. Generalized common fate: Grouping by common luminance changes. Psychological Science. 2001;12(6):437–444. doi: 10.1111/1467-9280.00382. [DOI] [PubMed] [Google Scholar]
- Vecera SP, Vogel EK, Woodman GF. Lower region: A new cue for figure-ground assignment. Journal of Experimental Psychology: General. 2002;131(2):194–205. doi: 10.1037//0096-3445.131.2.194. [DOI] [PubMed] [Google Scholar]
- Vecera SP, Flevaris AV, Filapek JC. Exogenous spatial attention influences figure-ground assignment. Psychological Science. 2004;15(1):20–26. doi: 10.1111/j.0963-7214.2004.01501004.x. [DOI] [PubMed] [Google Scholar]
- Wagner G, Boynton RM. Comparison of four methods of heterochromatic photometry. Journal of the Optical Society of America. 1972;62(12):1508–1515. doi: 10.1364/josa.62.001508. [DOI] [PubMed] [Google Scholar]
- Wertheimer M. Untersuchungen zur Lehre von der Gestalt. Psychologishe Forschung. 1923;4:301–350. [Google Scholar]
- Wong E, Weisstein N. The effects of flicker on the perception of figure and ground. Perception & Psychophysics. 1987;41(5):440–448. doi: 10.3758/bf03203037. [DOI] [PubMed] [Google Scholar]
- Yantis S, Jonides J. Attentional capture by abrupt onsets: New perceptual objects or visual masking. Journal of Experimental Psychology: Human Perception & Performance. 1996;22(6):1505–1513. doi: 10.1037//0096-1523.22.6.1505. [DOI] [PubMed] [Google Scholar]
- Yonas A, Craton LG, Thompson WB. Relative motion: Kinetic information for the order of depth at an edge. Perception and Psychophysics. 1987;41(1):53–59. doi: 10.3758/bf03208213. [DOI] [PubMed] [Google Scholar]
Associated Data
This section collects any data citations, data availability statements, or supplementary materials included in this article.