

Abstract
Perfluorooctane-1-sulfonic acid (PFOS) is emerging as an important persistent environmental pollutant. To gain insight into the interaction of PFOS with biological systems, the mixing behavior of dipalmitoylphosphatidylcholine (DPPC) with PFOS was studied using differential scanning calorimetry (DSC) and fluorescence anisotropy measurements. In the DSC experiments the onset temperature of the DPPC pretransition (Tp) decreased with increasing PFOS concentration, disappearing at XDPPC ≤ 0.97. The main DPPC phase transition temperature showed a depression and peak broadening with increasing mole fraction of PFOS in both the DSC and the fluorescence anisotropy studies. From the melting point depression in the fluorescence anisotropy studies, which was observed at a concentration as low as 10 mg/L, an apparent partition coefficient of K = 5.7 × 10⁴ (mole fraction basis) was calculated. These results suggest that PFOS has a high tendency to partition into lipid bilayers. These direct PFOS-DPPC interactions are one possible mechanism by which PFOS may contribute to adverse effects, for example neonatal mortality, in laboratory studies and possibly in humans.
Keywords: Perfluorinated surfactants, DPPC, DSC, liposome, membrane fluidity
1. Introduction
Perfluorooctanesulfonic acid (PFOS) and related compounds have been used for over 50 years in various large scale technical applications such as fire extinguishing media and in consumer products such as stain-repellent coatings on carpets, paper or fabrics [1-3]. These multifaceted applications of PFOS and other perfluorinated surfactants utilize an unusual combination of properties such as thermal, chemical and biological inertness, excellent spreading characteristics, and high surface activity. The extreme inertness of many perfluorinated surfactants towards chemical and biological degradation, as well as their hydrophobic character, contributes to their worldwide distribution in the environment and their accumulation in the food chain [4, 5]. Recent bio-monitoring studies have also shown a widespread prevalence of PFOS in humans, thus giving raise to human health concerns. In particular, the developmental toxicity of PFOS is currently of significant interest to public and regulatory agencies.
The findings from several teratological studies suggest that developmental effects of PFOS are generally unremarkable if the maternal toxicity is taken into consideration [6, 7]. In contrast to these perinatal teratological studies, postnatal studies in both rats and mice showed a drastic, dose-dependent effect of maternal PFOS exposure on the survival of the neonates immediately after birth [6, 8-10]. In particular, neonates from dams exposed to high levels of PFOS during gestation became moribund shortly after birth and did not survive for longer periods of time. Long-term survival of the neonates improved with lower PFOS exposure, which suggests that the morbidity and mortality of the neonates is proportional to their PFOS body burden. The critical period for the increased neonatal mortality are the late-gestational, i.e. gestation day 19 and 20 [10], and early postnatal periods [9]. These finding suggests that PFOS may alter lung maturation and function at birth, thus causing neonatal mortality. Currently, the mechanism of mortality, stemming from in utero PFOS exposure, is unknown.
The direct interaction of PFOS with components of pulmonary surfactant has been proposed as one possible mechanism which may contribute to the increased neonatal mortality in rodents [9]. Therefore, the present study investigates the accumulation of PFOS potassium salt (Figure 1) in dipalmitoyl phosphatidylcholine (DPPC) model bilayer membranes, and the subsequent effects of PFOS on membrane stability and morphology, using differential scanning calorimetry (DSC) and fluorescence anisotropy measurements.
Figure 1.
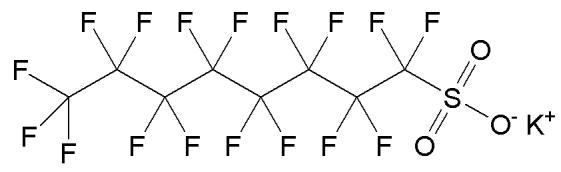
Chemical structure of perfluorooctanesulfonic acid potassium salt (PFOS).
2. Experimental
PFOS potassium salt (≥ 98% purity, Lot&Filling code 436098/1 51403079) and DPPC (> 99% purity) were purchased from Fluka Chemie GmbH (Buchs, Switzerland) and Sigma Chemical Company, respectively, and used without further purification. The fluorescent membrane probe, 1,6-diphenyl-1,3,5-hexatriene (DPH, > 99%), was purchased from Molecular Probes (Eugene, OR). Methanol and chloroform were purchased from Fisher Scientific and were HPLC and ACS grade, respectively. Deionized water for the DSC studies was distilled first from basic potassium permanganate followed by distillation from sulfuric acid [11-15]. For fluorescence studies, deionized ultra-filtered water (DIUF, Fisher Scientific) was used without further purification.
2.1. Differential scanning calorimetry
Calculated amounts of the phospholipid were dissolved in chloroform – methanol (3:1,v\v) and the appropriate amount of PFOS potassium salt in methanol was added to give solutions of the desired mole fraction of PFOS in DPPC [11-15]. The solvent was removed under a stream of nitrogen and the mixtures were further dried under vacuum for at least 3 h. The samples (mixture of DPPC and PFOS or pure DPPC) were hydrated in an excess of water (three times by weight). Samples were heated above the lipid phase transition (gel to fluid) temperature for 5 min and vortexed for 2 min. This process was repeated four to eight times to insure PFOS incorporation into the DPPC bilayer. The hydrated samples were stored at 4°C for 12-16 h. Hydration of the samples was always carried out a day before collecting the DSC scans.
A Thermal Analysis 2920 differential scanning instrument was used for the DSC studies. The hydrated samples were weighed into DSC aluminum pans. The DSC cell was purged with 60 mL\min and the refrigerated cooling system (RSC) with 120 mL/min dry nitrogen, respectively. Samples were cooled to 4°C at a heating rate of 10°C/min and then heated from 4°C to 80°C with a heating rate of 5°C/min. All samples were subjected to two subsequent heating cycles. Onset, maximum and offset temperatures, as well as peak width of the pretransition and the main phase transition, were determined for the second run using the Universal Analysis NT software [11-15]. All experiments were carried out in triplicate. The pretransition and main phase transitions of DPPC are in good agreement with literature data [13, 16].
2.2. Fluidity measurements using fluorescence anisotropy
Aqueous stock solutions of 1 mM DPPC labeled with DPH (1:500 molar ratio probe:lipid) were prepared similar to the method described for DSC studies. Briefly, solutions of DPPC dissolved in chloroform and DPH dissolved in tetrahydrofuran were mixed and co-evaporated by rotary evaporation under vacuum and further dried under vacuum for 2 h. The DPPC/DPH film was then hydrated above the melting temperature of DPPC (T > 315 K). Liposome suspensions were obtained by short sonication at T >315K followed by extrusion for ∼19 times through a LiposoFast extruder (Avestin Inc., Canada) at T >315K [17]. To investigate bilayer fluidization by PFOS, working solutions were prepared by diluting the stock DPPC liposome suspension 100-fold with aqueous PFOS solutions to obtain final concentrations of 0, 10, 20, 50, 75 and 200 mg PFOS/L.
DPH anisotropy in DPPC bilayers was measured using a LS55 Luminescence Spectrometer from PerkinElmer (Shelton, CT) operated with FL WINLAB SOFTWARE. The spectroscopic cell was temperature controlled using a PerkinElmer PTP-1 Peltier System and was continuously mixed with a magnetic stirrer at low speed [18]. Steady-state DPH anisotropy within the DPPC bilayer was determined at λex = 350 nm and λem = 452 nm [19]. DPPC melting temperatures (Tm) were determined from plots of absolute fluorescence anisotropy (<r>) as a function of temperature (323 to 298 K with a cooling rate of 0.2°/min). Anisotropy in a liquid-crystalline (fluid) DPPC phase is significantly lower than in a gel phase; therefore, upon cooling the main fluid-gel phase transition is identified by an abrupt increase in anisotropy. The temperature at the midpoint of this melting transition is taken as Tm, and ΔTr is the width of the melting region.
3. Results and discussion
3.1. Differential scanning calorimetry studies
To favor the dissolution of PFOS in the DPPC bilayer, we prepared homogenous mixtures of DPPC with increasing mole fractions of PFOS by co-dissolving them in chloroform-methanol followed by evaporation of the solvent. This approach is frequently used to prepare mixtures of lipids with structurally diverse test compounds. Shown in Figure 2 are representative DSC thermograms of fully hydrated mixtures prepared using this approach. The thermograms were used to determine how the addition of increasing amounts of PFOS altered the pretransition and the main phase transition temperatures of DPPC as described previously by our laboratory [11-15].
Figure 2.

Calorimetric scans for mixtures of DPPC with perfluorooctanesulfonic acid potassium salt in excess water. The mole fraction of DPPC is indicated besides each scan. The heating rate was 5°/minute from 4 to 80°C (only the part of the curve with a phase transition is shown).
The pretransition of DPPC and other phosphatidylcholines is a sensitive measure of changes in the structure of lipid bilayers. This pretransition is the result of a shift of the hydrophobic chains of the lipid molecules from a tilted gel configuration to a rippled gel phase with increasing temperature. The tilted configuration of the hydrophobic chains in the gel phase is caused by the mismatch of the cross-sectional area of the tails and the headgroup (40Å2 versus 46 Å2, respectively). Incorporation of small, hydrophobic molecules may force the lipid molecules to, presumably, adopt a vertical gel phase and can not only drastically influence the onset temperature Tp and peak width of the pretransition but also result in its disappearance. Typically, dramatic effects are already observed at mole fractions of solute as low as 0.01 to 0.05 (XDPPC as high as 0.99 to 0.95) [20].
In the PFOS-DPPC system the onset temperature of the pretransition Tp decreases significantly after addition of only a small quantity of PFOS (XDPPC ≤ 0.99), merges with the main phase transition at XDPPC = 0.97 and disappears below a mole fraction of XDPPC ≤ 0.97. At the same time the pretransition shows significant peak broadening beginning at a mole fraction of XDPPC ≤ 0.99. We recently described a similar effect of two perfluorinated carboxylic acids, perfluorododecanoic and perfluorotetradecanoic acid, on the pretransition of DPPC [13]. The significant impact of perfluorinated compounds on the pretransition suggests that they are incorporated into the bilayer where they cause structural changes. The nature of these changes is currently unknown, but the most likely explanation is a change in the tilt angle of the lipid molecules, i.e. an adoption of a vertical gel phase to accommodate an amphiphilic solute.
As shown in Figure 3, the onset temperatures of the main phase transition of the PFOS-DPPC system decreases with increasing PFOS content over the entire mole fraction range studied. This decrease is almost linear (R2 = 0.99). At the same time, the offset temperature remains fairly constant between mole fractions of DPPC ranging from 1 to 0.97, with a slight decrease being observed between XDPPC = 0.97 and XDPPC = 0.90. A region with a constant or slightly decreasing offset temperature can be observed at even lower mole fractions of DPPC. As shown in Figures 2 and 3, the half width of the phase transition shows a significant increase at high mole fractions of DPPC, whereas a drastic peak broadening can be observed beginning at XDPPC < 0.93. This peak broadening is accompanied by the occurrence of two or possibly more phase transitions, whereas for XDPPC ≥ 0.90 only one main phase transition can be observed. Despite the shifts in onset and offset temperatures with increasing PFOS concentration, the DPPC main phase transition enthalpy did not change significantly as denoted by the area under the heat flow curve (data not shown).
Figure 3.
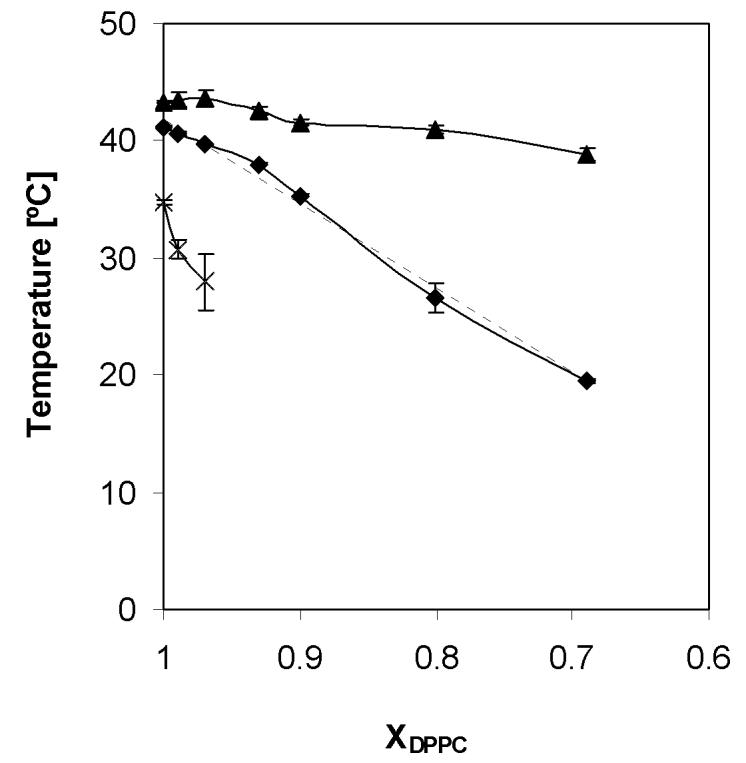
Partial phase diagram of mixtures of DPPC with perfluorooctanesulfonic acid potassium salt in excess water. (×) Onset temperature Tp of the pretransition, (◆) onset temperature of main transition, and (▲) offset temperature of main transition. The dotted line illustrates the close-to-linear decrease of the onset temperature of main transition.
A similar linear decrease of the main phase transition temperature and an increase of peak width have been observed for mixtures of DPPC with increasing mole fraction of several sodium alkylsulfates (C8-12), surfactants which have a headgroup similar to the PFOS potassium salt [21]. These changes in the phase behavior of DPPC-sodium alkylsulfate systems depended only on the concentration of the alkylsulfate surfactant but not on its chain length. Mixtures of DPPC with an anionic, perfluorinated surfactant, sodium perfluorooctanoate, also showed a linear decrease of the main phase transition temperature down to a mole fraction of DPPC of approximately 0.5 [22]. Overall, the results from these two studies suggest that both types of anionic surfactant are incorporated into the lipid bilayer, independent of the type of headgroup (sulfate versus carboxylate) or hydrophobic tail (perhydrocarbon versus fluorocarbon). The driving force for their incorporation is the hydrophopic effect [21, 22]. Similar to these earlier studies, the DSC experiments presented herein provide strong evidence for an incorporation of PFOS into the DPPC bilayer with the hydrophobic effect being the likely driving force.
Like other anionic surfactants, the PFOS anion is most likely located at the lipid-water interface, probably close to the positively charged trimethylammonium part of the phosphatidylcholine headgroup [20]. At the same time the hydrophobic perfluorinated tail of PFOS is aligned parallel to the palmitoyl tails of DPPC, thus introducing free volume into the bilayer. The formation of such a free volume is energetically unfavorable, and the alkyl chains of DPPC need to maximize the entropy of the bilayer by filling the free volume, for example by increasing trans-gauche conformations or chain bends, which causes a significant disruption of the packing of the tails of DPPC and reduce van der Waals interactions. In addition, Coulomb interactions between the anionic charges of the surfactant headgroups have been proposed to causes a disruption of the long-range order of the phospholipids [21].
Overall, the above mentioned altered interactions between the DPPC molecules resulting form the incorporation of PFOS into the bilayer not only explain the decrease in the onset temperature, but also the peak broadening of the main phase transition. Bilayers are thought to consist of molecular clusters or domains which, due to their similar structure and size, result in the sharp transition peak of fully hydrated DPPC [23-25]. Small molecules, for example PFOS, are located preferentially at the interface of these domains where they stabilize the domain boundaries and result in more ramified domain surfaces. This results in a reduced size and, consequently, an increased number of domains which causes a decreased cooperativity of the phase transition in the DPPC bilayer and, hence, a peak broadening and decrease in the onset temperature.
3.2. Fluorescence Studies
Mean fetal PFOS serum levels at gestation day 21 of 162 mg/L have recently been reported in a neonatal mortality study in rats [8]. These serum levels were observed in fetuses from dams receiving a PFOS dose that caused significant neonatal mortality. Human serum PFOS levels are typically lower compared to this animal study, but can reach > 10 mg/L in an occupational setting [26]. Because these serum levels are approximately two to three orders of magnitude below the lowest aqueous PFOS concentration (XDPPC = 0.99) employed in our DSC studies, we utilized DPH anisotropy measurements to study the effect of biologically more relevant concentrations of PFOS potassium salt on the DPPC bilayer.
The concentration dependence of the melting point of the DPPC liposomes and the DPH anisotropy at physiological temperature are shown in Figures 4 and 5, respectively. Up to a PFOS concentration of 75 mg/L, the DPPC melting temperature decreases almost linearly (R2 = 0.98) with increasing PFOS concentration and a corresponding increase in the width of the phase transition region is observed (Figure 4). The decrease in melting temperature levels off at PFOS concentrations > 75 mg/L and appears to remain almost constant. However, in the same concentration range a further increase in peak width can be observed. In addition, the temperature at which the fluid to gel transition begins, which is analogous to the DSC offset temperature, is insensitive to PFOS concentration (42.5°C, data not shown). The observed trends are in good agreement with the results from the DSC study. A decrease in the melting temperature and a broadening of the phase transition region are apparent at a PFOS concentration as low as 10 mg/L. Hu and co-workers reported an increased fluidity in fish leukocytes for the same concentration range of 5 to 15 mg/L using pyrenedecanoic acid as a fluorescent probe [27]. This concentration range, as mentioned above, has been measured in the serum of workers with high occupational exposure to PFOS derivatives [26].
Figure 4.

Effect of the aqueous concentration of PFOS potassium salt on the (◆) DPPC melting temperature Tm and the (Δ) width of the melting region ΔT.
Figure 5.
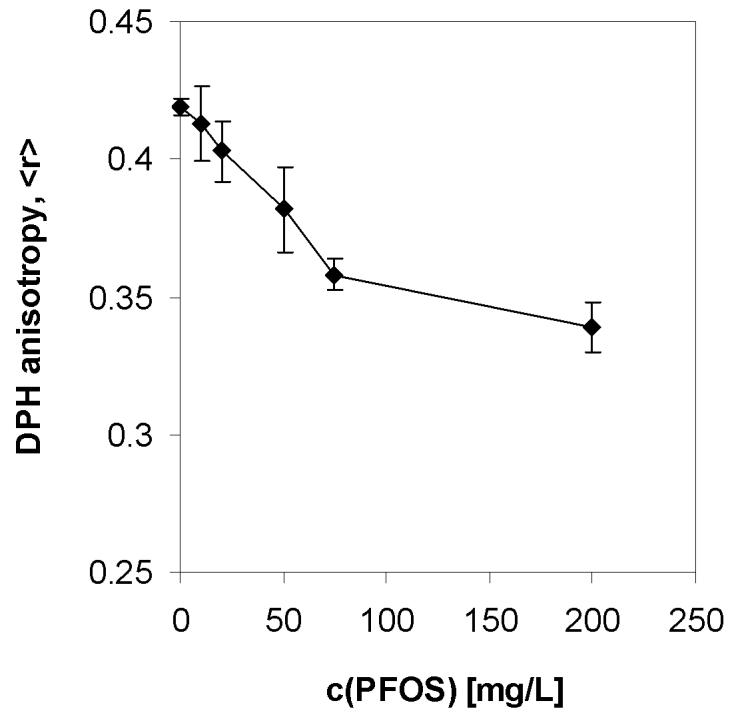
DPPC bilayer fluidization by aqueous PFOS potassium salt at the physiological temperature (37°C).
The apparent partition coefficient for PFOS between DPPC bilayers and the bulk aqueous phase (K = XDPPC/Xaq, mole fraction basis) was estimated according to following equation [22]
| (Eq.2), |
where ΔTm is the change in melting temperature, R is the gas constant, Tm,o is the melting temperature of hydrated DPPC, ΔHm is the phase transition enthalpy (36.4 KJ/mol [28]), CPFOS, o is the initial aqueous PFOS concentration, and CDPPC is the lipid concentration. Inoue and coworkers [22] have used Eq.2 to determine partition coefficients for a number of surfactants with hydrocarbon and fluorinated tails, including sodium perfluorooctanoate. Using the linear relationship observed between −ΔTm vs. CPFOS, o (R2 = 0.98; graph not shown), the apparent partition coefficient calculated from the slope is K = 5.7 × 10⁴. This value is almost an order of magnitude greater than that calculated for sodium perfluorooctanoate (8.9 × 10³) [22], which suggests that, compared to sodium perfluorooctanoate, PFOS has an even higher tendency to partition into the lipid bilayer.
In addition to studying the effect of PFOS on the melting temperature of DPPC, we also analyzed the DPH anisotropy at physiological temperature (Figure 5). A linear decrease of the DPH anisotropy can be observed with increasing PFOS concentration up to a concentration of 75 mg/L. A less pronounced decrease of the DPH anisotropy can be observed between 75 to 200 mg/L. Compared to pure DPPC, a significant decrease in DPH anisotropy was observed at a PFOS concentration as low as 20 mg/L (P < 0.05), which is also in agreement with the above mentioned study by Hu and co-workers [27].
4. Conclusions
PFOS has a higher tendency to partition into DPPC layers compared to structurally related, fluorinated surfactants. For example, the apparent surfactant-DPPC partition coefficients for PFOS and sodium perfluorooctanoate are 5.7 × 10⁴ and 8.9 × 10³ [22], respectively. Furthermore, both DSC and fluorescence anisotropy studies show a significant melting point depression and a drastic peak broadening of gel-to-liquid phase transition of the DPPC model membranes with increasing PFOS concentrations. A significant decrease in the temperature of the gel-to-liquid phase transition of DPPC was observed at a PFOS concentration of 10 mg/L, whereas a significant increase in the DPPC membrane fluidity occurred at physiological temperature at a PFOS concentration of 20 mg/L.
Overall, the PFOS has a drastic effect on DPPC model membranes, which suggests that PFOS may alter the function of biological mono- and bilayers. For example, this direct impairment of pulmonary surfactant may be a contributing factor in the impaired lung function reported in postnatal animal studies and at least partly explain the neonatal mortality observed in these studies [9, 10]. Further studies are therefore warranted to fully understand the direct effect of PFOS on structure and function of biological lipid assemblies, especially pulmonary surfactant.
Acknowledgements
This work was supported by grants from The University of Iowa Center for Health Effects of Environmental Contamination (CHEEC), the National Institute of Environmental Health Sciences (ES 012475) and the National Science Foundation (NIRT 0210517). Its contents are solely the responsibility of the authors and do not necessarily represent the official views of the funding agencies.
References
- 1.Schultz MM, Barofsky DF, Field JA. Environ. Eng. Sci. 2003;20:487. [Google Scholar]
- 2.Kissa E. Fluorinated surfactants and repellents. Vol. 97. Marcel Dekker; New York: 2001. [Google Scholar]
- 3.Lehmler H-J. Chemosphere. 2005;58:1471. doi: 10.1016/j.chemosphere.2004.11.078. [DOI] [PubMed] [Google Scholar]
- 4.Martin JW, Mabury SA, Solomon KR, Muir DCG. Environ. Toxicol. Chem. 2003;22:196. [PubMed] [Google Scholar]
- 5.Martin JW, Mabury SA, Solomon KR, Muir DCG. Environ. Toxicol. Chem. 2003;22:189. [PubMed] [Google Scholar]
- 6.Lau C, Butenhoff JL, Rogers JM. Toxicol. Appl. Pharmacol. 2004;198:231. doi: 10.1016/j.taap.2003.11.031. [DOI] [PubMed] [Google Scholar]
- 7.Environment Directorate, OECD . Report ENV/JM/RD(2002)17/FINAL. Paris: 2002. Hazard assessment of perfluorooctane sulfonate (PFOS) and its salts. [Google Scholar]
- 8.Luebker DJ, York RG, Hansen KJ, Moore JA, Butenhoff JL. Toxicology. 2005;215:149. doi: 10.1016/j.tox.2005.07.019. [DOI] [PubMed] [Google Scholar]
- 9.Luebker DJ, Case MT, York RG, Moore JA, Hansen KJ, Butenhoff JL. Toxicology. 2005;215:126. doi: 10.1016/j.tox.2005.07.018. [DOI] [PubMed] [Google Scholar]
- 10.Grasty RC, Grey BE, Lau CS, Rogers JM. Birth Defects Res. Part B Dev. Reprod. Toxicol. 2003;68:465. doi: 10.1002/bdrb.10046. [DOI] [PubMed] [Google Scholar]
- 11.Lehmler H-J, Jay M, Bummer PM. Langmuir. 2000;16:10161. [Google Scholar]
- 12.Arora M, Bummer PM, Lehmler H-J. Langmuir. 2003;19:8843. [Google Scholar]
- 13.Lehmler H-J, Bummer PM. Biochim. Biophys. Acta. 2004;1664:141. doi: 10.1016/j.bbamem.2004.05.002. [DOI] [PubMed] [Google Scholar]
- 14.Lehmler H-J, Bummer PM. Colloids Surf. B. 2005;44:74–81. doi: 10.1016/j.colsurfb.2005.05.014. [DOI] [PMC free article] [PubMed] [Google Scholar]
- 15.Lehmler H-J, Bummer PM. J. Lipid Res. 2005;46:2415. doi: 10.1194/jlr.M500231-JLR200. [DOI] [PubMed] [Google Scholar]
- 16.Huang C.-h., Li S. Biochim. Biophys. Acta. 1999;1422:273. doi: 10.1016/s0005-2736(99)00099-1. [DOI] [PubMed] [Google Scholar]
- 17.Zhang X-M, Patel AB, de Graaf RA, Behar KL. Chem. Phys. Lipids. 2004;127:113. doi: 10.1016/j.chemphyslip.2003.09.013. [DOI] [PubMed] [Google Scholar]
- 18.Thakkar RR, Wang O-L, Zerouga M, Stillwell W, Haq A, Kissling R, Pierce WM, Smith NB, Miller FN, Ehringer WD. Biochim. Biophys. Acta. 2000;1474:183. doi: 10.1016/s0304-4165(00)00021-0. [DOI] [PubMed] [Google Scholar]
- 19.Bothun GD, Knutson BL, Strobel HJ, Nokes SE. Langmuir. 2004;21:530. doi: 10.1021/la0496542. [DOI] [PubMed] [Google Scholar]
- 20.Lohner K. Chem. Phys. Lipids. 1991;57:341. doi: 10.1016/0009-3084(91)90085-p. [DOI] [PubMed] [Google Scholar]
- 21.Inoue T, Miyakawa K, Shimozawa R. Chem. Phys. Lipids. 1986;42:261. doi: 10.1016/0009-3084(86)90085-x. [DOI] [PubMed] [Google Scholar]
- 22.Inoue T, Iwanaga T, Fukushima K, Shimozawa R. Chem. Phys. Lipids. 1988;46:25. doi: 10.1016/0009-3084(88)90109-0. [DOI] [PubMed] [Google Scholar]
- 23.Van Osdol WW, Ye Q, Johnson ML, Biltonen RL. Biophys. J. 1992;63:1011. doi: 10.1016/S0006-3495(92)81674-0. [DOI] [PMC free article] [PubMed] [Google Scholar]
- 24.Jorgensen K, Ipsen JH, Mouritsen OG, Bennett D, Zuckermann MJ. Biochim. Biophys. Acta. 1991;1067:241. doi: 10.1016/0005-2736(91)90050-i. [DOI] [PubMed] [Google Scholar]
- 25.Biltonen RL. J. Chem. Thermodyn. 1990;22:1. [Google Scholar]
- 26.Olsen GW, Burris JM, Mandel JH, Zobel LR. J. Occup. Environ. Med. 1999;41:799. doi: 10.1097/00043764-199909000-00012. [DOI] [PubMed] [Google Scholar]
- 27.Hu W.y., Jones PD, DeCoen W, King L, Fraker P, Newsted J, Giesy JP. Comp. Biochem. Physiol. C Toxicol. Pharmacol. 2003;135:77. doi: 10.1016/s1532-0456(03)00043-7. [DOI] [PubMed] [Google Scholar]
- 28.Koynova R, Caffrey M. Biochim. Biophys. Acta. 1998;1376:91. doi: 10.1016/s0304-4157(98)00006-9. [DOI] [PubMed] [Google Scholar]