

Abstract
Simultaneous EEG-fMRI (Electroencephalography-functional Magnetic Resonance Imaging) recording provides a means for acquiring high temporal resolution electrophysiological data and high spatial resolution metabolic data of the brain in the same experimental runs. Carbon wire electrodes (not metallic EEG electrodes with carbon wire leads) are suitable for simultaneous EEG-fMRI recording, because they cause less RF (radio-frequency) heating and susceptibility artifacts than metallic electrodes. These characteristics are especially desirable for recording the EEG in high field MRI scanners. Carbon wire electrodes are also comfortable to wear during long recording sessions. However, carbon electrodes have high electrode-electrolyte potentials compared to widely used Ag/AgCl (silver/silver-chloride) electrodes, which may cause slow voltage drifts. This paper introduces a prototype EEG recording system with carbon wire electrodes and a circuit that suppresses the slow voltage drift. The system was tested for the voltage drift, RF heating, susceptibility artifact, and impedance, and was also evaluated in a simultaneous ERP (event-related potential)-fMRI experiment.
1. Introduction
Simultaneous EEG-fMRI (Electroencephalography-functional Magnetic Resonance Imaging) recording provides a means for acquiring high temporal resolution electrophysiological data and high spatial resolution metabolic data of the brain in the same experimental runs. EEG-fMRI recording has been used for localizing epileptic spikes (Warach et al., 1996; Seeck et al., 1998; Krakow et al., 1999; Goldman et al., 2000; Baudewig et al., 2001; Lemieux et al., 2001; Salek-Haddadi et al., 2002; Sommer et al., 2003), determining sources of event related potentials (Bonmassar et al., 1999; Kruggel et al., 2000; Liebenthal et al., 2003; Sommer et al., 2003), or correlating brain rhythms with hemodynamic activities (Goldman et al. 2002, Laufs et al. 2003, Moosmann et al. 2003, Feige et al. 2005, de Munck et al. 2007).
As researchers move to higher field MRI machines to exploit high resolution imaging, conventional EEG electrodes used in EEG-fMRI recordings face increasing safety and imaging quality issues. Widely used materials for EEG electrodes used in EEG-fMRI recordings are Ag (sliver)/AgCl (silver-chloride), metal coated solid carbon or plastic, or solid carbon. Metals in the MRI environment cause RF (radio-frequency) heating (Angelone et al. 2004; Bonmassar 2004) and susceptibility artifacts (Krakow et al. 2000). Moreover, EEG electrodes that are made of solid materials can be uncomfortable for subjects to wear during long EEG-fMRI sessions.
The use of carbon wire electrodes reduces these problems. Note that the term “carbon wire electrodes” here means electrodes made of carbon wires, and does not refer to solid EEG electrodes that are attached to carbon wires as the term is occasionally used. Carbon electrodes cause less RF heating (Bonmassar, 2004) and less susceptibility artifacts (Krakow et al., 2000) compared to metallic electrodes. Also, since carbon wire electrodes are highly flexible and fairly flat, subjects do not feel the electrodes pressing against their heads as they lie in the scanner.
On the other hand, carbon has higher electrode-electrolyte DC potentials than Ag/AgCl. While electrode-electrolyte potentials should cancel out each other if the identical electrodes are used in pairs, there are often imbalances between electrodes and electrolytes around the electrodes, causing electrode polarization (Geddes 1972) and possible saturation of the EEG amplifier. Although carbon wire EEG electrodes have been used in an animal 7T (Tesla) scanner (Audekerke 2000), they have not been widely used for human EEG work. This paper introduces an EEG recording system that includes carbon wire electrodes and a circuit that reduces the electrode polarization problem. The carbon wire electrodes and anti-polarization circuit described here represent an alternative to “InkCap” (Bonmassar 2004; Vasios et al. 2006), which is also designed for use in high field MRI (see 4.4 for discussions).
2. Methods
2.1 EEG recording system
A prototype EEG system was built for the evaluation of carbon wire electrodes. The prototype system consisted of a four-electrode EEG cap, a subject safety circuit, a bipolar amplifier with an anti-polarization circuit, and an EEG recorder. Artifact removal was performed offline.
2.1.1 EEG cap
(1) A two-channel prototype cap
The prototype carbon wire EEG cap had four carbon wire electrodes (FP2, FPz, CPz, and Pz) and two pairs of bipolar output carbon leads FP2-FPz and Pz-CPz (Fig. 1). The output from the FP2-Fz pair was used for detecting eye movements. Each electrode was made of the exposed tip of a carbon wire (CPVC4050, World Scientific Inc., Sarasota, FL) enclosed in a water permeable pouch (Fig. 2). Water permeable pouches were made of two layers of fine polyester mesh and were 15 mm (millimeter) long (in the direction of the carbon wire tip) and 10 mm wide. The pouches were sewn under flaps that were cut out on a spandex cap. When positioning the cap on the subject, conductive gel (Quik-Gel, Neuromedical Supplies, Charlotte, NC) was applied to the scalp under each flap with a cotton applicator, and the flap was closed and secured with an adhesive tape.
Fig. 1.
A prototype EEG cap (frontal view). The prototype carbon wire electrode cap has two bipolar outputs, namely Fz-FP2 and Pz-CPs. It also has three mutually orthogonal carbon wire loops (X, Y, and Z) whose outputs are used as reference signals for scanner noise removal.
Fig. 2.
A carbon wire electrode. The carbon wire electrode in the prototype EEG system is an exposed tip of a carbon lead contained in a polyester mesh that is attached to a flap on an EEG cap. The carbon lead is made of thin carbon wires in a PVC (polyvinyl chloride) sheath.
In addition to carbon wire electrodes, the cap was equipped with three carbon loops (2cm diameter) that were used as MR artifact detectors. The loops were oriented nearly mutually orthogonal and were located in three different positions: the forehead, on the top of the head, and on the right temporal region of the subject, with the planes of the loops in the coronal, axial, and sagittal planes, respectively. Although the loop on the forehead was centered around the FPz electrode, it is not necessary for the loops to be located around any electrodes for the MR artifact removal. Because the loops detect the change in magnetic fields in three mutually orthogonal directions, linear combinations of their outputs should match the gradient artifacts at any electrodes. The loops detect the dynamic magnetic field as well as motion (including ballistocardiogram) in the static magnetic field, but their outputs contain no neurophysiological signals.
(2) A 32 channel cap
A 32 channel cap was made for evaluating a larger scale system. It had 33 electrodes: FP1, FPz, FP2, F7, F3, Fz, F4, F8, FT7, FC3, FCz, FC4, FT8, T7, C3, Cz, C4, T8, M1, TP7, CP3, CPz, CP4, TP8, M2, P7, P3, Pz, P4, P8, O1, Oz, and O2. The montage was made of five sagittal lines FP1-F7-FT7-T7-TP7-P7, FPz-FP1-F3-FC3-C3-CP3-P3-O1, FPz-Fz-FCz-Cz-CPz-Pz-Oz, FPz-FP2-F4-FC4-C4-CP4-P4-O2, and FP2-F8-FT8-T8- TP8-P8, where adjacent electrodes in the lines formed bipolar pairs, with two additional pairs TP7-M1 and TP8-M2. Electrodes that were shared by multiple bipolar pairs, which were actually the majority of electrodes (excluding electrodes at the ends of sagittal lines M1, P7, O1, Oz, O2, P8, and M2), had multiple output wires, and each pair of wires from a bipolar pair formed a twisted pair. In addition to the carbon wire electrodes, the cap was also equipped with three carbon loops for MR artifact detection.
2.1.2 Subject safety circuit
The subject safety circuit consisted of a circuit breaker that opened all connections from the cap in case there was an excess current (> 10 microamperes) in any of the EEG leads. The safety circuit consisted of 16 kilo-ohms current limiting resistors (Lemieux et al. 1997) and voltage comparators that compared the voltage difference across these resistors and a referential voltage, and mechanical relays that broke the connections from the cap if the voltage across any of the resistors indicated that there was an excess current. Mechanical relays were chosen over solid-state relays because a previous study showed that even a slight non-linearity in the EEG measurement circuit may give rise to RF artifacts (Negishi et al. 2007), and solid-state relays have a slightly non-linear input-output characteristics due to semiconductors used. For subject safety, parts of the circuit that were directly or indirectly connected to the EEG leads were operated by batteries and were isolated using a photo-coupler from a relay driver circuit, whose power was supplied from the main AC lines. The subject safety circuit was placed adjacent to the filtration panel, in the scanner room.
2.1.3 Filtration panel
Outputs from the safety circuit were routed out of the scanner room through a filtration panel that was equipped with 11 MHz (mega-hertz) low-pass RF filters (BLP10.7, Mini-Circuits, Brooklyn, NY). Two RF filters were used for each bipolar EEG channel. The RF filters served two functions: to reduce RF interference from outside the scanner room that affects the MRI imaging quality, and to reduce the RF noise from the scanner room that affects the EEG signal.
2.1.4 Preamplifier with an anti-polarization circuit
A 35 channel (32 EEG channels plus three noise detector loop channels) bipolar input preamplifier was built to interface between the bipolar outputs from the filtration panel and a commercial, mono-polar EEG recorder (SynAmps2, CompuMedics, Charlotte, NC, settings: 1kHz sampling, DC recording with 250 Hz low-pass filtering). The preamplifier was also equipped with a circuit for reducing polarization of the carbon wire electrodes. The core of the preamplifier was an instrumentation amplifier (AD621, Analog Devices, Norwood, MA) that provided bipolar inputs and a gain of ten. The anti-polarization circuit worked by providing slowly changing negative feedback to the inputs of the instrumentation amplifier (Fig. 3). The anti-polarization circuit was designed not only to cancel out the DC input voltages to the amplifiers but also to prevent the build-up of the differential voltages at bipolar electrode pairs (see Appendix A for the operating principle of the anti-polarization circuit).
Fig. 3.
A schematic diagram of the pre-amplifier with an anti-polarization circuit for one differential input. The circuit consists of a differential amplifier (gain=10) and two negative feedback circuits with low-pass filtering.
2.1.5 Noise cancellation
Noise cancellation was carried out offline using an adaptive noise cancellation algorithm (Widrow et al. 1975) written in Matlab (MathWorks, Natick, MA). Adaptive noise cancellation works by predicting the noise in the contaminated signal from the noise-related input (called reference input) using adaptive filtering and subtracting the predicted noise from the noise-contaminated signal (called primary input). In the prototype EEG system, the noise cancellation algorithm worked independently on each bipolar EEG channel (as a primary input). Signals from the noise detector loops were used as reference inputs, and an adaptive filter computed the predicted noise by taking a weighted sum of reference signals time-shifted from −200 ms (milliseconds) to 200 ms in 1 ms steps (See Appendix B for details). No inputs from the electrodes themselves were used as reference signals in order to prevent, as much as possible, the noise cancellation algorithm from distorting the physiological signals.
2.2 Experiments
2.2.1 Potential drift
For this experiment and the next (section 2.2.2), a conductive plate was used to make the experiments more realistic without having to deal with subject movement and individual differences among human subjects. The conductive plate was a piece of acrylic plate (1 cm × 5 cm) coated with a 40%–60% mixture of carbon paste (CAIG Labs., Poway, CA) and white acrylic paint, on which a pair of test electrodes were placed 3.5 cm apart. To test the effectiveness of the anti-polarization circuit, the electrode potential was recorded from a pair of carbon wire electrodes that were coated with conductive gel and taped on the conductive plate. Signals were recorded through the RF filters and the preamplifier to the EEG recorder, but outside the MRI scanner in order to avoid artifacts caused by small electrode movements. Initially the electrode potentials were recorded with the anti-polarization circuit on, after which the output of the anti-polarization circuit (the point where the negative feedback was connected to the inputs from the electrodes) were disconnected. When the negative feedback was disconnected, the preamplifier reduced to a simple differential amplifier.
2.2.2 RF heating
RF heating of the carbon and Ag/AgCl electrodes was measured on a 3T scanner (Trio, Siemens Medical, Erlangen, Germany) using epoxy-coated thermocouples (5TC-PVC-E-24-180, Omega Engineering Inc., Stamford, CT). A turbo spin echo sequence with a large flip angle (TR:Repetition Time=67ms, TE:Echo Time=11ms, FA:Flip Angle=130, FoV:Field of View=300 mm, base resolution=256, echo train length=7) was used to obtain enough heating for the measurement. Both carbon wire electrodes and AgCl electrodes were put in rubber encasings (Compumedics, Charlotte, NC) that were filled with conductive paste. Although the carbon wire electrodes were not in rubber encasings in the prototype EEG cap (Fig. 2), this setting was used so that a direct comparison of the carbon and AgCl electrodes would be possible in the same electrochemical and thermal conditions. The conductive plate was placed on the tip of an epoxy rod that was used to keep the cables from the thermocouples straight in the MRI bore parallel to the B0 field, and the rod in turn was placed on a cylindrical water phantom. Since the fluctuation of the air temperature around the scanner was of the same scale as the RF heating, a reference thermocouple was placed on the epoxy rod 5cm apart from the electrode in addition to the measurement thermocouple that was placed at the electrode, and the difference in temperature between these two thermocouples is reported below. The thermocouple at the electrode was placed in the rubber electrode case, within the gel between the conductive plate and an electrode.
Thermocouples were first calibrated using a lab thermometer at room temperature and in ice water. Five runs of temperature measurements were conducted for both the carbon and Ag/AgCl electrodes, providing a total of ten measurement runs. Only one measurement was performed per day, and there was a ten minute waiting period between setting up the measurement and running the imaging sequence to allow the temperature to stabilize.
2.2.3 Susceptibility artifact
Susceptibility artifacts of an Ag/AgCl electrode (9 mm diameter, Compumedics, El Paso, TX), an Ag/AgCl coated carbon electrode (10 mm diameter, MVAP Medical Supplies, 30222), and a carbon wire electrode (9 mm diameter loop of CPVC4050, World precision Instruments) were measured on 1.5T and 3T MRI scanners (Sonata and Trio, Siemens Medical). The functional images were acquired with an echo-planar sequence (TR=3000 ms, TE=60 ms, FA=80, 20 slices×5mm thick, FoV=240 mm, base resolution=128, bandwidth=1302 Hz/pixel, with fat saturation). Four measurements with independent positioning were performed for each type of electrode at each scanner. In each measurement, one electrode was taped onto a spherical water phantom and gradient echo EPI images were obtained, from which only one image (the sixteenth image) was used for the analysis. After this set of images was complete, the electrode was removed and additional gradient echo EPI images were obtained with only the tape on the phantom, the sixteenth image of which was used as a reference image.
The image of an electrode was manually searched to find a line parallel to the y-axis (frontal-occipital axis) that showed the largest artifact. The image intensity along this line was compared with the image intensity along the line at the same position in the reference image. A program written in Matlab was used to quantify the amount of susceptibility artifact, defined here as the distance between half-intensity decay positions in the electrode and the reference images.
2.2.4 Electrode impedance
Electrode-electrolyte impedances of Ag/AgCl and carbon wire electrodes were measured at 30 Hz using an impedance bridge (Fig. 4). A function generator (33120A, Hewlett Packard, Palo Alto, CA) was used to supply a one-volt, 30 Hz sine wave to the bridge. For each electrode type, a pair of electrodes in rubber encasing filled with electrolyte gel were fixed facing each other using adhesive tape.
Fig. 4.
An impedance bridge used for electrode-electrolyte impedance measurement. The bridge has one input terminal that is connected to a pair of electrodes and the input of the preamplifier/anti-polarization circuit in parallel, and also has one output that is connected to an EEG amplifier. To measure the impedance, first the capacitor was selected to minimize the EEG recorder reading, and then the variable resistor was adjusted to further minimize the EEG recorder reading.
The electrodes were connected both to the preamplifier input and to the bridge in parallel so that electrode polarization would not affect the impedance measurement. For the impedance measurement, first the capacitor in the bridge, which could be changed only in one micro-farad increments, was selected to minimize the voltage at the EEG recorder, and the variable resistor was further adjusted to minimize the voltage. After the adjustment, the resistance of the variable resistor was measured using a circuit tester (34401A, Hewlett Packard).
2.2.5 ERP (Event-Related Potential) measurement
(1) Data acquisition
A visual ERP experiment was conducted to compare the quality of the EEG obtained with carbon wire electrodes to that obtained with Ag/AgCl electrodes. A two channel electrode EEG cap (2.1.1 (1)) was used to measure two bipolar signals from FP1-FPz and Pz-CPz carbon wire electrode pairs. For the measurement using Ag/AgCl electrodes, an EEG cap with Ag/AgCl electrodes was constructed with the same electrode positioning. The Ag/AgCl electrode cap was also equipped with a pair of beak-free electrodes for recording the ballistocardiogram. Since Ag/AgCl electrodes do not have the electrode polarization problem, the feedback paths for anti-polarization were disconnected during the measurements from the Ag/AgCl electrode cap. The EEG was obtained with and without simultaneous fMRI scanning. For the simultaneous EEG-fMRI recording, an echo-planar sequence (TR=1550 ms, TE=30 ms, FA=80, 25 slices × 6mm thick, FoV=240 mm, base resolution = 64, with fat saturation) was used. The EEG recording without fMRI imaging was conducted outside the MRI room.
The experiment was designed to elicit the P300 ERP (Sutton et al., 1965). The P300 is a parietally distributed EEG potential that occurs around 300 ms after rare occurrences of deviant stimului (called oddballs) embedded in frequent stimuli (called standards). The stimuli in our experiment consisted of oddballs (character strings “XXXXXX”, frequency: 15%) and standards (character strings “OOOOOO”, frequency: 85%), projected as white letter strings on a dark screen. The stimuli were presented in a random order with the stimulus onset asynchrony of one second and the stimulus duration of 250 ms. The experiment consisted of four runs, each of which consisted of 288 stimulus presentations (245 standards and 43 oddballs). A healthy right-handed male subject (age 52) participated in the experiment after informed consent (Yale University human investigation protocol number 11970).
(2) Data processing
EEG recorded simultaneously with the fMRI data acquisition was post-processed to remove the MR artifact and the ballistocardiogram. EEG acquired using the carbon wire electrodes was post-processed using the algorithm described in 2.1.5. EEG acquired using Ag/AgCl electrodes were processed using a temporal PCA based method (Negishi et al. 2004).
The EEG data was segmented into one-second epochs each of which contained a 200 ms pre-stimulus period and an 800 ms post-stimulus period. Epochs that included large movement artifacts (including eye movements) were manually identified by examining the EEG traces from the FP2-FPz electrode pair and were removed. Finally the EEG traces from the Pz-CPz electrodes in standard and deviant epochs were separately averaged after 25 Hz low-pass filtering. Also, to assess the mean noise level, variation of the EEG epochs from the averaged ERP was computed. The variance was obtained by taking difference waveforms between each EEG epoch and the mean ERP, taking root mean square voltage of the difference waveforms, and computing the mean across all epochs.
2.2.6 Recording from a 32 channel cap
In the experiments described above, up to two bipolar channels were used to examine the properties of the carbon wire electrodes. The main focus of this paper is to examine the properties of carbon wire electrodes, rather than to evaluate a larger scale system. However, there may be unforeseen problems when a larger number of electrodes are used. For instance, because the feedback used for anti-polarization is applied to pairs of bipolar electrodes, there is a possibility that multiple negative feedback loops formed by the subject’s head, cables and the safety circuit, and the preamplifier will cause instabilities. For this reason, a sample EEG was acquired from a 32 bipolar channel carbon wire EEG system (2.1.1 (2)) in a simultaneous EEG-fMRI experiment. The EEG was recorded from the same subject as in 2.2.5. In this experiment, the subject was instructed through headphones to open and close his eyes alternately every 30 seconds. The experiment consisted of two runs, each of which started with the subject’s eyes open and lasted for six minutes. The same set of fMRI parameters as 2.2.5 were used for the simultaneous fMRI recording.
3. Results
Results of the experiments described in 2.2.1 through 2.2.6 will be presented in 3.1 through 3.6 in the same order.
3.1 Potential drift
Fig. 5 shows an example of voltage change before and after detaching the anti-polarization circuit. The anti-polarization circuit was initially on and was detached at the zero second mark in the graph shown in Fig. 5. While the anti-polarization circuit was connected, the DC voltage drift was below the noise level (within 5 microvolts in a quiet but non-shielded room). Because the electrode polarization depends on incidental factors such as the imbalance of electrode surface conditions, electrode potential voltage changes were different from run to run after the anti-polarization circuit was disconnected.
Fig. 5.

An example of voltage drift before and after removing an anti-polarization circuit. Initially the voltage was measured with anti-polarization circuit connected, and the negative feedbacks were disconnected at zero seconds.
3.2 RF heating
Fig. 6 shows the temperature changes of an AgCl electrode (solid line) and a carbon wire electrode (broken line). The imaging sequence was turned on at 120 seconds and was turned off at 420 seconds. The temperatures shown are differences between the thermocouple readings at the electrode and those at the reference position. Temperatures were averaged over five runs, and the error bars show the standard deviations.
Fig. 6.

RF heating. Temperature changes at the AgCl (solid line) and Carbon (broken lines), relative to reference temperatures at reference thermocouples, were measured at a 3T scanner as a turbo spin echo imaging sequence was applied for five minutes (120 seconds to 420 seconds on the time axis). Averages of five runs for each type of electrodes are shown in the graph with errorbars showing standard deviations.
3.3 Susceptibility artifact
Table I shows the susceptibility artifact averaged over four measurements. Three rows correspond to three electrode types (Ag/AgCl, Ag/AgCl coated carbon, and carbon wire) and two columns correspond to the field strengths of the scanners (1.5T and 3T).
Table I.
Susceptibility artifacts averaged over four measurements in each condition. A summary of susceptibility artifacts measured from three electrode types (Ag/Agcl, Ag/AgCl coated carbon, and carbon wire) in two MRI imagers with different field strengths (1.5T and 3T) are shown.
| Scanner | 1.5T | 3T |
|---|---|---|
| Electrode | (mm) | (mm) |
| Ag/AgCl (9 mm diameter, Compumedics) | 6.1 | 9.4 |
| Ag/AgCl coated carbon (10 mm diameter, MVAP Medical Supplies, 30222) | 1.9 | 4.2 |
| Carbon wire (9 mm diameter loop) | 0.0 | 0.9 |
3.4 Electrode impedance
Table II shows the measured resistance and parallel capacitance of Ag/AgCl electrodes and carbon wire electrodes. The resistance values were corrected for the cable resistance. The resistance values were divided by two and the capacitance values were multiplied by two, since there were two electrode-electrolyte interfaces in series, which doubles the resistance and halves the capacitance.
Table II.
Electrode impedance. Electrode-electrolyte impedance (resistance and parallel capacitance) of a Ag/Agcl electrode and a carbon wire electrode is shown.
| Electrodes | Resistance (ohms) | Parallel capacitance (micro-farads) |
|---|---|---|
| Ag/AgCl (9 mm diameter) | 120 | 20 |
| Carbon wire (8 mm diameter loop) | 1900 | 4 |
3.5 ERP measurement
Plots in Fig. 7 show averaged responses to standard stimuli (broken lines) and oddball stimuli (solid lines). Fig. 7 (a) and (b) show ERP’s computed from EEG recorded with carbon wire electrodes with and without simultaneous fMRI recording, respectively. Fig. 7 (c) and (d) show ERP’s computed from Ag/AgCl EEG electrodes with and without simultaneous fMRI recording, respectively. Table III shows root mean square of deviation of the measured EEG epochs from the obtained ERP’s.
Fig. 7.

ERPs obtained from a Pz-CPz electrode pair from a single subject in a visual oddball experiment. In all plots, broken lines show responses to standard stimuli whereas solid lines show responses to oddball stimuli. (a) ERP computed from the outputs from carbon wire electrodes in an EEG-fMRI experiment after fMRI noise removal. (b) ERP computed from the outputs carbon wire electrodes in a standalone EEG experiment. (c) ERP computed from the outputs from Ag.AgCl electrodes in a standalone EEG-fMRI experiment after MRI noise removal. (d) ERP computed from the outputs from Ag/AgCl electrodes in an an EEG-fMRI experiment.
Table III.
Root mean squared error of visual ERP waveforms
| Stimulus | Carbon wire electrodes (microvolts) | Ag/AgCl electrodes (microvolts) | |
|---|---|---|---|
| With fMRI | Standard | 4.7 | 4.1 |
| Oddball | 4.9 | 4.6 | |
| Without fMRI | Standard | 2.4 | 2.5 |
| Oddball | 2.4 | 2.8 |
3.6 Recording from a 32 channel cap
Examples of EEG recorded in the eyes open-close experiment is shown in Fig. 8. The subject was instructed to close the eyes at one second (not the actual elapsed time in the experiment) in the top plot, and was instructed to open the eyes at 31 second in the bottom plot.
Fig. 8.

Examples of EEG at transitions from eyes-open to eyes-closed and eyes-closed to eyes-open. The subject was instructed to close the eyes at one second in the top plot and was instructed to close the eyes at 31 second in the bottom plot (not the actual time in the experiment). The instructions were given through headphones.
4. Discussion
Results of the experiments presented in 3.1 through 3.6 will be discussed in 4.1 through 4.6 in the same order, followed by a general discussion in 4.7.
4.1 Potential drift
Since the polarity and the amplitude of the potential drift varied from run to run, the EEG trace in Fig. 5 was only an anecdotal example of electrode polarization. However, the trace does reveal the nature of the anti-polarization effect. Specifically, after the removal of the negative feedback, the voltage smoothly changed from a small value to a large value. Because the pre-amplifier circuit reduced to a simple differential amplifier with no low-pass characteristics after detaching the anti-polarization circuit, this smooth transition indicates that before the feedback was removed, the circuit was not only canceling out the voltage at the input of the circuit but was also keeping the voltage difference at the electrodes small. This is significant, since this means that the circuit does not have to apply higher and higher voltage as the polarization process continues.
The slow-changing negative feedback that is used for anti-drift circuit is similar to that of the right-leg driver Winter and Webster 1983, which is used to reduce common mode noise. In a right-leg driver, a negative feedback is provided to the right leg or to a feedback-only electrode on the scalp so that the subject voltage becomes equal to the EEG amplifier ground. This keeps the overall DC offset of the EEG electrode outputs small, improving the common mode noise suppression of the differential amplifier. In the anti-polarization circuit, the negative feedback is provided to all EEG measuring electrodes. The effect is that not only do the overall DC offset of the EEG electrode outputs become small, but imbalance of the DC offsets among electrodes is suppressed (see Appendix A).
The feedback voltages do not pose a safety risk, since the anti-polarization circuit operates in the direction to reduce electrode currents. In addition, the EEG recording system includes a subject safety circuit that disconnects the electrode outputs in case there is excess current.
One drawback of the anti-polarization circuit is that it makes DC recording impossible. Thus an EEG system with the anti-polarization cannot be used for experiments that measure very slow potential drifts over ten seconds or longer. However, since the cutoff frequency of the feedback circuit is as low as 0.07 Hz, lack of DC recording capability is not an issue in most experiments that measure ERP or brain rhythms. For instance, the ERP components that are relevant to the experiment described in this work (2.2.5) are not affected by the anti-polarization circuit. Some researchers have suggested that AC recording is not suitable for simultaneous EEG-fMRI recording because of the long recovery time mostly visible in uneven acquisitions within a TR (Cohen 2001). An example of an EEG trace acquired in our EEG system during a highly uneven acquisition sequence (VASO sequence, TR=3 seconds) is shown in Fig. 9. Note that this is an EEG trace acquired during the first and the second TR’s of the MR sequence prior to stabilization. Since the cutoff frequency is lower than the volume acquisition frequency, there is no visible recovery or rebound in the EEG trace. Although theoretically there must be a recovery trend, since the trend should be consistent across volume acquisitions and the EEG waveform within one TR should be zero-sum, there is no reason to believe that it affects the noise removal process.
Fig. 9.

An EEG trace recorded during the first TR’s of a highly uneven MRI sequence (VASO, TR= 4 seconds).
4.2 Electrode impedance
The measured electrode-electrolyte impedance (both resistance and capacitive reactance) of the carbon wire electrode was larger than that of the Ag/AgCl electrode, consistent with the literature Shigemitsu et al. 1980; Spekhorst et al. 1988; Geddes et al. 2001). A higher resistance increases thermal noise and, more significantly, the noise induced through stray capacitance. However, the increase of the net output resistance of the cap/safety circuit is small, since there is already a current limiting resistor (16 kilo-ohms) for reducing the currents caused by the dynamic magnetic field. Moreover, the input resistance of the preamplifier is relatively high (3.3 mega-ohms), warranting the use of electrodes with this level of resistivity (Ferree et al., 2001).
4.3 Susceptibility artifact
Table I shows that the Ag/AgCl electrodes caused the largest susceptibility artifact, the Ag/AgCl coated nonmetallic electrodes caused an intermediate amount of susceptibility artifact, and the carbon wire electrodes caused the least amount of susceptibility artifact. This trend with different materials is consistent with a published measurement in a 1.5 scanner (Krakow et al. 2000). Table I also shows that the susceptibility artifact was larger for the 3T scanner than for the 1.5T scanner as expected. In all electrodes, the susceptibility artifact was less than 10 mm, and thus would not cause artifacts that penetrate beyond the dura matter. However, the artifact caused by the Ag/AgCl electrodes was 9.4 mm on the 3T scanner, and it is likely that the distortion would extend to the cortex in a higher field MRI.
4.4 RF heating
The RF heating in this setting was less than 0.1 degrees Celsius in both types of electrodes, even though an imaging sequence with an unrealistically large flip angle was used. Because the experimental setting was very different from human experiments, we cannot estimate the specific absorption rate. However, it is clear from the Fig. 6 that in this particular setting the carbon wire electrode caused lower RF heating. During 160 seconds to 300 seconds, during which the heating rates (degrees per second) in both electrode types were at their maximums, the heating rate of the AgCl electrodes was 1.7 times larger than that of the carbon wire electrodes.
In our system, current limiting resistors are located in the patient safety circuit rather than at the electrodes. It may be argued that the positioning of the resistor is inappropriate, since the RF current is not homogeneous along the EEG leads. However, it has been reported that lumped current limiting resistors, as opposed to distributed resistance, are not effective in reducing RF heating (Angelone et al. 2005). Therefore we employed carbon wires for the RF heating issue, using current limiting resistors only for reducing gradient switching related currents.
Bonmassar (Bonmassar 2004; Vasios et al. 2006) used conductive ink for making electrodes and leads on his “InkCap” to reduce RF heating. An electrode on the InkCap is a composite of blended silver/carbon ink printed on a polymer film and Ag/AgCl printed on a vinyl paper. The leads are made of tapered resistive striplines (RTS), which also make use of conductive ink. The RTS have impedance discontinuities along the lead, which give rise to inductance that limits the RF currents. Thus the RTS can block RF artifacts without affecting low frequency signals, whereas the relatively high resistance of carbon wires affects all frequency ranges. However, since both the RTS-based and the carbon wire-based EEG systems require current limiting resistors to reduce the current induced by the gradient changes, both systems will have the same amount of resistance in the low frequency range that is usually relevant for EEG recording (below 100 Hz). Although the InkCap uses Ag/AgCl, the mass of the metal is so small that it does not cause a visible susceptibility artifact in the 7T scanner (Vasios et al. 2006). They also report a good quality EEG despite the use of carbon in the electrode, possibly because of the Ag/AgCl layer in the electrode. It should also be pointed out that unlike carbon wire electrodes, DC recording is possible with the InkCap.
4.5 ERP measurement
In all four plots in Fig. 7, the oddball ERP shows clear negativity at around 200 milliseconds (N200) and clear positivity between 200 and 400 milliseconds after stimulus onsets (P300), demonstrating that the prototype EEG system has enough sensitivity to capture cognitive ERP components in a simultaneous EEG-fMRI experiment with a reasonable number of averaged epochs (less than 100 averaging for oddballs). On the other hand, closer examination reveals differences among the four plots, indicating room for further improvements. For instance, in Fig. 7 (b) (with fMRI, carbon wire electrodes), the latency of the N200 is slightly later compared to other cases. Also in Fig. 7 (c) (with fMRI, Ag/AgCl electrodes), the ERP corresponding to the standards has a lower amplitude at 300–400 ms. Table III shows that measurements using carbon wire and Ag/AgCl electrodes have comparable amounts of noise. The noise increases about two microvolts in the EEG obtained and processed from simultaneous EEG-fMRI experiments. One of major sources of variations in the ERP may be small subject motion in the static magnetic field, which can be reduced by the use of a vacuum pillow (Anami et al. 2002, Benar et al. 2003).
In the ERP experiment, an adaptive noise cancellation algorithm was used to remove the scanner noise in the EEG signal instead of the widely used average waveform subtraction (Allen et al. 2000) or its variations (e.g. Negishi et al. 2004). In adaptive noise cancellation, noise is predicted using reference signals and is removed from the measured signal. In the current system, signals from the noise detection loops are used as reference signals. Average waveform subtraction algorithms, based on the fact that the gradient noise waveform is the same for every image acquisition, computes an averaged noise waveform and subtracts it from the measured signals. Since the gradient noise is very high in amplitude compared to the EEG signals of interest and contains high frequency components, a slight difference in EEG sampling timing results in different artifact waveforms (Cohen 2001). Therefore, the average waveform subtraction requires either perfect synchronization between scanning and EEG sampling (Anami et al. 2003), or a very high EEG sampling rate combined with an EEG sampling timing correction algorithm (Cohen 2001). This problem is reduced in the case of an adaptive noise cancellation algorithm used here, provided that the EEG channels assigned to electrodes and those assigned to noise detection loops are sampled at the same time in the EEG recorder. The simultaneous sampling of all channels guarantees that any timing shifts affect the instantaneous amplitudes of both the measured signals and reference signals.
Adaptive noise cancellation has been used for removing the ballistocardiogram from EEG obtained during fMRI (Bonmassar et al. 2002). In fact, ballistocardiogram artifact was removed together with the gradient artifacts in our ERP experiment, since the noise detector loops also detect the ballistocardiogram signals.
4.6 Recording from a 32 channel cap
Fig. 8 clearly shows the start and the end of large amplitude alpha wave centered around the occipital electrodes, each following an eye movement artifact in the frontal electrodes. The root mean square of the EEG voltages during the eyes-open period, after rejecting periods of movement artifacts, was 10.6 microvolts. This can be considered as a normal background EEG amplitude, but probably also includes some non-neurophisiological noise that could be reduced, as discussed in 4.5. There was no sign of problems in EEG signals associated with the increased number of electrodes.
4.7 General remarks and future directions
Note that we are not claiming that the carbon wire electrodes provide better EEG quality than metallic EEG electrodes. Instead this paper focused on the safety issue and imaging quality, and explained the anti-polarization circuit that makes the use of carbon wire electrodes feasible. We plan to implement an online version of the automatic noise cancellation algorithm and to evaluate the system in a higher field imaging system.
5. Summary
The results presented in this paper show that carbon wire electrodes are suitable for use in the simultaneous EEG-fMRI recording, and may have particular advantage when imaging at high field since they cause less imaging artifacts and heating than metallic electrodes. Although carbon fiber electrodes have higher electrode-electrolyte impedance than Ag/AgCl electrodes, they were demonstrated to yield high quality EEG signals in a simultaneous EEG-fMRI experiment. It was also shown that three mutually orthogonal sensor loops on the EEG cap could be used for eliminating gradient and ballistocardiogram artifacts.
Acknowledgements
The authors would like to thank Dr. Roberto Martuzzi for his help in scanning the subject. This work was partially supported by NIH R01 NS047605.
Appendix A. Anti-polarization effect
To explain the operation principle of the anti-polarization circuit, an equivalent circuit of a pair of electrodes and the anti-polarization circuit is shown in Fig. 10. Vp in the figure is the output voltage of the electrode pair. To the left of Vp is an equivalent circuit of an electrode, consisting of the potential VE caused by an imbalance in the electrodes, electrode resistances RE, and accumulation and discharge characteristics of the polarization voltage represented by C and RC. To the right of Vp is an equivalent circuit of the anti-polarization circuit, consisting of lead resistances RL, input impedances of the preamplifier RI, Feedback resistors RF, and output voltages of the feedback circuit VF. VI corresponds to the input voltages of the preamplifier.
Fig. 10.
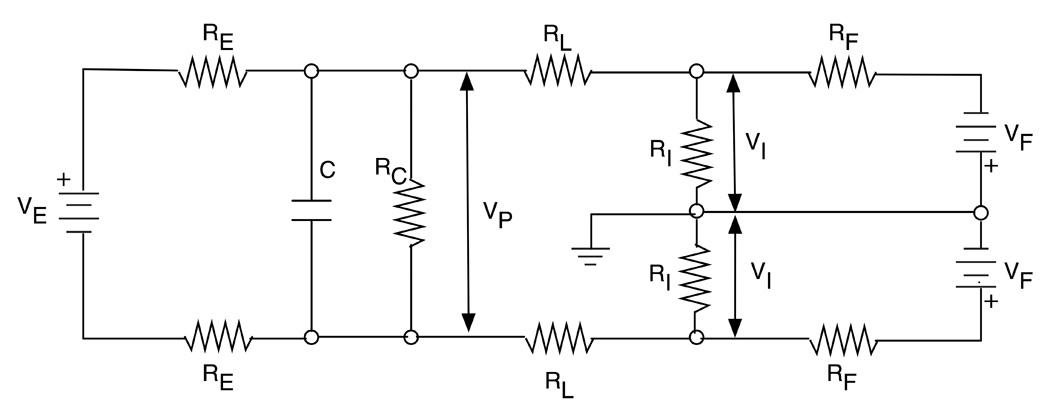
An equivalent circuit of a carbon electrode pair and an anti-polarization circuit. To the left of the Vp (electrode potential) is an equivalent circuit of a pair of electrodes, and to the right is an equivalent circuit of EEG leads and the anti-polarization circuit.
The purpose of the anti-polarization circuit is to keep the DC voltage VP zero by providing proper feedback voltages VF. It can be shown that by writing equations for four loops in the circuit and setting VP =0, the gain of the feedback circuit VF/VI, can be obtained as follows.
| (1) |
By applying negative feedback with this gain, accumulation of charges at the electrodes can be prevented.
Appendix B. Adaptive noise cancellation algorithm
This section provides a mathematical description of the noise cancellation algorithm used for the noise removal. Let Y be a matrix that contains values of the noise detector loops (a column vector of Y is a vector of noise detector loop outputs at a time, and a row vector is a time series of output from one detector), a (Tp + Tf + 1) × M weight matrix for electrode i after n-th optimization steps where Tp and Tf are the number of timepoints to the past and to the future used for noise cancellation respectively and M is the number of noise detector loops, and xi(t) the output from an electrode i at time t. Then the signal after noise removal from the i-th electrode pair after n iterations is computed as
| (2) |
and the weight matrix W is updated as
| (3) |
where α is a weight adaptation constant and N is the number of EEG channels. Formula (2) and (3) are evaluated for all timepoints and are repeated incrementing n starting from 1 until the rate of change in the outputs after noise removal becomes smaller than a threshold r
| (4) |
where T is the number of timepoints in the measurement. In the current implementation, Tp=Tf=100, α=0.0005/sum(var(YT)), and r=0.001.
Footnotes
Publisher's Disclaimer: This is a PDF file of an unedited manuscript that has been accepted for publication. As a service to our customers we are providing this early version of the manuscript. The manuscript will undergo copyediting, typesetting, and review of the resulting proof before it is published in its final citable form. Please note that during the production process errors may be discovered which could affect the content, and all legal disclaimers that apply to the journal pertain.
References
- Allen PJ, Josephs O, Turner R. A method for removing imaging artifact from continuous EEG recorded during functional MRI. NeuroImage. 2000;12:230–239. doi: 10.1006/nimg.2000.0599. [DOI] [PubMed] [Google Scholar]
- Anami K, Saitoh O, Yumoto M. Reduction of ballistocardiogram with a vacuum head-fixating system during simultaneous fMRI and multi-channel monopolar EEG recording. Int. Congr. Se. 1232, Recent Adv. Hum. Brain Mapp. 2002;1232:427–431. [Google Scholar]
- Anami K, Mori T, Tanaka F, Kawagoe Y, Okamoto J, Yarita M, Ohnishi T, Yumoto M, Matsuda M, Saitoh O. Stepping stone sampling for retrieving artifact-free electroencephalogram during functional magnetic resonance imaging. NeuroImage. 2003;19:281–295. doi: 10.1016/s1053-8119(03)00048-x. [DOI] [PubMed] [Google Scholar]
- Angelone LM, Potthast A, Segonne F, Iwaki S, Bonmassar G. Metallic electrodes and leads in simultaneous EEG-fMRI: A specific absorption rate (SAR) simulation studies. Bioelectromagnetics. 2004;25:285–295. doi: 10.1002/bem.10198. [DOI] [PubMed] [Google Scholar]
- Angelone LM, Vasios C, Purdon A, Wiggins G, Purdon P, Bonmassar G. On the use of resistance on the EEG leads: SAR and temperature study. Proc Intl Soc Magn Reson Med. 2005;13:611. [Google Scholar]
- Van Audekerke J, Peeters R, Verhoye M, Sjibers J, Van der Linden A. Special designed RF-antenna with integrated non-invasive carbon electrodes for simultaneous magnetic resonance imaging and electroencephalography acquisition at 7T. Magn Reson Imaging. 2000;18:887–891. doi: 10.1016/s0730-725x(00)00172-7. [DOI] [PubMed] [Google Scholar]
- Baudewig J, Bittermann HJ, Paulus W, Frahm J. Simultaneous EEG and functional MRI of epileptic activity: a case report. Clin Neurophysiol. 2001;112(7):1196–1200. doi: 10.1016/s1388-2457(01)00562-4. [DOI] [PubMed] [Google Scholar]
- Bénar CG, Aghakhani Y, Wang Y, Izenberg A, Al-Asmi A, Dubeau F, Gotman J. Quality of EEG in simultaneous EEG-fMRI for epilepsy. Clin Neurophysiol. 2003;114:569–580. doi: 10.1016/s1388-2457(02)00383-8. [DOI] [PubMed] [Google Scholar]
- Bonmassar G. Resistive tapered stripline (RTS) in electroencephalogram recordings during MRI. IEEE Trans Microwave Theory Tech. 2004;52(8):1992–1998. [Google Scholar]
- Bonmassar G, Anami K, Ives J, Belliveau JW. Visual evoked potential (VEP) measured by simultaneous 64-channel EEG and 3T fMRI. NeuroReport. 1999;10:1893–1897. doi: 10.1097/00001756-199906230-00018. [DOI] [PubMed] [Google Scholar]
- Bonmassar G, Purdon PL, Jääskeläinen IP, Chiappa C, Emery VS, Belliveau JW. Motion and ballistocardiogram artifact removal for interleaved recording of EEG and EPs during MRI. NeuroImage. 2002;16:1127–1241. doi: 10.1006/nimg.2002.1125. [DOI] [PubMed] [Google Scholar]
- Cohen MS, Goldman RI, Engel J., Jr Simultaneous EEG and fMRI made easy. Proc. Organization for Human Brain Mapping; Brighton, UK. 2001. Abstract #6. [Google Scholar]
- Feige B, Scheffler K, Esposito F, Di Salle F, Henning J, Seifritz E. Cortical and subcortical correlates of electroencephalographic alpha rhythm modulaton. Journal of Neurophysiology. 2005;93:2864–2872. doi: 10.1152/jn.00721.2004. [DOI] [PubMed] [Google Scholar]
- Ferree TC, Luu P, Russell GS, Tucker DM. Scalp electrode impedance, infection risk, and EEG quality. Clin Neurophysiol. 2001;112(3):536–544. doi: 10.1016/s1388-2457(00)00533-2. [DOI] [PubMed] [Google Scholar]
- Geddes LA. Electrodes and the measurement of bioelectric events. New York: John Wiley & Sons; 1972. Chapter 1. [Google Scholar]
- Geddes LA, Roeder R. Measurement of he Direct-Current (Faradic) resistance of the electrode-electrolyte interface for commonly used electrode materials. Ann Biomed Eng. 2001;29(2):181–186. doi: 10.1114/1.1349699. [DOI] [PubMed] [Google Scholar]
- Goldman RI, Stem JM JM, Engel J, Jr, Cohen MS. Acquiring simultaneous EEG and functional MRI. Clin Neurophysiol. 2000;111:1974–1980. doi: 10.1016/s1388-2457(00)00456-9. [DOI] [PubMed] [Google Scholar]
- Goldman RI, Stern JM, Engel J, Jr, Cohen MS. Simultaneous EEG and fMRI of the alpha rhythm. Neuroreport. 2002;13:2487–2492. doi: 10.1097/01.wnr.0000047685.08940.d0. [DOI] [PMC free article] [PubMed] [Google Scholar]
- Krakow K, Allen PJ, Symms MR, Lemieux L, Josephs O, Fish DR. EEG recording during fMRI experimrnts: Image quality. Hum Brain Mapp. 2000;10:10–15. doi: 10.1002/(SICI)1097-0193(200005)10:1<10::AID-HBM20>3.0.CO;2-T. [DOI] [PMC free article] [PubMed] [Google Scholar]
- Krakow K, Woermann FG, Symms MR, Allen PJ, Lemieux L, Baker GJ, Duncan JS, Fish DR. EEG-triggered functional MRI of interictal epleptiform activity in patients with partial seizures. Brain. 1999;122:1679–1688. doi: 10.1093/brain/122.9.1679. [DOI] [PubMed] [Google Scholar]
- Kruggel F, Wiggins CJ, Hermann CS, von Cramon DY. Recording of the event-related potentials during functional MRI at 3.0 Tesla field strength. Magn Reson Med. 2000;44:277–282. doi: 10.1002/1522-2594(200008)44:2<277::aid-mrm15>3.0.co;2-x. [DOI] [PubMed] [Google Scholar]
- Laufs H, Kleinschmidt A, Beyerle A, Eger E, Salek-Haddadi A, Prebisch C, Krakow K. EEG-correlated fMRI of human alpha activity. Neuroimage. 2003;19:1463–1476. doi: 10.1016/s1053-8119(03)00286-6. [DOI] [PubMed] [Google Scholar]
- Lemieux L, Allen PJ, Franconi F, Symms MR, Fish DR. Recording of EEG during Fmri experiments: Patient safety. Magn Reson Med. 1997;38:943–952. doi: 10.1002/mrm.1910380614. [DOI] [PubMed] [Google Scholar]
- Lemieux L, Salek-Haddadi A, Josephs O, Allen P, Toms N, Scott C, Krakow K, Turner R, Fish DR. Event-related fMRI with simultaneous and continuous EEG: description of the method and initial case report. NeuroImage. 2001;14:780–787. doi: 10.1006/nimg.2001.0853. [DOI] [PubMed] [Google Scholar]
- Liebenthal E, Ellingson ML, Spanaki MV, Prieto TE, Ropella KM, Binder JR. Simultaneous ERP and fMRI of the auditory cortex in passive oddball paradigm. NeuroImage. 2003;19:1395–1404. doi: 10.1016/s1053-8119(03)00228-3. [DOI] [PubMed] [Google Scholar]
- Moosmann M, Ritter P, Krastel I, Brink A, Thees S, Blankenburg F, Taskin B, Obrig H, Villinger A. Correlates of alpha rhythm in functional magnetic resonance imaging and near infrared spectroscopy. NeuroImage. 2003;20:145–158. doi: 10.1016/s1053-8119(03)00344-6. [DOI] [PubMed] [Google Scholar]
- De Munck JC, Goncalves SI, Huijboom L, Kuijer JPA, Pouwels PJW, Heethaar RM, Lopes da Silva FH. The hemodynamic response of the alpha rhythm: An EEG/fMRI study. NeuroImage. 2007;35(3):1142–1151. doi: 10.1016/j.neuroimage.2007.01.022. auditory processing: A review. Clin Neurophysiol 2007, in Press. [DOI] [PubMed] [Google Scholar]
- Negishi M, Abildgaard M, Nixon T, Constable RT. Removal of time-varying gradient artifacts from EEG data acquired during continuous fMRI. Clin Neurophysiol. 2004;115:2181–2192. doi: 10.1016/j.clinph.2004.04.005. [DOI] [PubMed] [Google Scholar]
- Negishi M, Constable RT. Origin of the radiofrequency pulse artifact in EEG-fMRI recording: The carbon-metal interface. IEEE Trans Biomed Eng. 2007;115:2181–2192. doi: 10.1109/TBME.2007.891940. [DOI] [PMC free article] [PubMed] [Google Scholar]
- Opitz B, Schröger E, von Cramon DY. Sensory and cognitive mechanisms for preattentive change detection in auditory cortex. Eur J Neurosci. 2005;21:531–535. doi: 10.1111/j.1460-9568.2005.03839.x. [DOI] [PubMed] [Google Scholar]
- Salek-Haddadi A, Mershhemke AM, Lemieux L, Fish DR. Simultaneous EEG-correlated ictal fMRI. NeuroImage. 2002;16:32–40. doi: 10.1006/nimg.2002.1073. [DOI] [PubMed] [Google Scholar]
- Seeck M, Lazeyras F, Michel CM, Blanke O, Gericke CA, Ives J, Delavelle J, Golay X, Haenggeli CA, de Tribolet N, Landis T. Non-invasive epileptic focus localization using EEG-triggered functional MRI and electromagnetic tomography. Electroencephalogr Clin Neurophysiol. 1998;106:508–512. doi: 10.1016/s0013-4694(98)00017-0. [DOI] [PubMed] [Google Scholar]
- Shigemitsu T, Nagata T, Matsumoto G, Tsukahara S. Electrical properties of the carbon fibre electrode and its application. Med & Biol Eng & Comput. 1979;18:359–362. doi: 10.1007/BF02443392. [DOI] [PubMed] [Google Scholar]
- Sommer M, Meinhardt J, Volz HP. Combined measurement of event-related potentials (ERPs) and fMRI. Acta Biol Exp. 2003;63:49–53. doi: 10.55782/ane-2003-1454. [DOI] [PubMed] [Google Scholar]
- Spekhorst H, Sippensgroenewegen A, David GK, Van Rijn CM, Broekhuijsen P. Radiotransparent carbon electrode for ECG recordings in the catheterization laboratory. IEEE Trans Biomed Eng. 1988;35(5):402–406. doi: 10.1109/10.1402. [DOI] [PubMed] [Google Scholar]
- Stevens TK, Ives JR, Klassen LM, Bartha R. MR compatibility of EEG scalp electrodes at 4 Tesla. J Magn Reson. 2007;25:872–877. doi: 10.1002/jmri.20872. [DOI] [PubMed] [Google Scholar]
- Sutton S, Braren M, Zubin J, John ER. Evoked-Potential Correlates of Stimulus Uncertainty. Science. 1965;150(3700):1187–1188. doi: 10.1126/science.150.3700.1187. [DOI] [PubMed] [Google Scholar]
- Vasios CE, Angelone LM, Purdon PL, Ahveninen J, Belliveau JW, Bonmassar G. EEG/(f)MRI measurements at 7 Tesla using a new EEG cap (“InkCap”) NeuroImage. 2006;33:1082–1092. doi: 10.1016/j.neuroimage.2006.07.038. [DOI] [PubMed] [Google Scholar]
- Warach S, Ives JR, Schlaug G, Patel MD, Darby DG, Thangaraj V, Edelman RR, Schomer DL. EEG-triggered echo-planer functional MRI in epilepsy. Neurology. 1996;47:89–93. doi: 10.1212/wnl.47.1.89. [DOI] [PubMed] [Google Scholar]
- Widrow B, Glover JR, McCool JM, Kaunitz J, Williams CS, Hearn RH, Zeilder JR, Dong EFJ, Jr, Goodlin RC. Adaptive noise cancellation: principles and applications; Proc. IEEE; 1975. pp. 1692–1716. [Google Scholar]
- Winter B, Webster J. Driven-right-leg circuit design. IEEE Trans Biomed Eng Comput. 1982;20:248–250. doi: 10.1109/tbme.1983.325168. [DOI] [PubMed] [Google Scholar]