Abstract
A mathematical model is presented for growth and remodeling of arteries. The model is a thick-walled tube composed of a constrained mixture of smooth muscle cells, elastin and collagen. Material properties and radial and axial distributions of each constituent are prescribed according to previously published data. The analysis includes stress-dependent growth and contractility of the muscle and turnover of collagen fibers. Simulations were conducted for homeostatic conditions and for the temporal response following sudden hypertension. Numerical pressure-radius relations and opening angles (residual stress) show reasonable agreement with published experimental results. In particular, for realistic material and structural properties, the model predicts measured variations in opening angles along the length of the aorta with reasonable accuracy. These results provide a better understanding of the determinants of residual stress in arteries and could lend insight into the importance of constituent distributions in both natural and tissue-engineered blood vessels.
1 Introduction
One of the primary goals of tissue engineering is to develop methods to construct tissues and organs in vitro. To do this, one must not only understand the biochemical environment in which these organs develop, but the biomechanical environment as well. The vasculature is a convenient system for studying the response of tissues to changing mechanical loads. In response to acute changes in blood flow rate, for example, many arteries actively contract or dilate to maintain a constant fluid shear stress on the endothelium (Johnson, 1981; Holtz et al., 1984). Due to a chronic increase in systemic blood pressure, arteries thicken (Matsumoto and Hayashi, 1996; Fung and Liu, 1991) and their residual stress patterns change (Fung and Liu, 1989), presumably to restore homeostatic wall stress distributions. Knowledge of the behavior of blood vessels could be extended to more complex organs such as the heart.
Long-term changes in arterial structure are achieved via two main processes: smooth muscle growth and collagen remodeling. Olivetti et al. (1980) showed that hypertension induced by aortic coarctation causes an increase in smooth muscle cell volume. Nissen et al. (1978) found that the half-life of collagen decreases almost four fold in response to chronic hypertension.
Mathematical models are important tools in studies of the biomechanics of growth and remodeling. Several mathematical models for growth and remodeling of arteries have been published during the last decade. These include thick-walled models for growth (Taber and Eggers, 1996; Taber, 1998; Rachev et al., 1998; Taber and Humphrey, 2001) and a thin-walled model that includes collagen turnover but does not account for residual stress (Gleason et al., 2004; Gleason and Humphrey, 2005). Here, we present a thick-walled constrained mixture model that includes smooth muscle growth and contraction, collagen remodeling, and residual stress. In developing this model, we have used experimental data to minimize the number of free parameters and to independently test model predictions. In general, the results given by the model agree well with measured variations in geometry, pressure-radius relations, and residual stress (opening angles) under normal and perturbed loading conditions.
2 Model
The artery model is a pressurized tube composed of a mixture of smooth muscle cells, elastin, and collagen, each with a separate set of material properties. The relative distributions of the constituents vary radially and axially along the length of the artery. The analysis of the model is based on the following assumptions:
The wall constituents are pseudoelastic and incompressible. Elastin and collagen are one-dimensional passive fibers, while smooth muscle is a transversely isotropic material that undergoes active contraction in the circumferential direction.
The growth rate of smooth muscle depends on its local state of stress and on the fluid shear stress on the endothelium (Taber, 1998). At the homeostatic state, the circumferential stress of smooth muscle is uniform.
Collagen turns over in the manner described by Gleason et al. (2004), where old collagen decays exponentially in time and the initial stretch of each new collagen fiber is a specified constant value.
Shortly after birth, elastin remodeling ceases (Davis, 1993; Lefevre and Rucker, 1980). Any subsequent artery growth only stretches elastin further from its zero-stress state.
The growth and remodeling laws for each constituent are the same regardless of the artery, or the position of the material within the artery. Mechanical variations between arteries depend only on spatial distributions of the constituents.
Material properties for collagen and elastin are based on previously published data, and properties for smooth muscle are determined using experimental pressure-radius curves for a central location along the aorta. Parameters in the growth and remodeling laws are found using data from a similar aortic location. Distributions of the constituents are determined from published histology data (Bunce, 1974). Details are given below.
3 Analysis
The present model essentially extends the arterial growth model of Taber (1998) to include remodeling of individual wall constituents, as in the membrane model of Gleason et al. (2004). The artery wall is treated as a constrained mixture, in which all constituents in the mixture are assumed to deform and move together.
This paper presents two separate but related models. The first (homeostatic) model is used to study the behavior of an artery at mechanical, growth, and remodeling equilibrium. For this model, it is not important how the artery arrives at its equilibrium state. Collagen turnover is assumed to be at steady state, and smooth muscle growth must satisfy the assumption of uniform muscle stress. The second (time-dependent) model is used to study the evolving stress state of the artery due to changes in loading conditions. For this model, the stress state is path dependent due to time-dependent growth and remodeling. The governing equations are the same for both models, but growth and remodeling in the time-dependent model are determined through specified growth and remodeling laws.
3.1 Theory for Growth and Remodeling
We combine the theory for volumetric growth of Rodriguez et al. (1994) and the theory for matrix remodeling of Humphrey and Rajagopal (2002), with smooth muscle contraction included by the method of Taber (2000). The formulation is based on the concept of evolving natural (zero-stress) configurations for each tissue component. Tissue is treated as a mixture of cells, water and solid ECM constituents (collagen and elastin), with the cells being a scaffold on which ECM constituents are synthesized. The cells grow and change shape as the ECM remodels via turnover of individual constituents. As the tissue develops, old constituents (which were produced at a uniform assumed initial stress) deform with the cells and gradually degrade. With time, new constituents appear, we assume, with the same initial stress as the old ones.
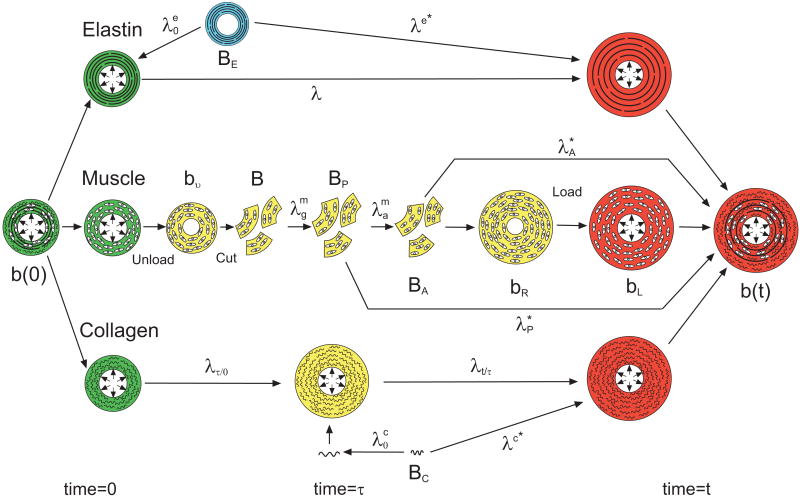
The loaded homeostatic state is chosen as the reference configuration, denoted as the body b(0) at time t = 0 (Fig. 1).1 It is convenient to treat the wall constituents separately, but they are assumed (i.e., constrained) to undergo the same deformation during loading.
Figure 1.
Configurations for growth and remodeling. Each constituent (smooth muscle, elastin, and collagen) has its own natural (stress-free) configuration. Stress-free configurations are denoted by capital B's; stressed configurations are denoted by lower case b's. Stretch ratios are denoted by λ's. See text for details. In this figure, green denotes states at time = 0; red denotes states at time = t; yellow states occur at time τ where 0 ≤ τ ≤ t; and blue denotes a state that occurred at a time < 0.
For smooth muscle, imagine that b(0) is unloaded into bυ and then dissociated into infinitesimally small pieces, or individual cells, giving configuration B, which is assumed to be approximately stress free (Fig. 1). The cells then grow and actively contract through the muscle growth and activation stretch ratios ( and ; i = r, θ, z), establishing the passive and active zero-stress states (BP and BA). Next, the cells are reassembled into the body bR, which usually contains residual stress. Finally, a pressure load is added to produce the body bL.
Collagen and elastin are taken as one-dimensional fibers attached to the cells. In this model, elastin turnover is neglected and the initial stretch of elastin fibers is specified at the homeostatic state (t = 0), relative to the elastin zero-stress state BE (Fig. 1). Old collagen is continually degrading while new collagen is being added at each intermediate time τ, where 0 < τ ≤ t (Fig. 1). The initial stretch of new collagen is also specified, relative to the collagen zero-stress state BC. After initial production, elastin and collagen fibers undergo the additional stretch ratios λ and λt/τ, respectively, due to loading and cell growth (Fig. 1).
3.2 Deformation and Mechanical Equilibrium
3.2.1 Loaded Artery
The deformation of the loaded artery b(t) in the current state, relative to the homeostatic state b(0), is described by the mapping
| (1) |
for uniform inflation of a cylinder, where (R, Θ, Z) and (r, θ, z) are the cylindrical polar coordinates of a point in b(0) and b(t), respectively. Associated stretch ratios are
| (2) |
The equation of radial equilibrium is
| (3) |
where σi are Cauchy stresses. The boundary conditions are σr(r1, t) = −Pi(t) and σr(r2, t) = 0, where Pi is the internal blood pressure, and r1 and r2 are the inner and outer radii of the loaded artery. Unless specified otherwise, the internal pressure is taken as Pi = 16 kPa, and the volumetric blood flow rate is Q = 1400 mm3/s. To a first approximation, Poiseuille flow gives the average endothelial fluid shear stress
| (4) |
where μ is the viscosity of blood (3 cP).
3.2.2 Unloaded Artery
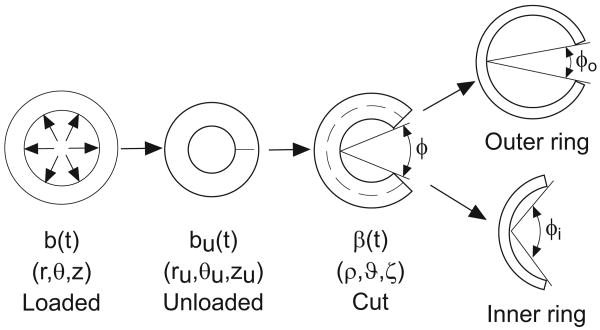
The deformation of the unloaded configuration bu(t) relative to b(t) is described by the coordinate mapping (Fig. 2)
Figure 2.
Schematic of opening angle experiments. Growth and remodeling in the loaded state (b) produce residual stress in the unloaded state (bu). When a transmural cut is made in the unloaded artery, relief of residual stress results in the opening angle (φ). When a circumferential cut (dashed line) is followed by a radial cut, the inner and outer rings open to different opening angles.
| (5) |
The corresponding stretch ratios are given by
| (6) |
which satisfy the incompressibility condition λrλθλz = 1. In bu, the internal pressure and axial load are zero. The equations of radial and axial equilibrium are
| (7) |
| (8) |
where ru1 and ru2 are the inner and outer radii of the unloaded artery, respectively. The boundary conditions are σru (ru1) = σru (ru2) = 0.
3.2.3 Cut Artery
When a single radial cut is made in an unloaded artery bu(t), the cross section opens into an approximately circular sector with an opening angle φ (Fig. 2). Let β(t) be the configuration of the cut artery. Then, the deformation of β(t) relative to the loaded configuration b(t) is defined by
| (9) |
where (ρ, ϑ, ζ) are the coordinates in β(t), and φo = π − φ (Taber and Humphrey 2001). The stretch ratios of the cut state relative to the loaded state at t are
| (10) |
which satisfy the incompressibility condition λρλϑλζ = 1. The equations of radial force, axial force, and moment equilibrium are, respectively,
| (11) |
| (12) |
where ρ1 and ρ2 are the respective inner and outer radii of the cut artery. The boundary conditions are σρ(ρ1) = σρ(ρ2) = 0.
3.3 Material Constitutive Laws
Let be the stretch ratio of constituent j in the direction i relative to its zero-stress state (Fig. 1). For an incompressible pseudoelastic material, the constitutive equations for the partial Cauchy stresses are
| (13) |
where j represents elastin (e), collagen (c), or smooth muscle (m). In addition, is the strain-energy density function for the constituent j, and p is a Lagrange multiplier, which includes the contribution of water to the stress. The total stress of the mixture is given by
| (14) |
where φj is the volume fraction of constituent j.
The strain-energy density function for elastin is taken in the form
| (15) |
where Cel is a material constant. Here, λe∗ is the stretch ratio along an elastin fiber, computed relative to its zero-stress state BE (Fig. 1). The strain-energy density function for collagen is taken as
| (16) |
where μc and ac are material constants and λc∗ is the stretch ratio along a collagen fiber, relative to the zero-stress state BC (Fig. 1). Note that the strain-energy density functions for elastin and collagen are based on the exact solution for a three-dimensional fiber, rather than a one-dimensional fiber.
Vascular smooth muscle is taken as transversely isotropic relative to the circumferential direction. The partial stress of the muscle includes passive ( ) and active ( ) components, i.e. . As suggested by Holzapfel (2000), the passive strain-energy density function is
| (17) |
where Cm, k1, and k2 are material constants, and is the first strain invariant, with computed relative to the passive zero-stress state BP (Fig. 1).
For circumferentially oriented smooth muscle fibers, the active stress is given by σra = σza = 0 and
| (18) |
Here, (see Fig. 1) and is the maximum passive stretch at which contraction is still possible. The active modulus Ca increases from zero for passive muscle ( ) to a maximum value Ca max for maximum contraction ( ). Accordingly, we take
| (19) |
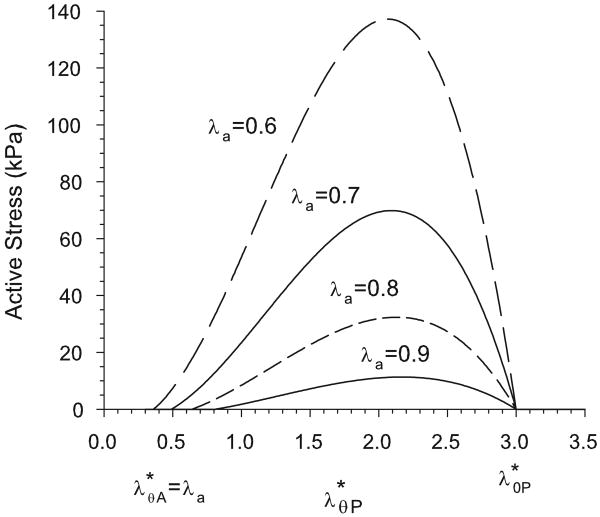
Equation (18) gives the characteristic parabolic active stress seen experimentally by Cox (1975) (Fig. 3). Contractile homeostasis (normal muscle tone) is defined by .
Figure 3.
Active stress as a function of stretch ratio relative to the passive zero-stress state, as given by Eq. (18). Curves are shown for values of the activation stretch ratio λa ranging from 0.9 (normal tone) to 0.6 (maximum contraction). Note that active stress is zero when or .
3.4 Growth and Remodeling Laws
3.4.1 Elastin
Under normal conditions, elastin turns over relatively little after birth (Davis, 1993; Davidson et al., 1986; Lefevre and Rucker, 1980). As the animal grows, the artery grows longer axially and, as blood pressure and flow rate increase, the circumference grows. We assume that, with these changes, the elastin is simply stretched further from its zero-stress state. We treat elastin as a matrix of fibers in the z – θ plane and the strain energy density function is given by Eq. (15), with . Here, represents the stretch ratio of the elastin in the homeostatic state (t = 0) relative to its zero-stress state BE, and λ is the additional stretch from the homeostatic value (see Fig. 1). We assume that state BE occurs during the initial production of elastin.
3.4.2 Collagen
Unlike elastin, collagen is continually turning over. If the stretch ratio of a collagen fiber at the time of production is , then the stress of an individual collagen fiber produced at time τ is a function of , where λt/τ = λ(t)/λ(τ) with λ(τ) = λτ/0 (see Fig. 1).
In the homeostatic model, it is assumed that the artery has been at equilibrium (in the loaded state) for a “long” time. Therefore, all new collagen fibers have the same stretch ratio as the old fibers they replace, i.e. λ(t) = λ(τ), so .
In the time-dependent model, as the size and shape of the artery change, collagen fibers produced at different times bear different stresses. The total stress of the collagen matrix is a function of the evolving geometric shape, as well as the rates of production (mc) and degradation (kc) of collagen. Both mc and kc may be functions of either the collagen stress or the stress born by the cells producing the collagen. However, in this model, we assume that the rates of production and degradation are constant. The total collagen stress at time t is given by (Humphrey and Rajagopal, 2002)
| (20) |
3.4.3 Smooth Muscle Cells
In both the homeostatic model and the time-dependent model, we assume that the smooth muscle cells, via a combination of growth and active contraction, tend to maintain circumferential muscle stress and endothelial fluid shear stress at homeostatic values. In the homeostatic model, all cells are at their homeostatic stresses. In the time-dependent model, growth and contraction respond to changes in loading.
Under homeostatic conditions, vascular smooth muscle maintains a state of partial contraction, i.e., basal tone. This allows muscular arteries to respond rapidly to changes in flow by relaxing or contracting further to alter diameter. For example, in response to increased flow (and τw), the muscle relaxes to increase vessel radius and, by Eq. (4), restore the normal value of τw (Kamiya and Togawa, 1980). However, if the altered flow condition persists for days or weeks, the artery wall grows circumferentially to “permanently” increase the radius, until normal vascular tone is restored. The opposite occurs when blood flow rate drops.
Active contraction is assumed to respond quickly to changes in fluid shear stress on the endothelium (τw) and more slowly to changes in tone ( ), to bring each back to their homeostatic values (τo and respectively). Accordingly, we assume that muscle activation is governed by the relation
| (21) |
where the dot denotes the time derivative and Taτ and Taλ are time constants (Taτ ≪ Taλ). In addition, is restricted to values between λa min (maximum activation) and 1 (passive).
As discussed above, the arterial wall grows in response to chronic changes in flow. It also grows in response to changes in blood pressure, which primarily affects circumferential wall stress. For example, hypertension induces wall thickening that tends to restore normal wall stress (Fung and Liu, 1991). Consistent with our assumption that the smooth muscle stress is the critical regulatory parameter, we assume that the muscle follows the growth laws
| (22) |
| (23) |
where is the homeostatic muscle stress and Trσ, Tθσ, Tτ, and Tga are time constants. In this work, axial growth is ignored ( ). The last term in Eq. (23) represents the coupling between muscle contraction and growth. This allows the artery to maintain its nominal fluid shear stress and wall stress while growing to return to a homeostatic contractile state ( ).
3.5 Parameter Values
In this section, we give parameter values for a baseline (first-approximation) model for an artery. Refinements and perturbations of this model are examined later.
Arteries consist primarily of three constituents: smooth muscle cells, collagen, and elastin. The primary assumption of the model is that the wide variation in mechanical properties and response of various arteries to applied loads depends mainly on differences in the relative distributions of these three constituents.
The wall constituents are organized into three layers: the intima, media, and adventitia (Rhodin, 1979). The intima is primarily a single layer of endothelial cells, except in aging and disease. Though these cells clearly send signals to the rest of the artery when changes in flow rate occur (Langille, 1993; Furchgott and Zawadzki, 1980) they contribute little to the mechanics of the artery as a whole. As a result, the intima is not considered in this model of normalcy. The media is a mixture of all three constituents, with volume fractions depending on the particular artery. In elastic arteries (e.g., the aorta), the medial smooth muscle is organized into concentric layers separated by fenestrated sheets of elastin with interspersed collagen. In muscular arteries, smooth muscle cells dominate the media with an elastic lamina located near the media/adventitia boundary. The adventitia consists predominantly of collagen. The relative sizes of the media and adventitia vary depending on the artery. In the aorta, for example, the ratio of media to adventitia thickness varies from approximately nine in the aortic arch, near the heart, to less than one in the abdominal aorta (Bunce, 1974).
In the following, we let rb be defined as the radial location of the boundary between the media and the adventitia. The normalized boundary location is defined as
| (24) |
where r1 and r2 are the inner and outer radii of the loaded artery, respectively. The value of γ varies between 0 (all adventitia) and 1 (all media). Note that γ is enforced in the loaded homeostatic state and would not have the same value in the unloaded configuration.
The media and adventitia are separate layers. However, to improve model convergence, a smooth transition between layers is assumed. In the model, the volume fraction of constituent i has a radial distribution given by
| (25) |
so that
| (26) |
For the baseline model, the volume fractions of collagen and elastin in the media are uniform and equal (Stergiopulos et al., 2001), with cells making up the remainder. The adventitia is also considered uniform, with collagen constituting most of the volume. The volume fractions for muscle, collagen, and elastin are taken as
| (27) |
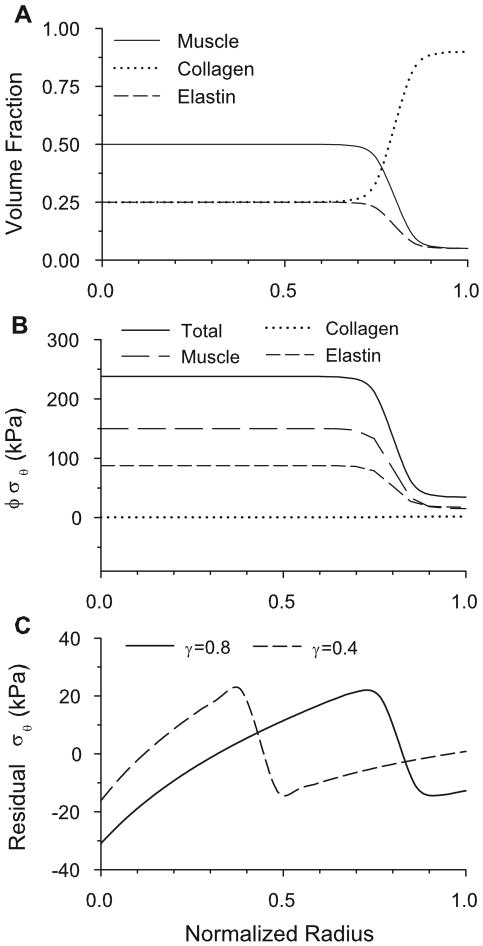
For α = 500 [in Eq. (25)], the distributions for γ = 0.8 are shown in Fig. 5A. The average volume fractions for the entire wall depend on the value of γ. For realistic values of γ, the model gives good correlation with experimentally determined whole artery dry mass fractions (Fischer and Llaurado, 1966), as well as those used by Gleason et al. (2004). For example, if γ is taken to be equal to 0.6, which is a realistic value for the carotid artery (Bunce, 1974), then the total volume fractions of the model (φm = 0.32, φc = 0.51, φe = 0.17) are reasonable.
Figure 5.
Results for homeostatic baseline model. (A) Constituent volume fraction distributions for γ = 0.8. (B) Circumferential partial and total stresses in loaded artery (γ = 0.8). (C) Residual total circumferential stress for γ = 0.8 and 0.4.
In addition, the material parameters for Eqs. (15)–(23) are the following:
| (28) |
Note that contractility is not included in the baseline model (Ca = 0). In addition, collagen and elastin fibers are included in both the circumferential and axial directions. Collagen fibers are assumed to have the same initial stretch ( ) regardless of orientation, but for elastin fibers, the initial stretches ( and ) are determined by their orientation.
3.6 Solution Method
The governing equations were solved using the method previously detailed in Taber and Eggers (1996), Taber and Humphrey (2001), and Taber (2004). As described in these papers, the equations were reduced to a set of integral equations, which were solved using a Nelder-Mead minimization and the trapezoidal rule for integration. For the homeostatic model, the solution procedure begins with P = 0, Q = 0, and . The variables P, Q, , , and are then incrementally stepped toward their respective homeostatic values [Eq.(28)]. Muscle growth is calculated by integrating the growth laws [Eq. (22), (23)] until τw = τ0 and for all integration points. This process is repeated until all variables reach their homeostatic values, producing the homeostatic configuration b(0).
Without changing the growth state ( and ) of the artery, the unloaded state bu(0) was determined by solving the integral equations with P = 0 and with the artery free to deform axially, as in Taber (1998). The cut state was determined in a similar fashion, as in Taber and Humphrey (2001).
In the time-dependent model, the computation starts at the equilibrium state b(0) established by the homeostatic model. With time, the muscle grows and contracts or relaxes [Eqs. (21)-(23)], the collagen remodels [Eq. (20)], and the elastin stretches. The growth and remodeling laws were integrated using finite differences. The loaded, unloaded and cut states were calculated in the same manner as in the homeostatic model.
4 Results for Baseline Homeostatic Model
4.1 Pressure-Radius Relations
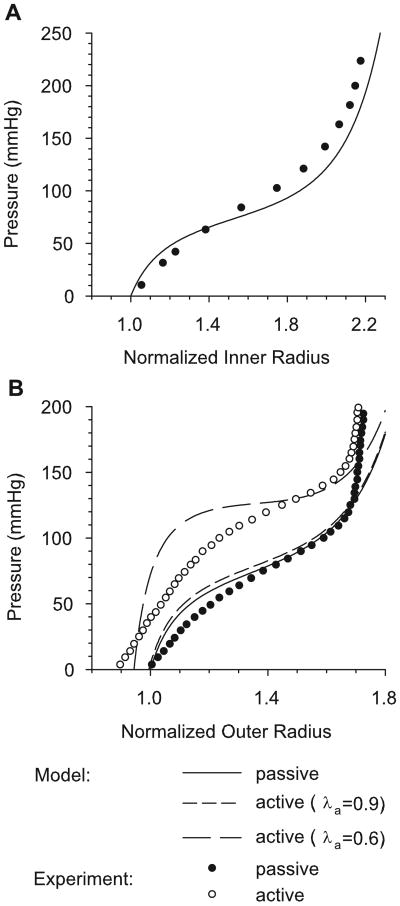
For an inflation test, the passive and active pressure-radius curves have the characteristic sigmoidal shape of the rat aorta and carotid artery (Berry et al., 1975; Fridez et al., 2002) (Fig. 4). To illustrate the effects of muscle tone, active pressure-radius curves are shown for normal tone (λa = 0.9) and maximum contraction (λa = 0.6). For γ = 0.8 and Ca = Ca max = 15 kPa, numerical results are compared with experimental pressure-radius curves for the active and passive carotid artery of the rat (Fridez et al., 2002) and the passive thoracic aorta of the rat (Berry et al., 1975). For both arteries, the agreement between the theoretical and experimental results is reasonably good.
Figure 4.
Pressure-radius relations with radius normalized to the passive radius at zero pressure. (A) Numerical pressure-inner radius curve with experimental data of Berry et al. (1975) for rat aorta. (B) Numerical pressure-outer radius curves. Curves for passive muscle, normal contraction (λa = 0.9), and maximal contraction (λa = 0.6) are shown for γ = 0.8. Experimental data are from Fridez et al. (2002) for the rat carotid artery.
4.2 Wall Stress Distributions
Transmural distributions of wall stress and smooth muscle growth depend on the relative constituent distributions. For the baseline model, distributions are defined by the location of the boundary between the media and the adventitia (0 ≤ γ ≤ 1). To illustrate these variations, stress distributions in the loaded and unloaded artery are shown for the constituent distributions of Figure 5A.
Due to the heterogeneous transmural distributions of the constituents, the total homeostatic stress state in the pressurized artery is very different in the media and adventitia (Fig. 5B). Because the collagen is fully remodeled, and the smooth muscle is fully grown, each collagen fiber and each muscle cell bears the same load, respectively, regardless of location. The total stress born by a constituent, however, depends on this homeostatic stress and the volume fraction φ of the constituent. For example, due to the differences in the distributions in each layer, the cells bear a greater portion of the total load in the media than in the adventitia.
Note that the collagen stress in the homeostatic artery is quite small (Fig. 5B). This is a consequence of the material properties defined by Eq. (16) and the homeostatic collagen stretch . However, if the blood pressure is increased by 50%, the collagen takes considerably more load before significant remodeling occurs (see Fig. 16B, to be discussed later).
Figure 16.
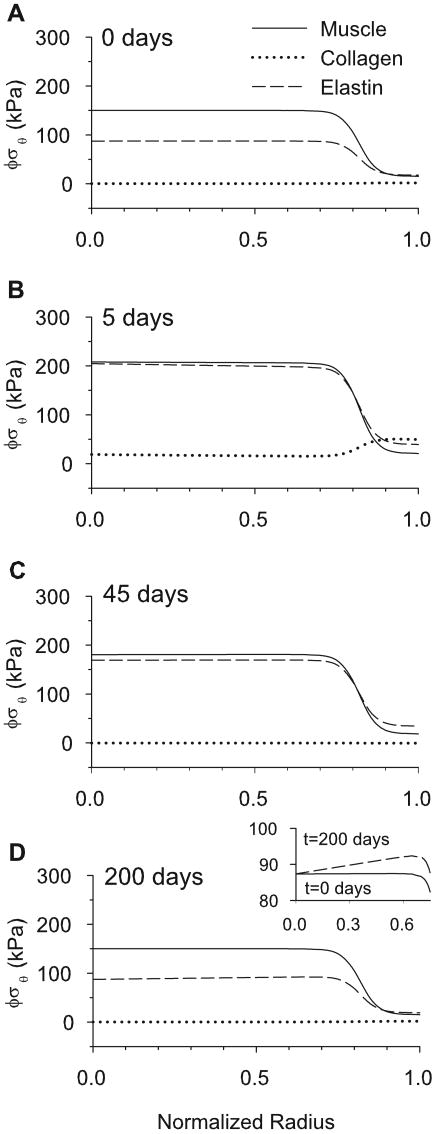
Transmural partial stresses of smooth muscle, collagen and elastin during growth and remodeling before and after a 50% pressure jump. (A) Partial stresses immediately preceding the pressure jump at 8% aorta length. (B) Partial stress distributions five days after the pressure jump begins. (C) Partial stress distributions 45 days after the pressure jump. (D) Fully grown and remodeled partial stresses, 200 days after the pressure jump. Stresses are similar to those in A, but the elastin gradient is slightly altered, as shown in the expanded scale of the inset.
For a homogeneous artery, the residual circumferential stress varies monotonically across the wall from compressive at the inner radius to tensile at the outer radius (Chuong and Fung 1986). In contrast, the present model yields a rapid drop in residual stress at the boundary between the media and the adventitia (Fig. 5C). Results are shown here for two locations of the media-adventitia boundary (γ = 0.4 and γ = 0.8). The basic pattern is similar to that computed by Taber and Humphrey (2001) for a two-layer cylinder.
4.3 Opening Angles
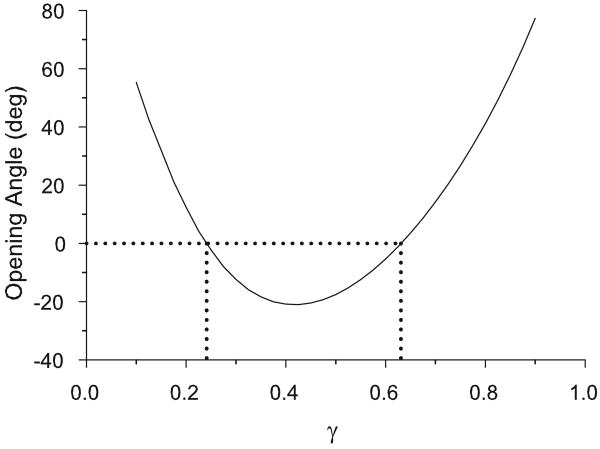
In the model, the opening angle depends strongly on the location of the boundary between the media and the adventitia (Fig. 6). For γ → 1 (artery predominantly made up of media) or γ → 0 (artery predominantly made up of adventitia) a radial cut gives a positive opening angle. When the artery has similarly sized inner and outer layers (γ ≈ 0.5), however, the opening angle is negative.
Figure 6.
Opening angle vs media-adventitia boundary location (γ) for homeostatic baseline model. When the artery geometry is primarily made up of either adventitia (γ → 0) or media (γ → 1), the opening angle tends to be positive. When the media and adventitia are similar in size (γ ≈ 0.5), the opening angle is negative. For the parameter values used in this model, the opening angle is negative for γ ∈ [0.24, 0.63].
To a first approximation, the opening angle is a measure of the residual bending moment in the unloaded artery (Taber and Humphrey, 2001). When the artery is predominantly made up of one layer, the residual stress distribution resembles the monotonic pattern that is seen in a growing cylinder made up of a single homogeneous material (see Fig. 5C, γ = 0.8). This gives a positive net moment, which is relieved via a positive opening angle (for γ large or γ small). When the boundary is near the central part of the wall, the more complex stress pattern causes a negative net moment (Fig. 5C, γ = 0.4), resulting in a negative opening angle.
Changing the values of the homeostatic stresses and stretch ratios ( , , , and ) affects the magnitude of the opening angle, shifting the curve in Fig. 6 by increasing or decreasing the opening angle for all values of γ. However, the basic shape and concavity of the curve remain approximately the same (results not shown). Varying the flow rate or the target shear stress has little effect on the opening angle (results not shown).
5 Homeostatic Model for Entire Aorta
Few data are available on how biomechanical characteristics vary along the length of the aorta. One notable exception is the study of Liu and Fung (1988), who measured longitudinal variations in opening angle of the rat aorta. To examine the ability of our model to predict their results, we used the model as a first-approximation for a local section of the aorta. For a given section, the parameters of the baseline model were altered to reflect the actual geometry, transmural distributions of collagen and elastin, and axial stretch. In this section, the variations in these properties and their effects on the residual stress state of the aorta are examined.
5.1 Effects of Media-Adventitia Boundary Location
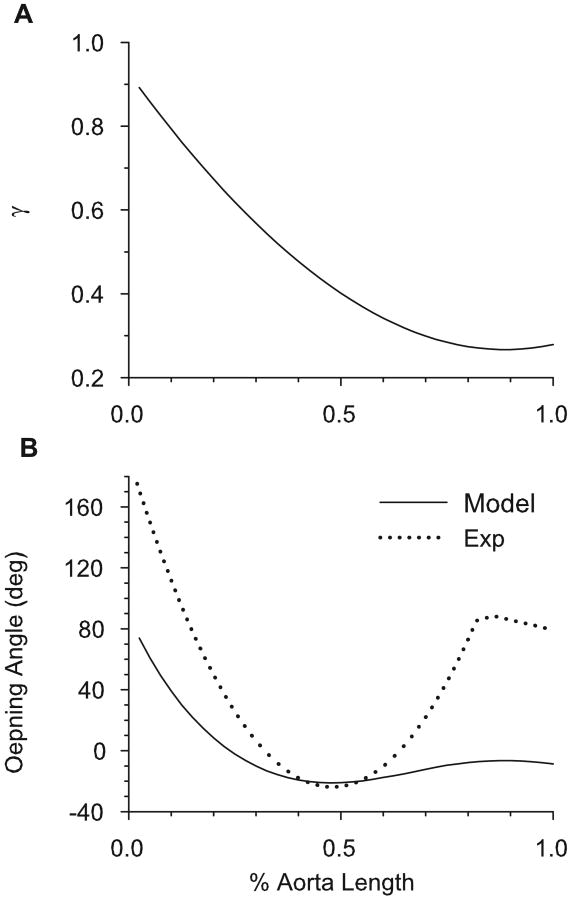
We used the data of Bunce (1974) to establish the longitudinal variation in location of the media-adventitia boundary (γ). In the aortic arch, the media is much thicker than the adventitia; in the thoracic and abdominal aorta, the adventitia becomes relatively thicker. Figure 7A shows the specified location of the boundary in the loaded artery as a function of distance from the heart. For this distribution of γ, the general trend in opening angles given by the model agrees qualitatively with the data of Liu and Fung (1988) (Fig. 7B).
Figure 7.
Opening angle based on realistic relative thickness of media and adventitia along entire aorta. (A) Specified media-adventitia boundary location (γ) along the length of the loaded aorta [based on Bunce (1974)]. (B) Opening angle along the length of the aorta, given by baseline model (with γ variation of (A) included) and the experimental results of Liu and Fung (1988).
5.2 Effects of Elastin Distribution
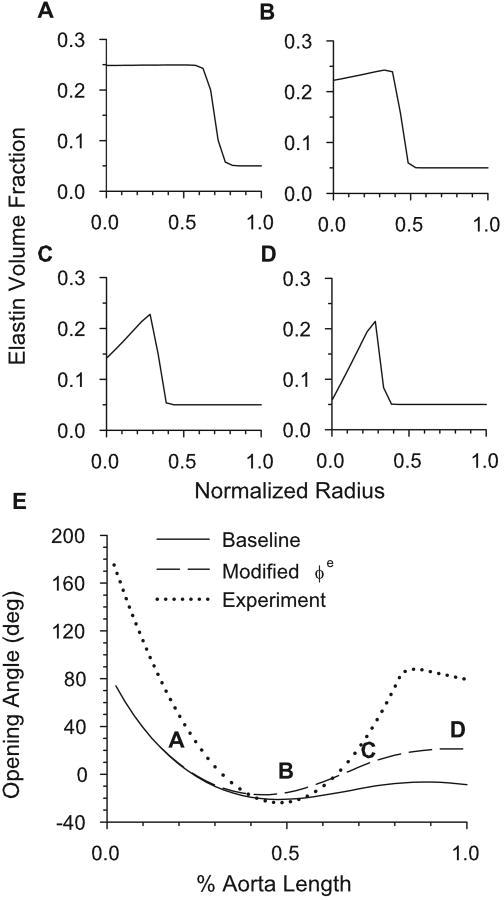
The media of most elastic arteries consists of relatively uniform layers of smooth muscle cells, collagen and elastin. Muscular arteries, in contrast, have less elastin in the inner media with a dense layer of elastin at the boundary between the media and adventitia. Bunce (1974) showed that the abdominal dog aorta, unlike more proximal regions, has a distribution more closely resembling a muscular artery than an elastic artery. Furthermore, Feldman and Glagov (1971) showed that, in humans, the total density of collagen plus elastin across the media is relatively constant for a wide range of aorta collagen and elastin cross-media gradients (mass fraction of muscle remains uniform across the media). In our model, these data are accounted for by replacing the inner media elastin with collagen where appropriate (Fig. 8A-D). When implemented, this variation increases the opening angle in the abdominal aorta, bringing the model into better agreement with the data of Liu and Fung (1988) (Fig. 8E).
Figure 8.
Opening angle based on realistic transmural constituent distributions along aorta. (A-D) Modified transmural distribution of elastin for the four locations along the aorta defined in E. (E) Effects of specified elastin variations on opening angle. Experimental results of Liu and Fung (1988) are also shown.
The reason for this effect is the following. In the baseline model, elastin bears a greater tensile load than collagen (see Fig. 5B). Hence, replacing elastin with collagen in the inner media results in a greater compression at the unloaded inner radius and a larger residual stress gradient across the wall, relative to the baseline model. This yields an increased opening angle, especially in the abdominal aorta.
This modification also helps explain other experimental data. For example, Feldman and Glagov (1971) found that, in general, the older a human subject was at death, the more likely they were to have a greater concentration of elastin in the outer part of the media than in the inner part. They also found that the trends in collagen gradient were opposite those for elastin. Combining these data with the observation of Saini et al. (1995) that the opening angles of human aortas increase with age lends credence to the hypothesis that the opening angle depends strongly on the radial distribution of its constituents. In particular, these data indicate that if there is a positive elastin gradient across the media (higher volume fraction elastin in outer media than in inner media), and a corresponding negative collagen gradient, then the opening angle should be greater than if there were no gradient. Similarly, if the elastin gradient were negative from inner to outer radius, the opening angle would be smaller than if there were no gradient. For any value of γ, the model shows these same trends based on media constituent gradients (results not shown).
5.3 Effects of Axial Stretch
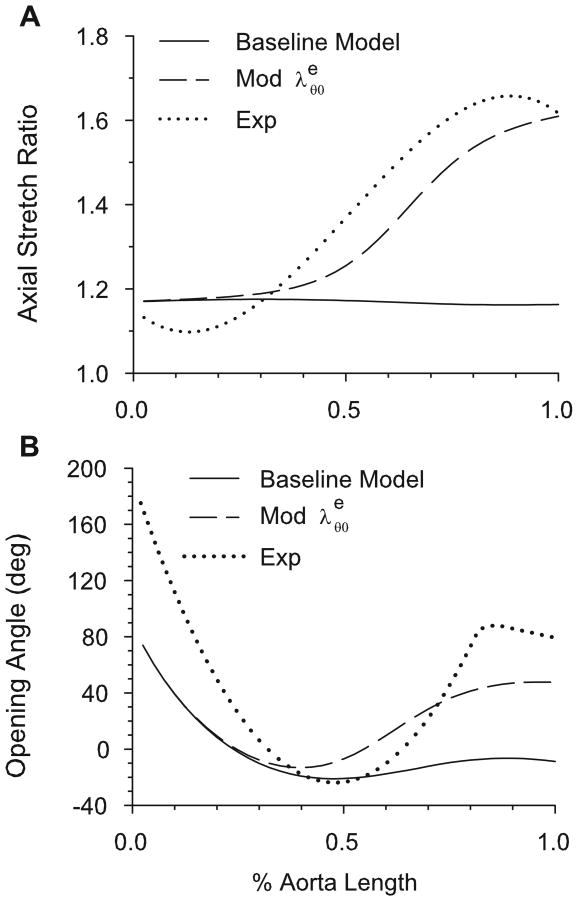
Guo et al. (2002) showed that, in mice, the ratio of the in situ length of an aortic section to its excised and unloaded length is significantly greater in the abdominal aorta (∼ 1.6) than in the aortic arch (∼ 1.1). Elastin is considered to be responsible for the shortening of arteries upon excision from the body (Dobrin, 1997). In our model, because elastin does not significantly remodel after one month post-birth, we assume that the elastin stretches with the growing artery. It seems reasonable to assume, due to variations in the surrounding anatomical restrictions, that the straight portion of the abdominal aorta lengthens axially more than the arch as the animal grows. Figure 9A shows the model-predicted ratio of the in situ axial length of the aorta to the unloaded excised length (1/Λu) when the assumed axial stretch ratio of the elastin due to arterial growth ( ) is varied from 1.1 to 2.0 along the length of the aorta. These results agree well with the experimental data of Guo et al. (2002), which are also shown.
Figure 9.
Axial stretch and opening angle based on realistic axial elastin stretch ratio ( ) along aorta. In modified aorta, increases from the arch to the abdominal aorta. (A) Numerical and experimental (Guo et al., 2001) axial stretch ratios of the loaded intact aorta relative to the unloaded dissected aorta. (B) Effects of axial elastin stretch ( ) variation on opening angle. Experimental data of Liu and Fung (1988) are also shown.
Because the artery wall is incompressible, a greater in vivo stress leads to a smaller radius and a thicker wall in the unloaded artery. This results in a longer “moment arm” for the residual stresses across the wall, yielding a higher opening angle. Since the elastin stretch ratio is greater in the abdominal aorta than near the arch, including this effect yields increased opening angles in the abdominal aorta, bringing the numerical results into better agreement with the data of Liu and Fung (1988) (Fig. 9B).
5.4 Opening Angles in a Realistic Model for the Aorta
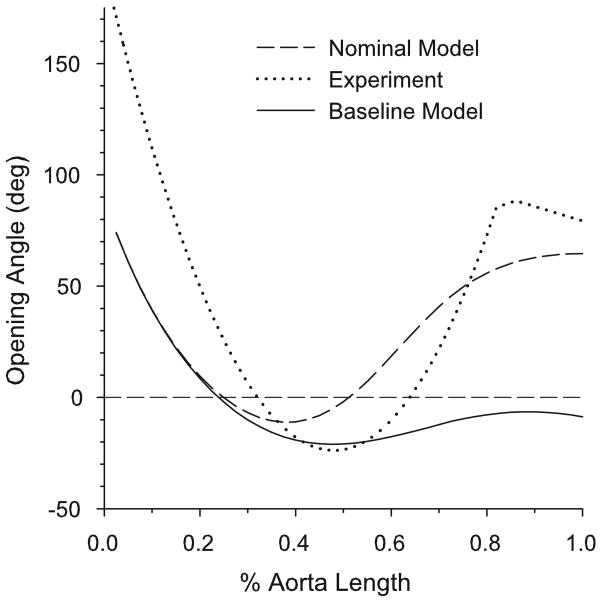
When all of the above variations are included simultaneously to create a nominal model for the aorta, the computed longitudinal variation in opening angle shows a reasonably good qualitative match to the experimental results of Liu and Fung (1988) (Fig. 10). The aortic arch and abdominal aorta have high positive opening angles, while the thoracic aorta has a negative opening angle. However, the opening angles in the modeled aortic arch region are approximately half of those measured experimentally. We speculate that this difference in the opening angle could be due in part to the effects of longitudinal curvature in the arch. This would cause circumferential variations in stress and growth, which are not accounted for in the present model.
Figure 10.
Opening angles along the length of the aorta given by the nominal model (including variations highlighted in Sections 5.2 and 5.3), baseline model (with only media-adventitia boundary varied as in Fig. 7A), and experimental results of Liu and Fung (1988).
A nominal model for a contracting aorta, in which λa = 0.9 for the entire aorta was also run. Smooth muscle tone during growth and remodeling had little effect on opening angles, which were computed for the passive vessel (data not shown).
5.5 Two-Cut Opening Angles
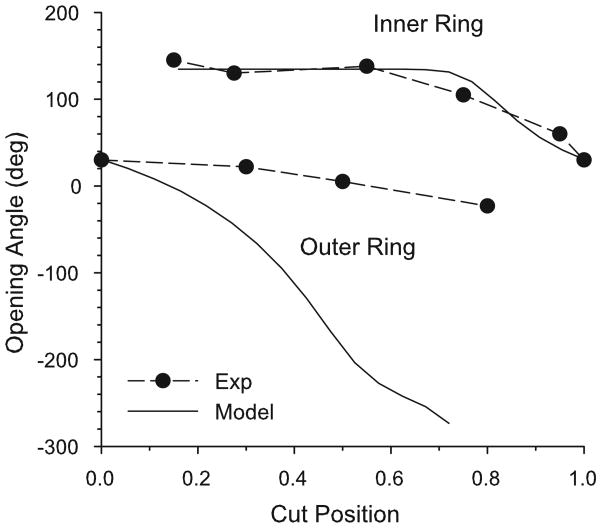
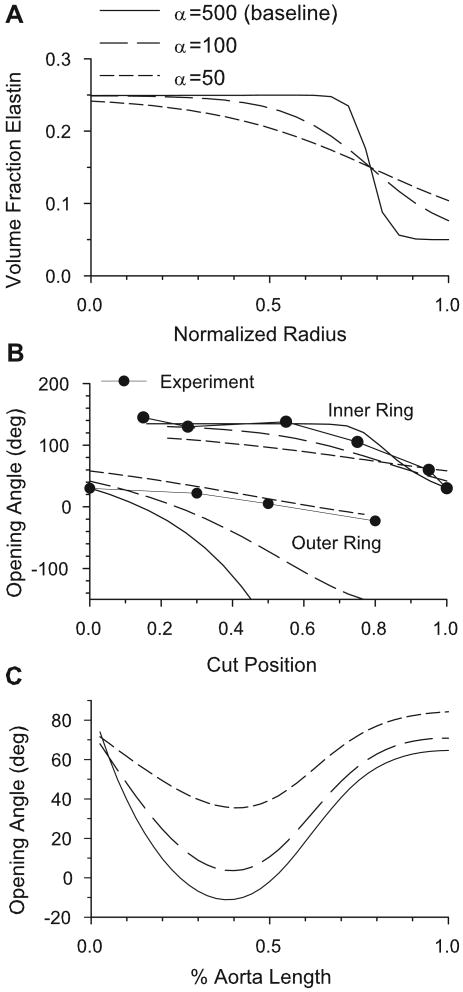
Vossoughi et al. (1993) showed that a single radial cut does not relieve all residual stress in the bovine aorta. They first divided the section into two rings with a circumferential cut and then cut each of the resulting rings radially (see Fig. 2). After the second cut, the inner ring opened more than the outer ring. Later, Greenwald et al. (1997) performed a series of related experiments in which they removed inner or outer portions of the wall of bovine carotid arteries and measured the opening angle after cutting the remaining inner or outer ring, respectively. They found that the opening angle depends on the radial location of the circumferential cut (Fig. 11). This experiment was simulated here by removing radial integration points and calculating the opening angle for the remaining ring. The model was run at 12.5% aorta length, because this is where the nominal aorta model has a similar one-cut opening angle to that of the experiment (see Fig. 10).
Figure 11.
Two-cut opening angles at 12.5% distance along the nominal aorta model and experimental measurements of Greenwald et al. (1997) for bovine carotid artery. The cut position indicates the normalized location of the circumferential cut from the inner radius (0) to the outer radius (1).
For the inner ring, the numerical curve of opening angle versus cut location agrees well with the data of Greenwald et al. (1997) (Fig. 11). In contrast, although showing a similar trend of decreasing opening angle as the cut moves closer to the adventitia, the model predicts much larger negative opening angles than those found experimentally for the outer ring.
As shown by Taber and Humphrey (2001), two-cut opening angles are sensitive to the heterogeneity of the mechanical properties of the arterial wall. The sharpness of the boundary between the media and adventitia is defined by the parameter α in Eq. (25). When the value of α is decreased, the transition from media to adventitia becomes more gradual (Fig. 12A). This results in a significant change in the two-cut opening angles (Fig. 12B), as well as the one-cut opening angle along the length of the aorta (Fig. 12C). While the two-cut opening angles are brought into better agreement with experimental data (Fig. 12B), the predicted longitudinal variation becomes worse (compare Figs. 10 and 12C).
Figure 12.
Effects of sharpness of media-adventitia boundary on opening angles. (A) Transmural elastin volume fractions for the three values of α. As α increases, the boundary becomes sharper. (B) Two-cut opening angles for the three values of α at 12.5% aorta length in the nominal model. As α decreases, the numerical results come into closer agreement with the experimental data of Greenwald et al. (1997). (C) One-cut opening angles along the length of the aorta for the three values of α.
5.6 Collagenase and Elastase Opening Angles
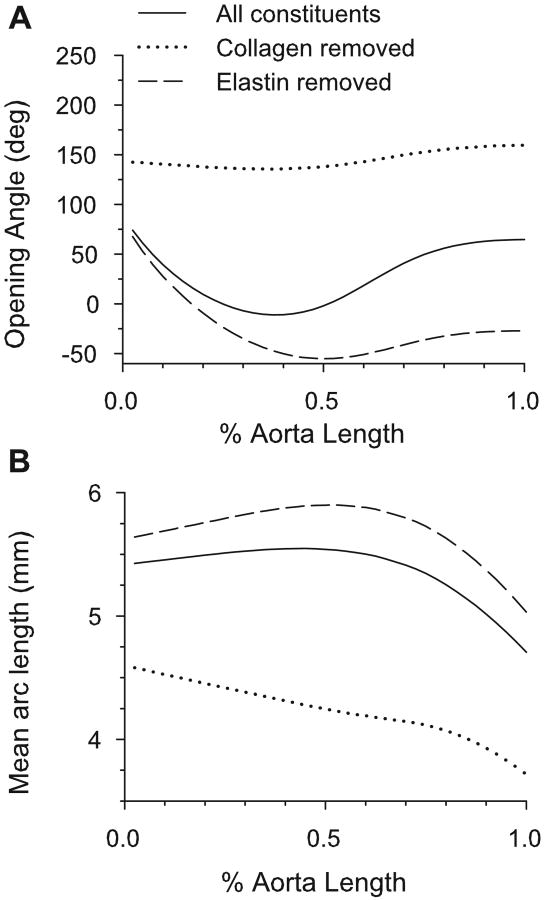
Zeller and Skalak (1998) treated portions of rat saphenous arteries with elastase and collagenase and reported the resulting changes in opening angle and circumferential arc length. They found that, for both drugs, the opening angle increased with time after treatment for at least thirty minutes. Moreover, the arc length of the cut segment increased for elastase-treated arteries and decreased for collagenase-treated arteries. Using the nominal model, this experiment was simulated by setting the volume fraction of the digested constituent to zero and recalculating the equilibrium state of the cut artery. (Growth and remodeling remained the same as in the three-constituent model, and were not allowed to reequilibrate.) The model predicts the same qualitative changes in the opening angle for the artery exposed to collagenase and similar changes in arc length for both the collagenase-treated and elastase-treated arteries (Fig. 13). However, contrary to the experimental result, the model-predicted opening angle of the elastase-treated artery decreases.
Figure 13.
Model predictions for arteries in which elastin or collagen has been digested. (A) Opening angles for elastase and collagenase treated aorta. (B) Mean arc lengths of cut artery for elastase and collagenase treated aorta.
6 Results for Time-Dependent Model
Arteries adapt to perturbed loading conditions by growing and remodeling. Here, we examine the dynamic response of the time-dependent model following a step increase in pressure. The model starts from the equilibrium state established using the nominal homeostatic model for the aorta and calculates changes due to growth and remodeling.
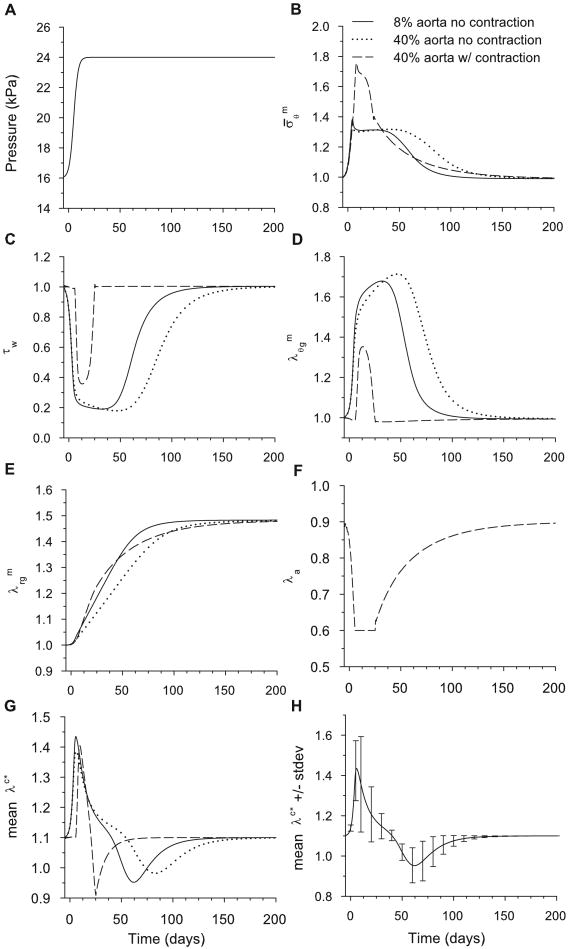
Two time-dependent models are considered. The first neglects active contraction (λa = 1 for all t), which is likely appropriate for modeling the arch of the aorta, because it exhibits little contractility. The second model includes active contraction with normal tone (λa = 0.9) specified at t = 0. With flow rate fixed, a pseudo-step increase in pressure was applied (Fig. 14A), and the artery was allowed to adapt. Growth, contraction, and remodeling were computed using Eqs. (20)-(23), with the growth time constants and collagen production and degradation rates given in Eq. (28). When contraction was ignored, we set λ̇a = 0.
Figure 14.
Stresses and stretch ratios for time-dependent model following a 50% increase in pressure from the homeostatic state. The stresses and are normalized relative to homeostatic values. Legend in (B) applies also for (C-H). (A) Psuedo-step increase in pressure specified as a function of time. (B) Circumferential muscle stress at inner radius. (C) Endothelial fluid shear stress. (D,E) Circumferential and radial growth stretch ratios at inner radius. Note that returns to unity (no net growth) only at the inner radius. (F) Activation stretch ratio at inner radius. (G) Mean collagen stretch ratio in artery wall. (H) Mean and standard deviation of stretch ratio for collagen across the wall at 8% aorta length.
The temporal response of the model was studied for a 50% jump in blood pressure from its homeostatic value with flow rate held fixed. The model was run without contraction at 8% and 40% along the length of the aorta from the heart and with contraction included at 40% aorta length. At 8% length, the aorta is predominantly composed of media; at 40%, it is approximately half media and half adventitia (see Fig. 7A).
6.1 Wall Stress and Fluid Shear Stress
Immediately after the pressure jump, the vessel distends, causing the muscle stress to increase and the fluid shear stress τw to decrease (Fig. 14B,C) Here, the stresses are normalized relative to the homeostatic values, i.e., . When contraction is included, the wall rapidly contracts (λa decreases, Fig. 14F), reducing vessel radius. This response quickens the adaptation of τw (see 40% aorta in Fig. 14C). However, due to the magnitude of the jump, contraction alone cannot return the shear to its homeostatic value. This can be seen by noting that λa reaches a minimum before τw returns to its homeostatic value (see Figs. 14C,F) Later, circumferential growth slowly decreases the vessel radius further, returning the shear stress and muscle tone to their respective homeostatic values (Figs. 14C,F). During this time, the wall also thickens (Fig. 14E), returning to its homeostatic value (Fig. 14B). All of these trends are consistent with experimental observations.
During remodeling, new collagen is produced at the specified stretch ratio . Then, as an individual collagen fiber deforms further with the changing artery geometry, its stretch ratio λc∗ relative to its zero-stress configuration changes. At any given time, therefore, collagen fibers are stretched different amounts, depending on the time of production. Due to the step increase in pressure, the increase in radius stretches the collagen from its homeostatic value (Fig. 14G). Then, as old collagen is replaced by new collagen at the new homeostatic geometry, λc∗ returns to its homeostatic value. Because active contraction regulates the geometry of the artery, the mean stretch ratio of collagen fibers λc∗ remains closer to when contraction is included. In addition, as the artery returns to homeostasis, the standard deviation of the collagen mean fiber stretch in the wall decreases (Fig. 14H). When contraction is included in the model, the standard deviations are smaller (results not shown).
6.2 Opening Angles
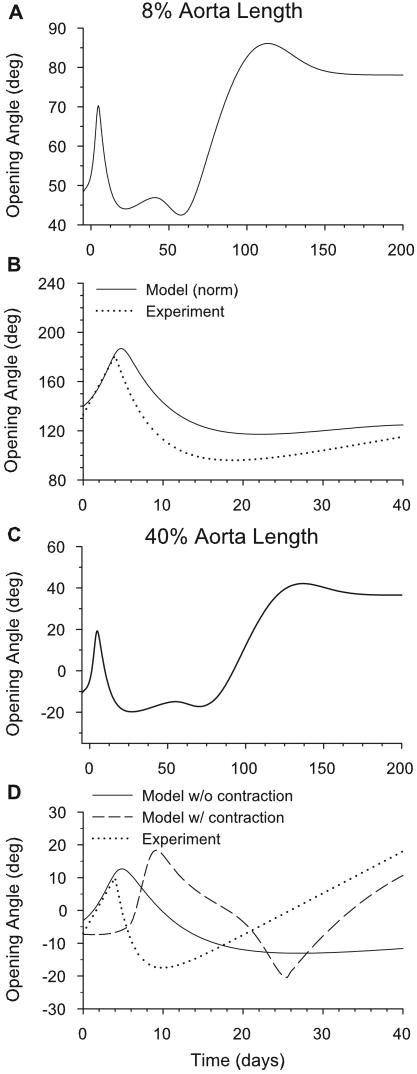
Fung and Liu (1989) found that the aortic opening angle (φ) due to a single radial cut varies with time after induced hypertension. Time-dependent opening angles predicted by the model following a 50% increase in pressure are shown for sections located at 8% and 40% of the length of the aorta (Fig. 15). For both sections, the opening angle follows a similar trend to that found by Fung and Liu (1989), as the angle jumps immediately and peaks around four days after the pressure jump. It then decreases, and finally increases again after several weeks (Fig. 15B,D). The corresponding partial stress distributions for the wall constituents are shown during growth and remodeling at the 8% location (Fig. 16). The transmural growth stretch ratios ( , ) are also shown (Fig. 17).
Figure 15.
Time-dependent opening angles following a 50% increase in pressure from the homeostatic state. Opening angles are shown at 8% (A,B) and 40% (C,D) of the aorta length. Normalized model results (relative to value at t = 0) are compared with experimental data of Fung and Liu (1989) in (B) and (D). The effects of smooth muscle contraction are shown for the model in (D).
Figure 17.
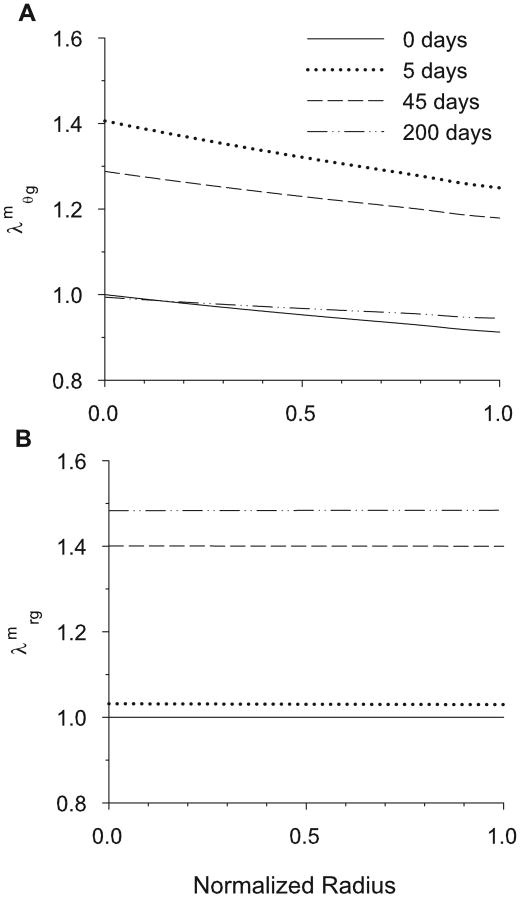
Cross-sectional circumferential and radial smooth muscle growth 0, 5, 45 and 200 days after a 50% pressure jump at 8% aorta length. (A) Cirucmferential muscle growth ( ). (B) Radial muscle growth ( ).
For the 8% and 40% locations without contraction, this complex opening angle pattern can be described in four steps: (1) For the first few days after the pressure jump, the muscle grows rapidly in the circumferential direction (Fig. 14D). Because increases more near the inner radius, this growth is initially greater there (Fig. 17A), causing greater compression in the inner layers of the unloaded artery and an increase in opening angle (Fig. 15A,C). (2) For several days after the peak in φ, circumferential growth changes relatively little, but collagen turnover continues, lowering the tensile stress by replacing old collagen fibers that were stretched by the pressure jump (Fig. 16B,C). As it occurs primarily in the collagen dominated adventitia, this effect results in a decrease in adventitial residual stress and a drop in opening angle. (3) After about 50 days, and τw return toward their respective homeostatic values (Fig. 14B,C). This response is brought about by an increase in wall thickness while the inner radius returns to its original homeostatic value. Hence, though is fairly uniform across the wall (Fig. 17B), the change in thickness is caused solely by an increase in outer radius. Consequently, elastin at the inner radius retains its initial homeostatic stretch, while elastin in the outer layers stretches further, causing a second significant increase in opening angle (Fig. 15A,C). (4) Finally, as the collagen remodels at the new equilibrium geometry, the opening angle equilibrates to a new homeostatic value. It is important to note that, when the artery has attained this new equilibrium, all of the cells and collagen fibers bear the same loaded stress as at time zero, but the elastin stress is different (Fig. 16A,D,inset). According to our model, therefore, it is the lack of elastin turnover that produces a new homeostatic state, similar to the sub-optimal adaptation described by Gleason et al. (2004).
Figure 15B,D shows the same results, along with the experimental data of Fung and Liu (1989) at 8% and 40% of the aorta length for the first 40 days after the pressure jump. (The experimental data end at 40 days post-surgury.) Here, the model results are scaled so that the initial computed opening angle is the same as the initial experimental value. At the 8% location, the match between the scaled numerical and the experimental results is quite good. At 40%, however, the model fails to predict the increase after 10 days. However, if contraction is included in the model, the opening angle increases again after the initial jump, similar to the experimental data (Fig. 15D). Notably, the aorta at 40% from the heart resembles a muscular artery more than at 8%; hence, contractility may be more significant.
7 Discussion
In this paper, we presented a thick-walled model for an artery that accounts for the mechanical response and functional adaptation of individual wall constituents. Every attempt was made to minimize the number of free parameters. Hence, we used published data to determine the spatial distributions and mechanical properties of smooth muscle cells, elastin and collagen. For growth and remodeling, we assume that (1) arteries grow to maintain a uniform smooth muscle stress; (2) elastin does not turn over and, therefore, stretches with the growing artery after birth; and (3) collagen continually turns over, with new collagen fibers formed at a specified initial stretch.
Several other models have been used to study growth and remodeling in arteries. In the model of Taber and Eggers (1996), circumferential and radial growth depends on local wall stress. The models of Taber (1998), Rachev et al. (1998), and Taber and Humphrey (2001) grow in response to both wall stress and the fluid shear stress on the endothelium. Rachev and Hayashi (1999) added a contractile term for more acute shear stress management. Gleason et al. (2004) used constrained mixture theory to account for remodeling of multiple constituents in a thin-walled model that does not account for residual stress. Each of these models has helped to develop our understanding of the evolving stress states of arteries. Building on these previous efforts, we used the present model to determine the relative contributions of smooth muscle growth and contraction, as well as collagen remodeling, to the residual stress state of the artery. Residual stresses, as characterized by opening angles, are important because they reflect inhomogeneous growth and remodeling.
The behavior of our model depends strongly on the relative distributions of the wall constituents, which vary along the length of the aorta. When realistic distributions are included, the results given by the model agree quite well with the opening angle data of Liu and Fung (1988) and Fung and Liu (1989) (see Figs. 10 and 15), as well as the pressure-radius data of Berry et al. (1975) and Fridez et al. (2002) (see Fig. 4). Reasonable agreement also was found with the two-cut opening angle data of Greenwald et al. (1997) and the elastase/collagenase experiments of Zeller and Skalak (1998) (see Figs. 11–13). However, as found by Taber and Humphrey (2001), the two-cut opening angle results for the outer ring agree only if there is a gradual transition from media to adventitia (Fig. 12B), a characteristic that produces more error in one-cut opening angle predictions (Fig. 12C). Clearly, this effect warrants further study.
7.1 Implications of This Study
It has been stated that small diameter arterial substitutes are the ‘Holy Grail’ of tissue engineering (Conte, 1998). Such substitutes could be used, for example, to replace damaged coronary arteries in coronary bypass surgery. Our model shows that the transmural distributions of the wall constituents play a vital role in the mechanics of natural blood vessels, and likely would need to be considered in any tissue-engineered implants that may be devised.
Though it is beyond the scope of this paper, our model could be used to explore species-to-species variations in opening angles, which have been seen experimentally (Han and Fung, 1991, Guo et al., 2002). Guo et al. (2002), for example, have reproduced many of the experiments done by Liu and Fung, but in C57bl/6 mice. They found variations in the opening angle along the aorta, but the variations they found were quite different from those of Liu and Fung (1988). In the mouse, the opening angle dips in the proximal thoracic aorta, but remains positive, and climbs to a value in the abdominal aorta that is greater than that in the arch (similar to the result for α = 50 shown in Fig. 12C). It is possible that this difference can be attributed to the differences in the microstructure of the aortas of mouse and rat.
7.2 Limitations
As with any model, we made several assumptions to mathematically simplify this problem. First, we have neglected the pulsatile nature of the flow in the aorta. Some investigators suggest that atherogenesis is triggered by certain characteristics of unsteady flow (Friedman et al., 1975). Moreover, arterial growth and remodeling may depend on cyclic distension caused by pulse pressure.
Further, some of our assumptions greatly simplify the architecture of the artery. For example, we neglected the helical architecture of arterial smooth muscle (Rhodin, 1979). Also, we have assumed that the artery behaves as a constrained mixture, which posits that each constituent exists simultaneously (though in differing quantities) everywhere in the artery and deforms equally under loading. The true construction of the aorta is considerably more complicated. Cells, collagen and elastin form a network via both series and parallel connections. A model that accounts for this arrangement could yield different results from those of the current model.
Relatively simple geometric and mechanical properties have been assigned to the wall constituents. Some researchers, for example, assume that collagen buckles in compression, while others treat collagen fibers as springs that uncoil when stretched (MacKenna et al., 1997). Furthermore, we do not account for differences in constituent microstructure in different layers of the artery. For example, the model does not account for the more prominent axial alignment of collagen in the adventitia compared to that in the media (Humphrey, 2002). Fiber alignment can have a large effect on wall stress (Sacks, 2003; Mirnajafi et al., 2005).
Finally, this is a phenomenological model that connects stress to growth without taking into account the intermediate steps of gene and protein expression. These steps are clearly important, but outside the scope of this paper.
In conclusion, a key role of mathematical models is to help determine what questions still need to be answered experimentally. To our knowledge, while several studies have examined the gross mechanical behavior of arteries, there has not yet been a comprehensive quantitative study of remodeling of constituents along the length of the aorta. Our model suggests that such a study, combined with numerical tools, could help determine the nature of residual stresses in arteries and perhaps provide insight into why these stresses vary so much from artery to artery or even within a single artery.
Acknowledgments
This research was supported by NIH grant R01 HL64347 (LAT), NIH grants R01 HL64372 and HL80415 (JDH) and by NIH Training Grant T32 HC007916 (PI: Dr Frank C-P Yin).
Footnotes
In this paper, zero-stress configurations are denoted by upper-case B's, whereas stressed configurations are denoted by lower-case b's. Time t = 0 is in maturity, thus avoiding complexities of development.
References
- Berry C, Greenwald SE, Rivett JF. Static mechanical properties of the developing and mature rat aorta. Cadiovasc Res. 1975;9:669–678. doi: 10.1093/cvr/9.5.669. [DOI] [PubMed] [Google Scholar]
- Bunce DFM. Atlas of Arterial Histology. Warren H. Green, Inc.; St Louis, MO: 1974. [Google Scholar]
- Conte MS. The ideal small arterial substitute: a search for the Holy Grail? FASEB J. 1998;12:43–45. doi: 10.1096/fasebj.12.1.43. [DOI] [PubMed] [Google Scholar]
- Cox RH. Arterial wall mechanics and composition and the effects of smooth muscle activation. Am J Physiol. 1975;229:807–812. doi: 10.1152/ajplegacy.1975.229.3.807. [DOI] [PubMed] [Google Scholar]
- Davidson JM, Hill KE, Alford JL. Developmental changes in collagen and elastin biosynthesis in the porcine aorta. Dev Biol. 1986;118:103–111. doi: 10.1016/0012-1606(86)90077-1. [DOI] [PubMed] [Google Scholar]
- Davis EC. Stability of elastin in the developing mouse aorta: a quantitative radioautographic study. Histochemistry. 1993;100:17–26. doi: 10.1007/BF00268874. [DOI] [PubMed] [Google Scholar]
- Dobrin P. Physiology and Pathophysiology of Blood Vessels. In: Sidawy AN, S B, DePalma RG, editors. The Basic Science of Vascular Disease. Futura Publishing; New York: 1997. pp. 69–105. [Google Scholar]
- Feldman SA, Glagov S. Transmedial collagen and elastin gradients in human aortas: reversal with age. Atherosclerosis. 1971;13:385–394. doi: 10.1016/0021-9150(71)90081-5. [DOI] [PubMed] [Google Scholar]
- Fischer GM, Llaurado JG. Collagen and elastin content in canine arteries selected from functionally different vascular beds. Circ Res. 1966;19:394–399. doi: 10.1161/01.res.19.2.394. [DOI] [PubMed] [Google Scholar]
- Fridez P, Makino A, Kakoi D, Miyazaki H, Meister JJ, Hayashi K, Stergiopulos N. Adaptation of conduit artery vascular smooth muscle tone to induced hypertension. Ann Biomed Eng. 2002;30:905–916. doi: 10.1114/1.1507326. [DOI] [PubMed] [Google Scholar]
- Friedman MH, O'Brien V, Ehrlich LW. Calculations of pulsatile flow through a branch: implications for the hemodynamics of atherogenesis. Circ Res. 1975;36:277–285. doi: 10.1161/01.res.36.2.277. [DOI] [PubMed] [Google Scholar]
- Fung YC, Liu SQ. Change of residual strains in arteries due to hypertrophy caused by aortic constriction. Circ Res. 1989;65:1340–1349. doi: 10.1161/01.res.65.5.1340. [DOI] [PubMed] [Google Scholar]
- Fung YC, Liu SQ. Changes of zero-stress state of rat pulmonary arteries in hypoxic hypertension. J Appl Physiol. 1991;70:2455–2470. doi: 10.1152/jappl.1991.70.6.2455. [DOI] [PubMed] [Google Scholar]
- Furchgott RF, Zawadzki JV. The obligatory role of endothelial cells in the relaxation of arterial smooth muscle by acetylcholine. Nature. 1980;288:373–376. doi: 10.1038/288373a0. [DOI] [PubMed] [Google Scholar]
- Gleason RL, Taber LA, Humphrey JD. A 2-D model of flow-induced alterations in the geometry, structure, and properties of carotid arteries. J Biomech Eng. 2004;126:371–381. doi: 10.1115/1.1762899. [DOI] [PubMed] [Google Scholar]
- Gleason RL, Humphrey JD. A mixture model of arterial growth and remodeling in hypertension: Altered muscle tone and tissue turnover. J Vasc Res. 2005;41:352–363. doi: 10.1159/000080699. [DOI] [PubMed] [Google Scholar]
- Greenwald SE, Moore JE, Jr, Rachev A, Kane TP, Meister JJ. Experimental investigation of the distribution of residual strains in the artery wall. J Biomech Eng. 1997;119:438–444. doi: 10.1115/1.2798291. [DOI] [PubMed] [Google Scholar]
- Guo X, Kono Y, Mattrey R, Kassab GS. Morphometry and strain distribution of the C57BL/6 mouse aorta. Am J Physiol Heart Circ Physiol. 2002;283:H1829–H1837. doi: 10.1152/ajpheart.00224.2002. [DOI] [PubMed] [Google Scholar]
- Han HC, Fung YC. Species Dependence of the Zero-Stress State of Aorta: Pig Versus Rat. J Bio Eng. 1991;126:371–381. doi: 10.1115/1.2895425. [DOI] [PubMed] [Google Scholar]
- Holtz J, Forstermann U, Pohl U, Giesler M, Bassenge E. Flow-dependent, endothelium-mediated dilation of epicardial coronary arteries in conscious dogs: effects of cyclooxygenase inhibition. J Cardiovasc Pharmacol. 1984;6:1161–1169. [PubMed] [Google Scholar]
- Holzapfel GA, Gasser TC, Ogden RW. A new constitutive framework for arterial wall mechanics and a comparative study of material models. J Elasticity. 2000;61:1–48. [Google Scholar]
- Humphrey JD. Cardiovascular Solid Mechanics: Cells, Tissues and Organs. Springer-Verlag; New York: 2002. [Google Scholar]
- Humphrey JD, Rajagopal KR. A constrained mixture model for growth and remodeling of soft tissues. Mathematical Models & Methods in Applied Sciences. 2002;12:407–430. [Google Scholar]
- Johnson P. The myogenic response. In: Bohr DF, Somlyo AP, Sparks HV Jr, editors. Handbook of Physiology. The Cardiovascular System. Vascular Smooth Muscle. Sec II. American Physiological Society; Bethesda, MD: 1981. pp. 409–442. [Google Scholar]
- Kamiya A, Togawa T. Adaptive regulation of wall shear stress to flow change in the canine carotid artery. Am J Physiol. 1980;239:H14–H21. doi: 10.1152/ajpheart.1980.239.1.H14. [DOI] [PubMed] [Google Scholar]
- Langille BL. Remodeling of developing and mature arteries: endothelium, smooth muscle, and matrix. J Cardiovasc Pharmacol. 1993;21 1:S11–S17. doi: 10.1097/00005344-199321001-00003. [DOI] [PubMed] [Google Scholar]
- Lefevre M, Rucker RB. Aorta elastin turnover in normal and hypercholesterolemic Japanese quail. Biochim Biophys Acta. 1980;630:519–529. doi: 10.1016/0304-4165(80)90006-9. [DOI] [PubMed] [Google Scholar]
- Liu SQ, Fung YC. Zero-stress states of arteries. J Biomech Eng. 1988;110:82–84. doi: 10.1115/1.3108410. [DOI] [PubMed] [Google Scholar]
- MacKenna DA, Vaplon SM, McCulloch AD. Microstructural model of perimysial collagen fibers for resting myocardial mechanics during ventricular filling. Am J Physiol. 1997;273:H1576–H1586. doi: 10.1152/ajpheart.1997.273.3.H1576. [DOI] [PubMed] [Google Scholar]
- Matsumoto T, Hayashi K. Stress and strain distribution in hypertensive and normotensive rat aorta considering residual strain. J Biomech Eng. 1996;118:62–73. doi: 10.1115/1.2795947. [DOI] [PubMed] [Google Scholar]
- Mirnajafi A, Raymer J, Scott MJ, Sacks MS. The effects of collagen fiber orientation on the flexural properties of pericardial heterograft biomaterials. Biomaterials. 2005;26:795–804. doi: 10.1016/j.biomaterials.2004.03.004. [DOI] [PubMed] [Google Scholar]
- Nissen R, Cardinale GJ, Udenfriend S. Increased turnover of arterial collagen in hypertensive rats. Proc Natl Acad Sci U S A. 1978;75:451–453. doi: 10.1073/pnas.75.1.451. [DOI] [PMC free article] [PubMed] [Google Scholar]
- Olivetti G, Anversa P, Melissari M, Loud AV. Morphometry of medial hypertrophy in the rat thoracic aorta. Lab Invest. 1980;42:559–565. [PubMed] [Google Scholar]
- Rachev A, Hayashi K. Theoretical study of the effects of vascular smooth muscle contraction on strain and stress distributions in arteries. Ann Biomed Eng. 1999;27:459–468. doi: 10.1114/1.191. [DOI] [PubMed] [Google Scholar]
- Rachev A, Stergiopulos N, Meister JJ. A model for geometric and mechanical adaptation of arteries to sustained hypertension. J Biomech Eng. 1998;120:9–17. doi: 10.1115/1.2834313. [DOI] [PubMed] [Google Scholar]
- Rhodin J. Architecture of the Vessel Wall. In: Berne RM, editor. Handbook of Physiology, Section 2. Vol. 2. American Physiological Society; 1979. [Google Scholar]
- Rodriguez EK, Hoger A, McCulloch AD. Stress-dependent finite growth in soft elastic tissues. J Biomech. 1994;27:455–467. doi: 10.1016/0021-9290(94)90021-3. [DOI] [PubMed] [Google Scholar]
- Sacks MS. Incorporation of experimentally-derived fiber orientation into a structural constitutive model for planar collagenous tissues. J Biomech Eng. 2003;125:280–287. doi: 10.1115/1.1544508. [DOI] [PubMed] [Google Scholar]
- Saini A, Berry C, Greenwald S. Effect of age and sex on residual stress in the aorta. J Vasc Res. 1995;32:398–405. doi: 10.1159/000159115. [DOI] [PubMed] [Google Scholar]
- Stergiopulos N, Vulliemoz S, Rachev A, Meister JJ, Greenwald SE. Assessing the homogeneity of the elastic properties and composition of the pig aortic media. J Vasc Res. 2001;38:237–246. doi: 10.1159/000051052. [DOI] [PubMed] [Google Scholar]
- Taber LA. Pattern formation in a nonlinear membrane model for epithelial morphogenesis. Acta Biotheoretica. 2000;48:47–63. [Google Scholar]
- Taber LA. A model for aortic growth based on fluid shear and fiber stresses. J Biomech Eng. 1998;120:348–354. doi: 10.1115/1.2798001. [DOI] [PubMed] [Google Scholar]
- Taber LA. Nonlinear Theory of Elasticity: Applications in Biomechanics. World Scientific Publishing Co.; Singapore: 2004. [Google Scholar]
- Taber LA, Eggers DW. Theoretical study of stress-modulated growth in the aorta. J Theor Biol. 1996;180:343–357. doi: 10.1006/jtbi.1996.0107. [DOI] [PubMed] [Google Scholar]
- Taber LA, Humphrey JD. Stress-modulated growth, residual stress, and vascular heterogeneity. J Biomech Eng. 2001;123:528–535. doi: 10.1115/1.1412451. [DOI] [PubMed] [Google Scholar]
- von Maltzahn WW, Warriyar RG, Keitzer WF. Experimental measurements of elastic properties of media and adventitia of bovine carotid arteries. J Biomech. 1984;17:839–847. doi: 10.1016/0021-9290(84)90142-8. [DOI] [PubMed] [Google Scholar]
- Vossoughi J, Hedjazi Z, Borris F. Intimal residual stress and strain in large arteries. In: Langrana NA, Friedman MH, Grood ES, editors. Proc Summer Bioengineering Conf.; New York: ASME; 1993. pp. 434–437. [Google Scholar]
- Zeller PJ, Skalak TC. Contribution of individual structural components in determining the zero-stress state in small arteries. J Vasc Res. 1998;35:8–17. doi: 10.1159/000025560. [DOI] [PubMed] [Google Scholar]


