

Abstract
In a crowded scene we can effectively focus our attention on a specific speaker while largely ignoring sensory inputs from other speakers. How attended speech inputs are extracted from similar competing information has been primarily studied in the auditory domain. Here we examined the deployment of visuo-spatial attention in multiple speaker scenarios. Steady-state visual evoked potentials (SSVEP) were monitored as a real-time index of visual attention towards three competing speakers. Participants were instructed to detect a target syllable by the center speaker and ignore syllables from two flanking speakers. The study incorporated interference trials (syllables from three speakers), no-interference trials (syllable from center speaker only), and periods without speech stimulation in which static faces were presented. An enhancement of flanking speaker induced SSVEP was found 70-220 ms after sound onset over left temporal scalp during interference trials. This enhancement was negatively correlated with the behavioral performance of participants - those who showed largest enhancements had the worst speech recognition performance. Additionally, poorly performing participants exhibited enhanced flanking speaker induced SSVEP over visual scalp during periods without speech stimulation. The present study provides neurophysiologic evidence that the deployment of visuo-spatial attention to flanking speakers interferes with the recognition of multisensory speech signals under noisy environmental conditions.
Picture yourself at a cocktail party with the attendant hubbub of multiple conversations, background music and sundry other distracting noises. Traditionally, it is thought that the neural encoding of speech under such noisy environmental conditions is based on an auditory scene analysis in which competing auditory inputs are segregated into different objects (Asari et al., 2006; Carlyon, 2004). Studies of multisensory audiovisual speech processing, however, have demonstrated that visual information can vastly improve the perception of auditory inputs, facilitating auditory scene analysis. For instance, it has been shown that visual information is integrated in primate auditory cortex during the earliest stages of voice processing (Ghazanfar et al., 2005), and that visual inputs support audiovisual speech processing under circumstances where auditory inputs are degraded or masked by noise (Ross et al., 2007a, 2007b; Sumby and Pollack, 1954). Additionally, it has been suggested that visual information about the spatial location of speakers can serve as spatial cues to facilitate the processing of auditory speech during interference (Haykin and Chen, 2005; Kidd, Jr. et al., 2005). Together, these studies have shown that visual inputs play a crucial role during multisensory speech recognition, especially under noisy environmental conditions.
When multiple inputs are simultaneously presented in the visual field, their cortical representations interact in a competitive, suppressive way, especially when these inputs fall within the same receptive fields (Beck and Kastner, 2005; Kastner et al., 1998; Luck et al., 1997). The interactions between competing visual signals are expressed in an enhancement of neural responses in extrastriate areas to inputs that are located inside the focus of attention and an attenuation of neural activity to inputs surrounding the focus of attention (Hopf et al., 2006; Muller et al., 2005). As posited by the “biased competition” model (Desimone and Duncan, 1995), the allocation of visual attention may release attended inputs from the suppressive interactive effects of adjacent unattended inputs. When applying this model to a multiple speaker scenario, it would be expected that the allocation of visual attention towards relevant and irrelevant speakers has a strong impact on the processing of speech during interference. In a similar vein, it has been shown that attention towards a concurrently unrelated task in the visual, auditory (Alsius et al. 2005), or somatosensory (Alsius et al. 2007) modalities can reduce interactions between auditory and visual inputs during multisensory speech processing. Interestingly, the ability to process speech in a crowded scene varies considerably across persons (Conway et al., 2001; Wood and Cowan, 1995). For this reason, it can be predicted that possible differences in the subject's performances to successfully process speech in a crowded scene might be due to differences in the deployment of visual attention towards relevant and irrelevant speakers.
To test these predictions, we examined visual processing in a multisensory speech recognition task with three competing speakers. Sustained brain activity to visual inputs of a task-relevant center speaker and a pair of task-irrelevant flanking speaker was monitored using the steady-state visual evoked potential (SSVEP) as dependent measure. The SSVEP is an electrophysiological brain response induced by using rapidly flickering (repeating) stimuli (Hillyard et al., 1997). It has been previously shown that the amplitude of the SSVEP provides a real-time index of attentional deployment towards visual inputs (Morgan et al., 1996; Muller et al., 2003). Here, the SSVEP to task relevant and task irrelevant speakers, which were presented at different flickering rates, was monitored simultaneously during interference speech trials, no-interference speech trials, and during periods without speech stimulation. The results showed a clear negative relationship between the degree of visual attention allocation towards task irrelevant flanking speakers and speech recognition performance across participants.
Materials and Methods
Participants
Seventeen neurologically normal paid volunteers participated in the study. Four participants were excluded from the analysis on the basis of extensive eye movement artifacts. The remaining thirteen participants (all right handed, mean age 25.5y, range 19-35y, 6 females) reported normal hearing and had normal or corrected-to-normal vision. The Institutional Review Board of the Nathan Kline Institute for Psychiatric Research approved the experimental procedures, and each subject provided written informed consent.
Procedure
Participants were presented with a continuous stream of multisensory audiovisual speech stimuli in which syllables were produced either by a single center speaker (no-interference trials) or three syllables were simultaneously produced by the three speakers (interference trials). The participant's task was to detect the occasional appearance of the target syllable /ba/ from the center speaker and indicate targets with a right index finger button press as fast and as accurately as possible, while ignoring syllables by the surrounding two flanking speakers (Figure 1, a clip that shows the multiple speaker scenarios used in the study is provided in the online Supplementary material). During the experimental runs participants were instructed to maintain fixation at the center speaker face. In all trials, the center speaker produced one of four syllables (/ba/, /ta/, /da/ or /ga/). The target /ba/ was presented with a probability of 20 %, equally likely in interference and no-interference trials. Each of the two flanking speakers produced one of three syllables (/ta/, /da/ or /ga/) in the interference trials, whereas static faces of the flanking speakers were presented in the no-interference trials. In the interference trials, the three speakers never produced the same syllable at a time and syllable combinations that could evoke a McGurk illusion (McGurk and MacDonald, 1976), such as /ba/ and /ga/, were excluded. However, other fusion effects between the three syllables in the interference trials cannot be totally excluded. A table with all syllable combinations used in this study is provided in the online supplementary materials. On average 68 targets and 270 non-target stimuli were presented for interference and for no-interference trials at inter-stimulus intervals (ISI) between 613 and 1253 ms, in 160 ms steps (mean ISI = 933 ms). During the ISI static faces of the three speakers were presented on the screen. Additionally, 284 (i.e., 29.6% of all trials) omitted trial periods (Busse and Woldorff, 2003) were randomly inserted into the continuous stream of stimuli to measure the allocation of visual attention towards the three speakers without speech stimulation. During the omitted trial periods, static faces of the three speakers were presented for a time interval that was identical to the interval of regular experimental events (i.e., 660 ms). Each participant underwent 8 experimental blocks with 120 trials each.
Figure 1.
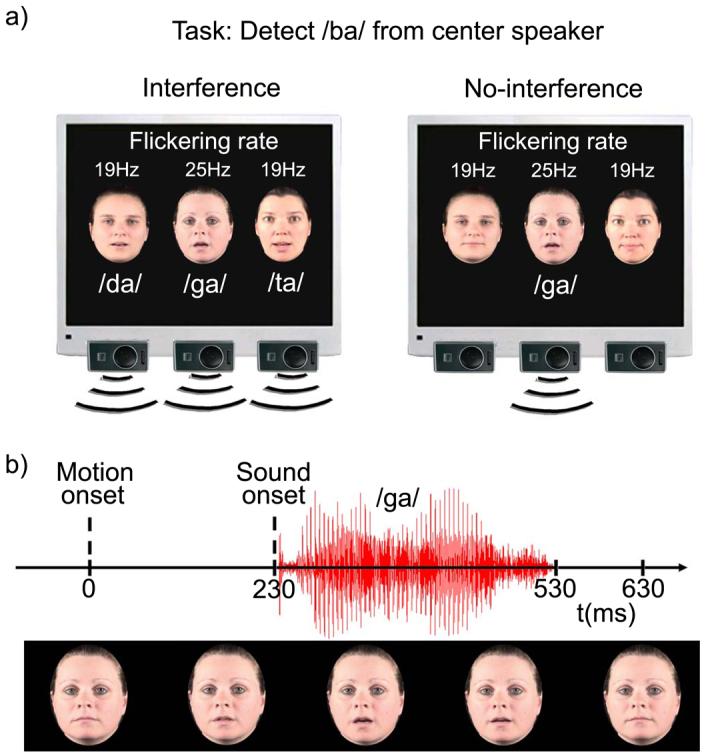
a) Three horizontally aligned speakers (one center and two flanking speakers) were presented on a monitor. In the interference trials (left panel) all three speakers produced a syllable at the same time. In the no-interference trials (right panel) only the center speaker produced a syllable. The subject's task was to detect the occasional presentation of the syllable /ba/ by the center speaker. The center speaker was presented at a flickering rate of 25 Hz, while the two flanking speakers were presented at a flickering rate of 19 Hz. b) The motion onset of the lips preceded the sound onset of the syllables on average by 230 ms.
In addition to the multisensory speech interference study, an auditory-alone control task was conducted with the same persons that participated in the multisensory study. The purpose of the control task was to estimate the impact of the visual inputs on audiovisual speech processing in the multisensory study. The same setup as in the multisensory study was used with the exception that completely blurred static images of the three speakers were presented instead of real faces. Behavioral data were analyzed for the control task and directly compared with the behavioral data of the multisensory study.
Stimuli
The syllables were recorded from three female speakers at frame rates of 30/s. Starting with the onset of the lip movements, each syllable consisted of 20 frames of 33 ms duration each, resulting in a total duration of 660 ms for each syllable. The three speakers were presented with a visual angle of 7° between adjacent speakers (from mouth to mouth). The width of the speakers' faces subtended a visual angle of 4.8° each. Throughout the experimental blocks the center speaker remained the same character. To balance any effects caused by differences between the two flanking speakers (visual or voice characteristics), the two flanking speakers were alternated every two blocks. The refresh rate of the monitor was set to 150 Hz (i.e., the refresh rate duration for one single frame was 6.66 ms). Steady-state evoked potentials to center and flanking speakers were induced by controlling the visual stimulation on a frame-by-frame basis as follows: The visual stimulation for the center speaker alternated between on (visual stimuli presented) and off (black frames presented) periods every 20 ms (i.e., every three monitor refresh rates), which corresponds to a visual on-off flicker at a frequency of 25 Hz. The on-off flicker also continued during the inter-stimulus intervals and during the omitted trial periods. On the neural level, the sustained on-off flicker manifest as sinusoidal waveforms with the temporal frequencies of the driving stimulus (e.g., Herrmann, 2001). For the two flanking speakers, the on-off periods of visual stimulation alternated simultaneously for both speakers every 26.6 ms, which corresponds to a visual on-off flicker of about 19 Hz. The 19 Hz flicker continued during the ISI and during the omitted trial periods. Importantly, all trials, including omitted trial periods, started with a visual-on period. The beginning of the interference and the no-interference trials were defined by the onset of the visual lip movements. Since all trials started with a visual-on period, it was possible to separately extract the event-related SSVEP in response to the center speaker (25 Hz) and flanking speakers (19 Hz) for each event type. Each experimental block started with the presentation of static flickering faces for about 10 seconds to enable the build-up of cortical SSVEP. The average stimulus duration of the acoustic syllables was 295 ms and the onset of the sounds of the syllables followed the onset of the visual lip movements by about 230 ms. The focus of analysis was on the examination of the event-related SSVEP. For this reason, it was important to control for any overlapping event-related 19 and 25 Hz responses induced by the sounds. As previously suggested (Senkowski et al., 2007; Woldorff, 1993), a relative stimulus onset jitter of 110 ms (more than two times the duration of a 19 Hz and a 25 Hz cycle) was used by adding or subtracting a random time interval between ±55 ms to the real acoustic sound onset in each trial. This jitter effectively eliminated the overlapping event-related 19 and 25 Hz responses to the acoustic inputs. The participants reported after the study to not have noticed any unusual onset asynchronies between visual and auditory inputs. The sound pressure level (SPL) of the syllables produced by the flanking speakers was set to a maximum of 72 dB SPL (for the simultaneous presentation of syllables from both the left and the right flanking speakers), while the SPL of each syllable by the central speaker was set to a maximum intensity of 65 dB SPL. To reduce the differences in voice characteristics between the three speakers, a spline curve FFT filter between 400 to 4000 Hz was applied to all syllables.
Data acquisition
The EEG was recorded from 2 EOG and 126 scalp electrodes (impedances < 5 kΩ), referenced to the nose at a sample rate of 500 Hz. Data were band-pass filtered from 0.05 to 100 Hz during recording and off-line re-referenced to average reference. Averaging epochs for EEG data lasted from 800 ms before to 800 ms after stimulus onset. Prior to averaging, baselines were computed from a −500 to −300 ms time interval before stimulus onset (i.e.,, lip movement onset) and subtracted from each trial. To remove artifacts from EEG signals trials were automatically excluded from averaging if the standard deviation within a moving 200 ms time interval exceeded 30 μV in any one of the EEG channels and 40 μV at the EOG channels in a time interval between −500 to 600 ms. For the acquisition of event-related SSVEP, a wavelet transform based on Morlet wavelet was employed on the average across single trials (i.e., on the event-related potentials) for each condition (Herrmann et al., 1999). For the analysis of event-related SSVEP in response to the flickering rate of the center speaker, a wavelet with a center frequency of f0 = 25 Hz was computed with the scaling factor a = 0.08 and a spectral bandwidth of 6 Hz. The length of the Morlet wavelet was 480 ms. For the analysis of SSVEP associated with the flickering rate of the two flanking speakers, a wavelet with a center frequency of f0 = 19 Hz was computed with the scaling factor a = 0.105 and a spectral bandwidth of 6 Hz. The length of the wavelet was 632 ms. For the generation of time-frequency representations Morlet wavelet transformations were calculated for the event-related activity separately for a 15 to 30 Hz range (in 0.4 Hz steps) for a midline-occipital and a left temporal electrode. For the wavelet transformations of the time-frequency representations, no baseline was subtracted.
Data analysis
For the analysis of reaction times (RT) to target stimuli, all trials were included in which participants provided a response between 230 ms (i.e., sound onset) and 1000 ms after visual motion onset. Additionally, trials in which the RT exceeded ±2.5 standard deviations from the mean RT within each condition and subject were excluded from the analysis of RTs.
To avoid the loss of statistical power inherent when repeated measures ANOVA is used to quantify multi-channel EEG data, the tests of amplitudes of SSVEP were limited to activity within three regions of interest (ROIs). In line with previous SSVEP investigations, and with the topographical distribution of SSVEP (Figure 4 and 6), we delineated one posterior ROI which comprises a symmetrically arranged cluster of midline occipital scalp (e.g., Muller et al., 2003). In addition, a pair of lateral temporal ROIs (left and right) that exhibited the largest overall SSVEP enhancements to speech stimuli in the interference trials was selected. Each ROI consisted of five channels that were topographically located over the selected scalp regions. The focus of the SSVEP analysis was on the “standard” (i.e., non-target) stimuli. To statistically investigate SSVEP in response to the three speakers, three analysis steps were applied. The first analysis step was conducted to examine the effects of speech interference on the processing of the three speakers. In line with recent observations of visual effects on auditory speech processing (Besle et al., 2004; Hertrich et al., 2007), a response interval between 70-220 ms after sound onset (i.e., 300-450 ms after visual motion onset) was selected for the analysis of speech interference effects as described in further detail in Results. In the second analysis step, the relationships between the degree of interference effects in behavioral data, as reflected in RTs differences between interference and no-interference target trials, and SSVEP differences between interference and no-interference trials were examined using linear regression analyses with RT differences as independent and SSVEP amplitude differences as dependent variables. The analyses were performed separately for each ROI when significant differences between interference and no-interference trials were found in the first analysis step. Finally, it was examined in regression analyses whether the sustained allocation of visual attention towards the center and flanking speakers, as reflected in the SSVEP amplitudes during omitted trial periods, was related to the participants' distractibility1 during speech processing (RT differences between interference and no-interference target trials) and to differences between the SSVEP in interference minus no-interference trials. Again, these analyses were conducted separately for each ROI when significant effects were observed in the first analysis step. The mean amplitudes of SSVEP during the omitted trials were computed without baseline correction for the time interval between 100 to 500 ms for the center and flanking speaker separately.
Figure 4.
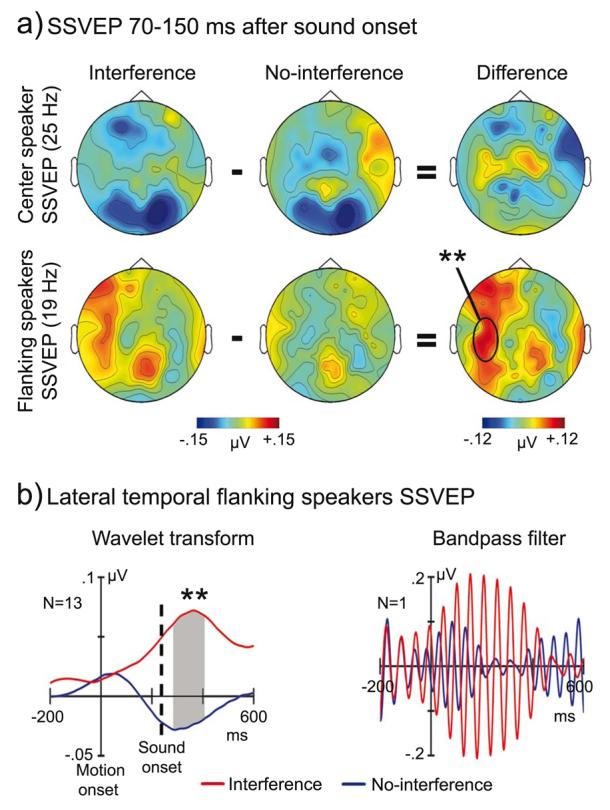
a) Topographic maps of wavelet transformed 19 and 25 Hz SSVEP amplitudes 70-150 ms after sound onset. Significant larger amplitudes in the interference compared to the no-interference trials were found for flanking speakers SSVEP (19 Hz, magenta rectangle) over left temporal scalp (lower panel). b) Grand average (N=13) traces of wavelet transformed flanking speakers SSVEP at a left temporal channel (left panel). The right panel shows 19 Hz bandpass-filtered SSVEP, to flanking speakers' inputs for one representative subject, with comparable filter characteristics as used for the 19 Hz wavelet transform. Note that the very early enhancement of interference compared to no-interference SSVEP is due to temporal smearing during the wavelet transform and bandpass-filtering. Data displayed in the figure are baseline corrected. ** p < 0.01
Figure 6.

Time-frequency representations of one midline-occipital channel and topographic maps (100-500 ms) of wavelet transformed SSVEP during omitted trial periods. The left panel shows the average SSVEP for the six participants with the highest interference effects in RTs, whereas the middle panel illustrates the average SSVEP of the six participants with the lowest interference effects in RTs. Differences between highly distracted and low distracted participants were found for flanking speakers SSVEP (19 Hz, magenta rectangle) at occipital scalp (right panel). Data are plotted without baseline correction. * p < 0.05
Results
Behavioral results
An analysis of variance (ANOVA) for RTs triggered to the onset of lip movements in the multisensory task showed significantly shorter RTs in the no-interference (689 ms) compared to the interference trials (728 ms; F(1,12)=16.22, p<.002). In addition, there was a higher hit-rate (HR) in the no-interference (93 %) compared to interference trials (76 %; F(1,12)=11.36, p<.007), whereas the false alarm (FA) rate did not differ significantly between no-interference (0.5 %) and interference trials (0.9 %). In the auditory-alone control task, significantly shorter RTs were observed for no-interference (515 ms) compared to interference trials (594 ms; F(1,11)=17.61, p<.001). Note that RTs here were triggered to auditory onset and that one subject who did not have hits during the interference trials in the control task was excluded from the analysis of RTs. The HR was much higher for no-interference (90 %) compared to interference trials (27 %; F(1,12)=69.31, p<.001), whereas the FA rate was higher for interference (5 %) compared to no-interference trials (1 %; F(1,12)=7.03, p<.001).
In a further analysis, HR and FA rates were compared between the multisensory task and the auditory-alone control task. The RTs were not directly compared because the visual inputs in the multisensory task served equally as temporal cues for the sound onset in the interference and no-interference condition. This cuing effect can interfere with the possible stronger impact of visual inputs in the interference compared to the no-interference trials. The ANOVA for HR, using the factors condition (interference and no-interference) and task (main multisensory experiment and unisensory control task), revealed significant main effects of condition (F(1,12)=48.63, p<.001) and task (F(1,12)=48.13, p<.001), and an interaction between task and condition (F(1,12)=63.58, p<.001). The HR was higher in the multisensory (82.4 %) compared to the unisensory control task (58.5%) and it was overall higher in the no-interference (91.2 %) than in interference trials (51.5 %). Follow-up ANOVAs were computed for interference and no-interference trials separately using the factor task (multisensory study and unisensory control task). For interference trials a significant higher HR in the multisensory (76 %) compared to the unisensory control task was observed (27 %, F(1,12)=59.15, p<.001)). No significant effects were found for no-interference trials. The ANOVA for the FA rate revealed significant main effects of the factors condition (F(1,12)=6.23, p<0.03) and task (F(1,12)=5.76, p<.04), and an interaction between task and condition (F(1,12)=6.31, p<.03). The FA rate was higher in the control task (2.8 %) than in the multisensory study (0.6 %) and higher in interference (2.9 %) compared to the no-interference trials (0.5 %). Follow-up ANOVAs were computed for interference and no interference trials using the factor task. For interference trials, a significant higher FA rate was found in the control task (5 %) compared to the multisensory study (0.9 %; F(1,12)=6.04, p<.03). No significant effects were observed for no-interference trials. The results showed that the presentation of visual speech inputs clearly improved speech recognition during interference in the multisensory study.
SSVEP and behavioral results
Time-frequency representations of posterior event-related SSVEP showed two bands of enhanced spectral activity at precisely the flickering rate of the flanking speakers (19 Hz) and the center speaker (25 Hz) (Figure 2 and Supplementary Figure 1). Repeated measurement ANOVAs were performed separately for the wavelet transformed event-related 19 Hz (flanking speakers) and 25 Hz (center speaker) responses using the within subject factors condition (interference, no-interference) and ROI (left lateral temporal, right lateral temporal, and occipital). The ANOVA assessing SSVEP amplitudes induced to the flanking speakers revealed a significant main effect of ROI (F(1,12)=6.72, p<.005) due to larger amplitudes at posterior (0.06 μV) compared to temporal ROIs (mean left/right: 0.01 μV). In addition, a significant interaction between condition and ROI was found (F(1,12)=5.26, p<.02). Follow-up ANOVAs for the three ROIs separately revealed a significant effect of condition for the left temporal ROI (F(1,12)=11.62, p<.006) due to larger amplitudes during interference (0.07 μV) compared to no-interference trials (−0.02 μV, Figure 3 and 4). No other significant effects were found.
Figure 2.
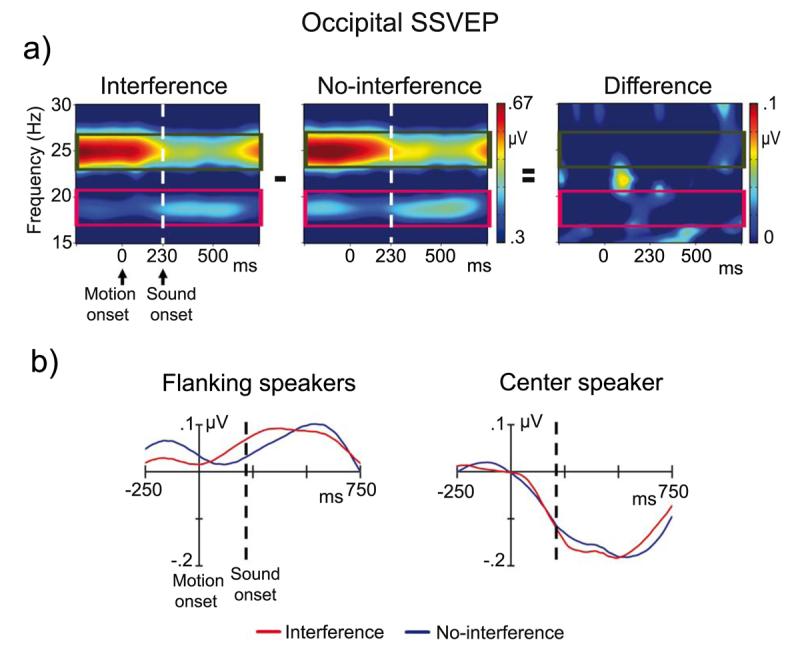
a) Time-frequency planes and traces of a right-occipital channel of wavelet transformed SSVEP in interference (left panel), no-interference (midddle panel) trials. The time-frequency planes showed a decrease in center speaker SSVEP (25 Hz, green rectangle) after sound onset in both conditions, which may be reflect an attention shift from visual towards the auditory inputs. In contrast, the amplitude of flanking speakers SSVEP (19 Hz, magenta rectangle) slightly increased after sound onset. There were no significant differences between interference and no-interference trials (right panel). b) Traces of wavelet transformed 19 Hz SSVEP to flanking speakers (left panel) and 25 Hz SSVEP to the center speaker (right panel) in interference trials (red line) and no-interference trials (blue line). No significant differences were found between interference and no-interference trials over posterior areas. Data in panel a are plotted without baseline correction, whereas the traces in panel b were baseline corrected
Figure 3.

Time-frequency planes of a left-temporal channel for interference (left panel) and no-interference (middle panel). The figure illustrates larger SSVEP in response to visual flanking speakers' inputs (19 Hz, magenta rectangle) at left temporal scalp for interference compared to no-interference trials (right panel). The TF planes are plotted without baseline correction. ** p < 0.01
In further analyses the left temporal SSVEP enhancements to flanking speakers during interference trials was investigated in relation to the subject's distractibility in behavioral performance, as indexed in RT differences between interference and no-interference target trials. Linear regression analyses between the left temporal SSVEP interference effects to flanking speakers (interference minus no-interference trials) and the interference effects in RTs (interference minus no-interference trials) revealed a positive relationship (standardized Beta=.78, p<.003). The degree of SSVEP enhancement to flanking speakers was closely related to the distractibility of participants in behavior – those who had higher enhancements were more distracted as shown by prolonged RTs. No such effects were found for right temporal or occipital responses (Figure 5). However, this effect might be, in part, related to extreme or outlier values. Therefore, a non-parametric Spearman rank correlation was computed, which is more robust to outliers. Confirming the finding from the linear regression analysis, this analysis also revealed a significant association between the SSVEP enhancements to flanking speakers in the interference compared to no-interference trials and the interference effect in RTs (rho = .65, p < 0.02).
Figure 5.

Linear regression between flanking speakers SSVEP (interference minus no-interference trials) and RTs (interference minus no-interference trials). A positive correlation (r=.78) was observed between the left temporal amplitude enhancement in SSVEP and the degree of behavioral distractibility in RTs. ** p < 0.01
Next, the association between the sustained allocation of visual attention, as reflected in the SSVEP during omitted trials, and the behavioral distractibility (RTs to interference minus no-interference trials) during speech processing was investigated. A split-half comparison of time-frequency representations and topographic maps between the six participants with the highest degree of distractibility in behavioral performance and the six participants with the lowest degree of distractibility in behavioral performance revealed clear effects over posterior regions for the flanking speaker induced SSVEP (Figure 6). The posterior SSVEP in response to the flanking speakers was much larger (0.83 μV) in participants with a high degree of distractibility in behavioral data than in participants with a low degree of behavioral distractibility (0.39 μV) (independent-measures ANOVA: F(1,10)=7.01, p < .024). The RT difference between interference and no-interference trials was significantly larger in highly distracted participants (63 ms) compared to less distracted participants (17 ms, F(1,10)=7.44, p < .021), whereas the overall RTs for interference and no-interference trials did not differ between highly and less distracted participants. Complementing this analysis, the relationships between omitted trials SSVEP and RTs differences between interference and no-interference trials were also examined across all participants using linear regression analyses. For the SSVEP induced by the visual inputs from flanking speaker, a significant relationship was found for the posterior ROI (standardized Beta=.73, p<.007, Figure 7). This relationship was also significant when a non-parametric Spearman rank correlation was used (rho = .55, p < 0.05). Participants with attenuated SSVEP during omitted trial periods showed better behavioral performances during speech processing than participants with enhanced SSVEP. A trend toward a significant association between the flanking speakers SSVEP and interference effects in behavioral data was observed for the right temporal ROI (standardized Beta=.55, p<.06), whereas no effects were found for the left temporal ROI and for the linear regression analyses of the center speaker SSVEP.
Figure 7.

Linear regression between flanking speakers SSVEP during omitted trial periods and interference effects in RTs (interference minus no-interference trials). A positive correlation (r = .71) between the amplitude enhancement in SSVEP and the interference effects in RTs was observed at occipital scalp and a trend toward a significant association was found over right temporal regions. † p < 0.1, ** p < 0.01
Finally, it was tested across participants whether there was an association between the posterior SSVEP in responses to flanking speakers during omitted trial periods and the left medial temporal amplitude enhancement found in flanking speakers SSVEP for interference compared to no-interference trials. The linear regression analysis revealed a close association between the posterior flanking speakers SSVEP during omitted trial periods and the left medial temporal amplitude enhancement of flanking speakers SSVEP during speech interference trials (standardized Beta=.74, p<.004). Participants with higher occipital flanking speakers SSVEP during omitted trial periods showed stronger enhancements of SSVEP for interference compared to no-interference trials than participants with smaller omitted trial flanking speakers SSVEP.
Discussion
In this study we examined the effects of visual spatial attention on multisensory speech processing in a multiple speaker scenario. By monitoring SSVEP as a real-time index for the allocation of visual attention in a multiple speaker scenario, we observed that the deployment of attention towards the visual inputs from flanking speaker interferes with speech recognition performance. We discuss these findings in detail below.
Visual attention during multisensory speech processing
A robust increase in behavioral performance was found for the interference trials when the visual information was presented during the multisensory manipulation compared to when it was not presented during the auditory-alone control task (i.e., the improvement in accuracy was fully 49 %). In line with previous studies (Ross et al. 2007a; Sumby and Pollack, 1954), this result revealed further evidence that visual inputs can facilitate speech recognition under noisy environmental conditions.
When comparing the SSVEP during interference to those during no-interference trials in the multiple speaker interference task, we observed an enhancement of responses over left temporal scalp 70-220 ms after the sound onset in response to the flanking speaker inputs. Interestingly, it has been shown that auditory “what” and “where” processing of speech stimuli in temporal cortex (Ahveninen et al., 2006) and involuntary attention switches to distracting auditory inputs (Escera et al., 2000) occur at similar latencies. Moreover, the latency of the left temporal interference effect also fits with the latency of recently reported visual influences on audiovisual speech processing in auditory cortex (Besle et al., 2004; Hertrich et al., 2007). As such, it is likely that the observed enhancement of SSVEP during interference trials reflects speech related processing of the visual flanking speakers inputs. The observation that the interference effect was localized over the left hemisphere is in line with the left hemispheric dominance in audiovisual speech processing. This dominance has been previously localized to auditory cortex, superior temporal sulcus (STS), and medial and superior temporal gyri (MTG and STG, respectively) (Callan et al., 2004; Calvert et al., 2000; Miller and D'Esposito, 2005; Saint-Amour et al., 2007). We therefore suggest that the effect reported here over left temporal scalp after the acoustic presentation of the syllables may reflect the processing of visual signals from flanking speakers in left hemispheric speech related regions.
A second finding of note was the correlation between the left temporal interference effect in flanking speaker induced SSVEP and the distractibility of participants in behavioral performance – participants who showed the largest enhancements in the interference trials had the worst speech recognition performance. Attention towards the visual inputs of an audiovisual object has been shown to enhance the processing of simultaneously presented auditory stimuli in auditory cortex (Busse et al., 2005). In addition, stronger multisensory interactions have been reported for attended compared to unattended audiovisual inputs in space (Senkowski et al., 2005; Talsma and Woldorff, 2005). We therefore assume that highly distracted participants were less able to neglect the visual inputs from flanking speaker and that this may have caused a stronger interference effect from these inputs. However, against our predictions, there were no differences in the center speaker SSVEP between interference and no-interference trials. The amplitude of occipital center speaker SSVEP clearly declined after the onset of speech inputs (Figure 2), whereas the amplitude of the SSVEP to flanking speakers increased. Since the most robust decline for the center speaker SSVEP was found after sound onset, it might be that the onset of the auditory speech inputs has triggered an attention shift from vision to audition, which would be in line with a recent fMRI study that has shown a decrease in visual cortex activity when attention is shifted from the visual to the auditory modality (Shomstein and Yantis, 2004). Similar suppression of visual processing during auditory attention has also been seen in event-related potential (ERP) studies (Foxe et al., 1998; 2005). The shift of attention from vision to audition in the present study might have attenuated or masked possible suppressive effects from the flanking speaker inputs on the processing of the visual speech signals from the center speaker. Future studies will be necessary to examine in more detail whether and under which conditions visual processing of attended center speaker may be affected by interfering speech signals from flanking speakers.
When interpreting these results, it is important to consider the possible influence of differences in stimulus properties between interference and no-interference trials. It might be that visual motion induced event-related responses in the frequency ranges of the flanking speakers (19 Hz) or the center speaker (25 Hz) overlapped with the phonemic processing of the audiovisual speech inputs. For instance, in the interference trials the faces (e.g., the lips) of all three speakers were simultaneously in motion, whereas in the no-interference trials only the center speaker produced a syllable. However, the effects on flanking speakers SSVEP were found 70-220 ms after the onset of auditory inputs and thus 300-450 ms after the onset of the visual lip movement. Event-related 19 Hz and 25 Hz visual responses at this latency are usually jittered across trials, and thus tend to cancel out during time-locked averaging (Senkowski et al., 2006). Moreover, if the visual motion induced event-related responses due to differences in stimulus properties had influenced the results, we would have expected to find enhancements in both 19 Hz and in 25 Hz SSVEP, and that these effects would primarily occur over posterior scalp (Muller et al., 1998a). To control for overlap of possible event-related 19 Hz and 25 Hz responses to the auditory speech inputs on the SSVEP, a relative onset time jitter of auditory stimuli was used to effectively eliminate the event-related responses in these frequency ranges (Woldorff, 1993). In seminal work examining the convolution of overlapping activity from temporally adjacent ERPs, Woldorff posited that “the effective jitter range needs to be larger than the period of the slowest dominant waves in the overlapping responses” (Woldorff, 1993, p. 99). In the present study the relative onset jitter was 110 ms, which is twice the length of a 19 Hz cycle (∼ 53 ms). As such, it is implausible that auditory event-related responses due to stimulus property differences between interference and no-interference trials could have contributed to the enhanced flanking speakers SSVEP over left temporal scalp.
Finally, it is possible that other factors, including non-speech related ones, may have contributed to the results. For instance, it is not clear whether simple visual motion inputs in combination with auditory speech sounds would have led to similar interference effects. Additionally, it would be also interesting to examine possible interference effects for conditions where the flanking speakers move their lips without producing auditory syllables and when degraded auditory syllables would be presented by the flanking speakers.
Sustained visual attention during omitted trial periods
The amplitude of occipital SSVEP induced by the visual signals from the flanking speaker during omitted trial periods was negatively related to the behavioral performance of participants during speech recognition in the multiple speaker condition. Participants with large SSVEP in response to the visual inputs from flanking speakers during omitted trial periods were more distracted in speech recognition than participants with small SSVEP. This effect was most robust over occipital areas including extrastriate cortex. In line with observations of enhanced posterior SSVEP for attended compared to unattended visual stimuli (Hillyard et al., 1997; Muller et al., 1998b), it seems likely that the SSVEP amplitude during omitted trial periods is related to the allocation of visual attention towards the visual inputs of the flanking speakers. Therefore, we suggest that the enhanced occipital SSVEP in highly distracted participants is the result of a more pronounced sustained deployment of visual attention towards the flanking speakers. This interpretation fits also with the observed positive relationship between the occipital SSVEP to flanking speakers during omitted trial periods and the left-temporal amplitude increase during speech processing in interference compared to no-interference trials.
Summary and Conclusion
The present study provides, to our knowledge, the first neurophysiologic evidence for the important role of visuo-spatial attention in speech recognition during multiple speaker interference. We found that participants who allocated more spatial attention towards the visual inputs from flanking speakers were more distracted in speech recognition performance than those who allocated less attention to these inputs. This raises the question about the general nature of visual information processing in multiple speaker interference scenarios. It has been recently suggested that most cortical operations are multisensory in its essence (Foxe and Schroeder, 2005; Ghazanfar and Schroeder, 2006). As such, our study suggests that the deployment of attention towards visual signals from flanking speakers has a negative influence on the recognition of multisensory speech signals. Conclusively, our data showed that the recognition of speech under noisy environmental conditions involves the processing of the multiple sensory inputs of a scene and that the deployment of visuo-spatial attention towards irrelevant inputs from flanking speakers has a clear negative impact on multisensory speech recognition.
Supplementary Material
Acknowledgments
This work was supported by a grant from the U.S. National Institute of Mental Health (MH65350) to Dr. J.J. Foxe. Dr. D. Senkowski also received support from a NARSAD young investigator award and the German Research Foundation (SE 1859/1-1). We would like to thank Dr. Simon Kelly and Dr. Alexander Meye for discussions of the data and analysis, Marina Shpaner and Jennifer Montesi for their technical assistance, and three anonymous reviewers for their very helpful comments during revision of this article.
Footnotes
Publisher's Disclaimer: This is a PDF file of an unedited manuscript that has been accepted for publication. As a service to our customers we are providing this early version of the manuscript. The manuscript will undergo copyediting, typesetting, and review of the resulting proof before it is published in its final citable form. Please note that during the production process errors may be discovered which could affect the content, and all legal disclaimers that apply to the journal pertain.
In this article, we will use the term “distractibility” to refer to the performance difference of participants between no-interference and interference trials. Participants with large performance differences (i.e., participants who clearly perform worse in interference compared to no-interference trials) are labeled “high distracted”. Participants with a small performance difference are labeled “low distracted”.
References
- Ahveninen J, Jaaskelainen IP, Raij T, Bonmassar G, Devore S, Hamalainen M, Levanen S, Lin FH, Sams M, Shinn-Cunningham BG, Witzel T, Belliveau JW. Task-modulated “what” and “where” pathways in human auditory cortex. Proc Natl. Acad. Sci. USA. 2006;103:14608–14613. doi: 10.1073/pnas.0510480103. [DOI] [PMC free article] [PubMed] [Google Scholar]
- Alsius A, Navarra J, Campbell R, Soto-Faraco S. Audiovisual integration of speech falters under high attention demands. Curr. Biol. 2005;15:839–843. doi: 10.1016/j.cub.2005.03.046. [DOI] [PubMed] [Google Scholar]
- Alsius A, Navarra J, Soto-Faraco S. Attention to touch weakens audiovisual speech integration. Exp. Br. Res. 2007;183:399–404. doi: 10.1007/s00221-007-1110-1. [DOI] [PubMed] [Google Scholar]
- Asari H, Pearlmutter BA, Zador AM. Sparse representations for the cocktail party problem. J. Neurosci. 2006;26:7477–7490. doi: 10.1523/JNEUROSCI.1563-06.2006. [DOI] [PMC free article] [PubMed] [Google Scholar]
- Beck DM, Kastner S. Stimulus context modulates competition in human extrastriate cortex. Nat. Neurosci. 2005;8:1110–1116. doi: 10.1038/nn1501. [DOI] [PMC free article] [PubMed] [Google Scholar]
- Besle J, Fort A, Delpuech C, Giard MH. Bimodal speech: early suppressive visual effects in human auditory cortex. Eur. J. Neurosci. 2004;20:2225–2234. doi: 10.1111/j.1460-9568.2004.03670.x. [DOI] [PMC free article] [PubMed] [Google Scholar]
- Busse L, Roberts KC, Crist RE, Weissman DH, Woldorff MG. The spread of attention across modalities and space in a multisensory object. Proc. Natl. Acad. Sci. USA. 2005;102:18751–18756. doi: 10.1073/pnas.0507704102. [DOI] [PMC free article] [PubMed] [Google Scholar]
- Busse L, Woldorff MG. The ERP omitted stimulus response to “no-stim” events and its implications for fast-rate event-related fMRI designs. Neuroimage. 2003;18:856–864. doi: 10.1016/s1053-8119(03)00012-0. [DOI] [PubMed] [Google Scholar]
- Callan DE, Jones JA, Munhall K, Kroos C, Callan AM, Vatikiotis-Bateson E. Multisensory integration sites identified by perception of spatial wavelet filtered visual speech gesture information. J. Cogn. Neurosci. 2004;16:805–816. doi: 10.1162/089892904970771. [DOI] [PubMed] [Google Scholar]
- Calvert GA, Campbell R, Brammer MJ. Evidence from functional magnetic resonance imaging of crossmodal binding in the human heteromodal cortex. Curr. Biol. 2000;10:649–657. doi: 10.1016/s0960-9822(00)00513-3. [DOI] [PubMed] [Google Scholar]
- Carlyon RP. How the brain separates sounds. Trends. Cogn. Sci. 2004;8:465–471. doi: 10.1016/j.tics.2004.08.008. [DOI] [PubMed] [Google Scholar]
- Conway AR, Cowan N, Bunting MF. The cocktail party phenomenon revisited: the importance of working memory capacity. Psychon. Bull. Rev. 2001;8:331–335. doi: 10.3758/bf03196169. [DOI] [PubMed] [Google Scholar]
- Desimone R, Duncan J. Neural mechanisms of selective visual attention. Annu. Rev. Neurosci. 1995;18:193–222. doi: 10.1146/annurev.ne.18.030195.001205. [DOI] [PubMed] [Google Scholar]
- Escera C, Alho K, Schroger E, Winkler I. Involuntary attention and distractibility as evaluated with event-related brain potentials. Audiol. Neurootol. 2000;5:151–166. doi: 10.1159/000013877. [DOI] [PubMed] [Google Scholar]
- Foxe JJ, Schroeder CE. The case for feedforward multisensory convergence during early cortical processing. Neuroreport. 2005;16:419–423. doi: 10.1097/00001756-200504040-00001. [DOI] [PubMed] [Google Scholar]
- Foxe JJ, Simpson GV. Biasing the brain's attentional set: II. effects of selective intersensory attentional deployments on subsequent sensory processing. Exp. Brain Res. 2005;166:393–401. doi: 10.1007/s00221-005-2379-6. [DOI] [PubMed] [Google Scholar]
- Foxe JJ, Simpson GV, Ahlfors SP. Parieto-occipital approximately 10 Hz activity reflects anticipatory state of visual attention mechanisms. Neuroreport. 1998;9:3929–3933. doi: 10.1097/00001756-199812010-00030. [DOI] [PubMed] [Google Scholar]
- Ghazanfar AA, Maier JX, Hoffman KL, Logothetis NK. Multisensory integration of dynamic faces and voices in rhesus monkey auditory cortex. J. Neurosci. 2005;25:5004–5012. doi: 10.1523/JNEUROSCI.0799-05.2005. [DOI] [PMC free article] [PubMed] [Google Scholar]
- Ghazanfar AA, Schroeder CE. Is neocortex essentially multisensory? Trends Cogn. Sci. 2006;10:278–285. doi: 10.1016/j.tics.2006.04.008. [DOI] [PubMed] [Google Scholar]
- Haykin S, Chen Z. The cocktail party problem. Neural Comput. 2005;17:1875–1902. doi: 10.1162/0899766054322964. [DOI] [PubMed] [Google Scholar]
- Herrmann CS. Human EEG responses to 1-100 Hz flicker: resonance phenomena in visual cortex and their potential correlation to cognitive phenomena. Exp. Brain Res. 2001;137:346–353. doi: 10.1007/s002210100682. [DOI] [PubMed] [Google Scholar]
- Herrmann CS, Mecklinger A, Pfeifer E. Gamma responses and ERPs in a visual classification task. Clin. Neurophysiol. 1999;110:636–642. doi: 10.1016/s1388-2457(99)00002-4. [DOI] [PubMed] [Google Scholar]
- Hertrich I, Mathiak K, Lutzenberger W, Menning H, Ackermann H. Sequential audiovisual interactions during speech perception: a whole-head MEG study. Neuropsychologia. 2007;45:1342–1354. doi: 10.1016/j.neuropsychologia.2006.09.019. [DOI] [PubMed] [Google Scholar]
- Hillyard SA, Hinrichs H, Tempelmann C, Morgan ST, Hansen JC, Scheich H, Heinze HJ. Combining steady-state visual evoked potentials and fMRI to localize brain activity during selective attention. Hum. Brain Mapp. 1997;5:287–292. doi: 10.1002/(SICI)1097-0193(1997)5:4<287::AID-HBM14>3.0.CO;2-B. [DOI] [PubMed] [Google Scholar]
- Hopf JM, Boehler CN, Luck SJ, Tsotsos JK, Heinze HJ, Schoenfeld MA. Direct neurophysiological evidence for spatial suppression surrounding the focus of attention in vision. Proc. Natl. Acad. Sci. USA. 2006;103:1053–1058. doi: 10.1073/pnas.0507746103. [DOI] [PMC free article] [PubMed] [Google Scholar]
- Kastner S, De Weerd P, Desimone R, Ungerleider LG. Mechanisms of directed attention in the human extrastriate cortex as revealed by functional MRI. Science. 1998;282:108–111. doi: 10.1126/science.282.5386.108. [DOI] [PubMed] [Google Scholar]
- Kidd G, Jr., Arbogast TL, Mason CR, Gallun FJ. The advantage of knowing where to listen. J. Acoust. Soc. Am. 2005;118:3804–3815. doi: 10.1121/1.2109187. [DOI] [PubMed] [Google Scholar]
- Luck SJ, Chelazzi L, Hillyard SA, Desimone R. Neural mechanisms of spatial selective attention in areas V1, V2, and V4 of macaque visual cortex. J. Neurophysiol. 1997;77:24–42. doi: 10.1152/jn.1997.77.1.24. [DOI] [PubMed] [Google Scholar]
- McGurk H, MacDonald J. Hearing lips and seeing voices. Nature. 1976;264:746–748. doi: 10.1038/264746a0. [DOI] [PubMed] [Google Scholar]
- Miller LM, D'Esposito M. Perceptual fusion and stimulus coincidence in the cross-modal integration of speech. J. Neurosci. 2005;25:5884–5893. doi: 10.1523/JNEUROSCI.0896-05.2005. [DOI] [PMC free article] [PubMed] [Google Scholar]
- Morgan ST, Hansen JC, Hillyard SA. Selective attention to stimulus location modulates the steady-state visual evoked potential. Proc. Natl. Acad. Sci. USA. 1996;93:4770–4774. doi: 10.1073/pnas.93.10.4770. [DOI] [PMC free article] [PubMed] [Google Scholar]
- Muller MM, Malinowski P, Gruber T, Hillyard SA. Sustained division of the attentional spotlight. Nature. 2003;424:309–312. doi: 10.1038/nature01812. [DOI] [PubMed] [Google Scholar]
- Muller MM, Picton TW, Valdes-Sosa P, Riera J, Teder-Salejarvi WA, Hillyard SA. Effects of spatial selective attention on the steady-state visual evoked potential in the 20-28 Hz range. Brain Res. Cogn. Brain Res. 1998a;6:249–261. doi: 10.1016/s0926-6410(97)00036-0. [DOI] [PubMed] [Google Scholar]
- Muller MM, Teder-Salejarvi W, Hillyard SA. The time course of cortical facilitation during cued shifts of spatial attention. Nat. Neurosci. 1998b;1:631–634. doi: 10.1038/2865. [DOI] [PubMed] [Google Scholar]
- Muller NG, Mollenhauer M, Rosler A, Kleinschmidt A. The attentional field has a Mexican hat distribution. Vision Res. 2005;45:1129–1137. doi: 10.1016/j.visres.2004.11.003. [DOI] [PubMed] [Google Scholar]
- Ross LA, Saint-Amour D, Leavitt VM, Javitt DC, Foxe JJ. Do you see what I am saying? Exploring visual enhancement of speech comprehension in noisy environments. Cereb. Cortex. 2007a;17:1147–1153. doi: 10.1093/cercor/bhl024. [DOI] [PubMed] [Google Scholar]
- Ross LA, Saint-Amour D, Leavitt VM, Molholm S, Javitt DC, Foxe JJ. Impaired Multisensory Processing in Schizophrenia: Deficits in Visual Enhancement of Speech Comprehension Under Noisy Environmental Conditions. Schizophrenia Research. 2007b;97:173–183. doi: 10.1016/j.schres.2007.08.008. [DOI] [PubMed] [Google Scholar]
- Saint-Amour D, De Sanctis SP, Molholm S, Ritter W, Foxe JJ. Seeing voices: High-density electrical mapping and source-analysis of the multisensory mismatch negativity evoked during the McGurk illusion. Neuropsychologia. 2007;45:587–597. doi: 10.1016/j.neuropsychologia.2006.03.036. [DOI] [PMC free article] [PubMed] [Google Scholar]
- Senkowski D, Molholm S, Gomez-Ramirez M, Foxe JJ. Oscillatory Beta Activity Predicts Response Speed during a Multisensory Audiovisual Reaction Time Task: A High-Density Electrical Mapping Study. Cereb. Cortex. 2006;16:1556–1565. doi: 10.1093/cercor/bhj091. [DOI] [PubMed] [Google Scholar]
- Senkowski D, Talsma D, Grigutsch M, Herrmann CS, Woldorff MG. Good times for multisensory integration: Effects of the precision of temporal synchrony as revealed by gamma-band oscillations. Neuropsychologia. 2007;45:561–571. doi: 10.1016/j.neuropsychologia.2006.01.013. [DOI] [PubMed] [Google Scholar]
- Senkowski D, Talsma D, Herrmann CS, Woldorff MG. Multisensory processing and oscillatory gamma responses: Effects of spatial selective attention. Exp. Brain Res. 2005;3-4:411–426. doi: 10.1007/s00221-005-2381-z. [DOI] [PubMed] [Google Scholar]
- Shomstein S, Yantis S. Control of attention shifts between vision and audition in human cortex. J. Neurosci. 2004;24:10702–10706. doi: 10.1523/JNEUROSCI.2939-04.2004. [DOI] [PMC free article] [PubMed] [Google Scholar]
- Sumby WH, Pollack I. Visual contribution to speech intelligibility in noise. J. Acoust Soc Am. 1954;26:212–215. [Google Scholar]
- Talsma D, Woldorff MG. Selective attention and multisensory integration: Multiple phases of effects on the evoked brain activity. J. Cogn. Neurosci. 2005;17:1098–1114. doi: 10.1162/0898929054475172. [DOI] [PubMed] [Google Scholar]
- Woldorff MG. Distortion of ERP averages due to overlap from temporally adjacent ERPs: analysis and correction. Psychophysiology. 1993;30:98–119. doi: 10.1111/j.1469-8986.1993.tb03209.x. [DOI] [PubMed] [Google Scholar]
- Wood NL, Cowan N. The cocktail party phenomenon revisited: attention and memory in the classic selective listening procedure of Cherry (1953) J. Exp. Psychol. Gen. 1995;124:243–262. doi: 10.1037//0096-3445.124.3.243. [DOI] [PubMed] [Google Scholar]
Associated Data
This section collects any data citations, data availability statements, or supplementary materials included in this article.