

Abstract
Although a great deal is known about T cell entry into lymph nodes (LNs)3, much less is understood about how T lymphocytes access the splenic white pulp (WP). We show here that, as recently described for LNs, fibroblastic reticular cells (FRCs) form a network in the T cell zone (periarteriolar lymphoid sheath, PALS) of the WP on which T lymphocytes migrate. This network connects the PALS to the marginal zone (MZ), which is the initial site of lymphocyte entry from the blood. T cells do not enter the WP at random locations but instead traffic to that site using the FRC-rich MZ bridging channels (MZBCs). These data reveal that FRCs form a substrate for T cells in the spleen, guiding these lymphocytes from their site of entry in the MZ into the PALS, within which they continue to move on the same network.
Keywords: Spleen, lymph nodes, cell trafficking, stromal cells, T lymphocytes
Introduction
“Spleen is quantitatively the most important organ in the lymphoid system, with more lymphocytes passing through this organ each day than all the other lymphoid tissues combined” (1). In LNs, blood-borne lymphocytes enter the paracortex via high endothelial venules (HEVs), specialized blood vessels that support the rolling, arrest, and diapedesis of T and B lymphocytes across the endothelium into the surrounding parenchyma (for reviews, see (2, 3)). The molecular events involved in this migration from blood to LN are well characterized and sequentially involve selectins, chemokines, and integrins. In the spleen, HEVs are absent (4) and although a key role for chemokines such as CCL21 and CXCL13 are appreciated in the intrasplenic localization of T (5, 6) and B cells (7), respectively, there is scant evidence for any special role of non-hematopoietic structural elements of this organ in guiding lymphocytes to their sites of accumulation once they have entered from the vasculature.
The spleen has a complex and well-described microanatomy (Fig. 1A). The WP, where T and B cell populations segregate, is surrounded by the red pulp (RP), a loose meshwork of reticular fibers and fibroblasts where blood is filtered and old erythrocytes removed (4). Localized between the WP and the RP, the MZ creates a transit area for recently immigrating blood lymphocytes as well as a filtering zone for blood content (8). This critical function is ensured by specialized populations of macrophages termed marginal zone macrophages (MZMs) and marginal zone metallophilic macrophages (MMMs), as well as by dendritic cells designated marginal zone dendritic cells (MZDCs) (9–11). Located between the MZ and the WP, the MZ sinus and its sinus-lining cells are believed to be the place where recently incoming lymphocytes can access the neighboring WP (4, 8, 12, 13), although there is little direct experimental support for this model. Based on histological observation of human spleen sections, an alternative scheme has been proposed in which specialized fibroblasts guide CD4+ T cell entry into the PALS (14).
Figure 1. MZBCs directly connect the MZ to the PALS.
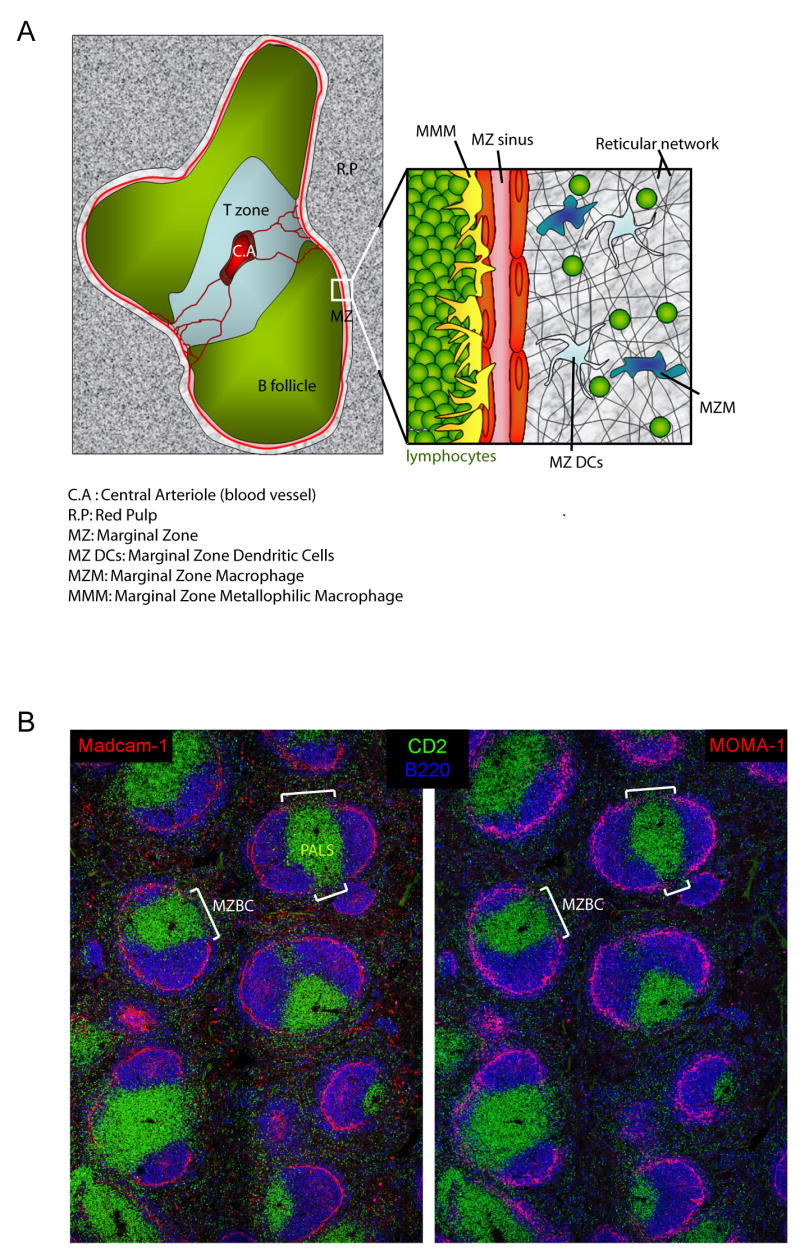
(A) Schematic representation of the cellular elements of a WP unit and its surrounding MZ and RP. (B) Two adjacent spleen cryostat sections from HuCD2 GFP (green = PALS) mice were stained for B220 (blue = B cell follicles), Madcam-1 (left panel; red = MZ sinus), MOMA-1 (right panel; red = MMM) and imaged using confocal microscopy. This picture is representative of 2 different experiments.
Recently, we demonstrated that an FRC network supports and guides T and B cell motility in the T cell area of LNs (15), dictating the apparent random migratory behavior of these cells. Lymphocytes adapt their shape to the cell bodies and processes of these large stellate fibroblastic cells and follow the supporting fibers of the FRCs during migration within the paracortical region (T cell zone) that is itself defined by the extent of this FRC network (15). In the spleen, the only known function of the FRCs is their ability to create a conduit system that transports blood-derived material inside the PALS in the same way that the comparable FRC-based conduit system can transport lymph content in the paracortex of the LN (16, 17).
Here, we characterize the exact location and describe additional functions of the FRC network in the spleen. As anticipated from our previous work, we show that these stromal cells are located in the splenic PALS and support T cell motility in this region. Surprisingly, we also found that FRCs connect the PALS to the MZ only where the MZ sinus and MZ macrophages rims are interrupted (i.e., the so called MZBCs) (18). Using T cell homing experiments, we show that T cells entering the PALS do not cross the MZ randomly but only use these FRC-rich bridging channels. Thus, by their unique location, FRCs not only support T cell motility in the PALS but also provide access roads to this area for T cells that have recently immigrated into the spleen.
Materials and Methods
Mice
C57BL/6 and C57BL/6 ubiquitin-GFP mice (UBI-GFP/BL6, strain 4353) were purchased from the Jackson Laboratory (Bar Harbor, ME) and maintained in the National Institutes of Health animal facilities. Hu-CD2 GFP mice were originally a gift from D. Kioussis (Mill Hill, London, U.K.). For the generation of chimeras, C57BL/6 ubiquitin-GFP mice were μ-irradiated with a single dose of 950 rads (or twice with 500 rads) from a cesium source and were reconstituted with 2 μ 106 C57BL/6 bone marrow cells. At 8 weeks after reconstitution, mice were tested for chimerism. Chimeras were used for subsequent experiments only if analysis of blood leukocytes showed the presence of less than 2% of CD3+ T cells of host origin. All procedures performed on animals in this study have been approved by the Animal Care and Use Committee, NIAID, NIH.
Adoptive Transfers
T cells were purified from the LNs of wild-type mice with a pan T cell isolation kit (Miltenyi Biotec, Auburn, CA) and stained with either CMFDA (5- Chloromethyl fluorescein diacetate-2 μM), CFDA-SE (carboxy-fluorescein diacetate, succinimidyl ester- 2 μM ) or SNARF-1 (2.5 μM) (Invitrogen, Carlsbad, CA) at 37°C for 15 min. The indicated numbers of cells were transferred into host mice by intravenous injection.
Antibodies
ERTR-7 antibody specific for an unknown FRC-secreted molecule and anti-desmin serum were purchased from Acris Antibodies (Hiddenhausen, Germany). RA3-6B2 antibody specific for B220, 17A2 specific for the CD3 complex, and MECA-89 specific for MadCAM-1were from BD Biosciences Pharmingen (San Diego, CA). MOMA-1 antibody specific for MMM was purchased from Cedarlane (Burlington, NC). A goat polyclonal anti-murine CCL21/6cKine was purchased from R&D (Minneapolis, MN). These antibodies were visualized by direct coupling to biotin, allophycocyanin, Alexa Fluor 488, 568, 647, or through the use of Alexa Fluor 488, 568, or 647 coupled secondary antibodies or streptavidin.
Immunostaining
Spleens were harvested and fixed in a 0.05 M phosphate buffer containing 0.1 M L-lysine (pH 7.4), 2 mg/ml NaIO4, and 10 mg/ml paraformaldehyde (PLP) for 12hrs, then washed in phosphate buffer and dehydrated in 30% sucrose in phosphate buffer. Spleens were snap frozen in Tissue-Tek (Sakura Finetek). 10–30 μm frozen sections were cut and then stained with the indicated antibodies as previously described (19). Immunofluorescence confocal microscopy was performed with a Leica SP5 confocal microscope. Separate images were collected for each fluorochrome and overlaid to obtain a multicolor image. Final image processing was performed with ImageJ software (National Institutes of Health) and Adobe Photoshop.
Two Photon (2P) Microscopy
Freshly isolated, fluorescent dye-labeled T cells were injected i.v. into chimeric recipient mice. 24hr later (unless otherwise specified), the spleen was removed, fixed on a tissue holder and sliced into two non-symmetric pieces using a vibratome (Leica, VT 1000 S) in a bath of ice-cold PBS. The holder containing the thickest piece of spleen was then incubated in a tissue chamber (Bioptechs, Butler, PA). Splenic tissue was perfused with a 37° C RPMI-1640 medium bubbled with a gas mixture containing 95% O2 and 5% CO2 while being imaged with a Bio-Rad Radiance 2100 MP system attached to a Nikon 600 FN upright microscope fitted with a 20μ water immersion lens (NA = 0.95, Olympus). The 2P laser was a Chameleon XR femtosecond pulsed laser (Coherent) tuned to 880 nm. Images were collected in PALS, a region characterized by the accumulation of dye labeled T cells, the presence of a central arteriole, and surrounding FRC fibers. This volume collection was repeated every 20–30 s to create 4D data sets that were then processed with Imaris software (Bitplane) and Adobe AfterEffects (Adobe). Supplemental movies created from these image stacks are maximum intensity projections and play at 100x or 300μ real time.
Results
FRCs connect the MZ and PALS via the bridging channels
In the spleen, the MZ and WP are separated by a rim of MOMA-1+ MZ macrophages underlying the MadCAM-1+ MZ sinus (10). However, this rim is incomplete and interrupted in regions known as MZBCs. Interestingly, these MZBCs are only present where PALS, but not B cell follicles, abut the MZ (Fig 1B), suggesting that the PALS may be directly connected to the MZ at the site of these special bridging corridors.
As a first approach to understanding how lymphocytes enter into and move within the PALS and the possible relationship of such movement to this organization of the splenic microanatomy, we characterized the exact location of FRCs in the WP. This approach was taken because of our previous demonstration that FRCs are the substrate for migration of T cells in the paracortical region (T zone) of LNs (15). Immunostaining of spleen sections revealed that the conduit system and its associated FRCs, whose outlines can be respectively delineated by their reactivity with ERTR-7 and anti-desmin Abs, were present in the PALS and also in the MZBC (Fig 2A and 2B). A closer analysis indicated that these reticular fibers span across from the MZ to the PALS exactly where the rim of MMMs and the MZ sinus are interrupted, that is, the MZBCs (Fig 2C, movie S1).
Figure 2. FRCs connect the MZ to the PALS at the MZBC.

Spleen cryostat sections from HuCD2 GFP (blue) mice were stained for ERTR-7 (green = FRC-derived matrix protein), MOMA-1 (red, panels A and C) or Desmin (panel B) and imaged using confocal microscopy. In panel C, the insert shows a higher magnification of 2 MZBCs. Arrowheads point to the location of MZBCs while “B” indicates the presence of B cell follicles. This picture is representative of 3 different experiments. See also Movie S1.
FRCs support T cell motility in the PALS
The location of FRCs in the PALS suggested the possibility that the FRC network might be the substratum for lymphocyte migration in this region. To determine if naïve T cells migrate along FRC fibers in the PALS, these lymphocytes were visualized in the spleens of mice using two-photon (2P) laser scanning microscopy. To permit simultaneous imaging of the non-hematopoietic stromal cell populations within the spleen, we generated chimeric mice by using wild-type bone marrow cells to reconstitute irradiated ubiquitin promoter-GFP transgenic animals, as previously reported (15). To confirm that GFP-expressing cells within the PALS of chimeric animals represented the FRC population, splenic sections from such animals were stained for desmin and ERTR-7 expression and analyzed using confocal microscopy (Figure 3A). In the PALS, GFP+ cells form a three dimensional network that surrounds the ERTR-7+ conduit system and overlaps with desmin staining, indicating that this network is indeed formed by FRCs.
Figure 3. T cells crawl on the splenic FRC network.

(A) 20 μm thick spleen cryostat sections from GFP (green) chimeric mice were examined using confocal microscopy after staining for desmin (red) and ERTR-7 (blue). C.A: central arteriole. M.Z: marginal zone. (B) 5 × 10⁶ SNARF-1 labeled T cells were injected i.v into chimeric mice. One day later, spleens were sectioned using a vibratome, perfused with warm, oxygenated medium, and imaged using 2P microscopy. Data show intravital snapshots of a single T cell (red) moving over time on FRC fibers (green) in a 12 μm thick volume. (C) Quantification of T cells showing turns in 4D datasets with respect to their location on or off GFP-marked stromal fibers in chimeric animals. Data are representative of at least 3 experiments.
Confocal microscopy has been successfully employed for intravital imaging of the spleen (20, 21), but useful data can only be obtained in the most superficial region of the organ with this technology. Furthermore, because the WP is usually located deep in the mouse spleen where thin GFP+ FRC fibers are difficult to image effectively even by 2P microscopy (>200–300μm under the thick capsule and surrounded by RP full of red blood cells that absorb the 2P laser signal), direct intravital or whole spleen explant imaging was not adequate for our purpose. Therefore, to analyze the dynamic behavior of T cells in relation to the green fluorescent FRC network, we developed a different approach. Wild type naïve T cells were labeled with the red fluorescent dye SNARF-1 and injected i.v. into chimeric animals. One day later, each recipient spleen was sliced into two non-symmetric pieces using a vibratome to allow direct imaging access to the deep WPs of the thickest piece. Bisected spleens were then perfused with warm and oxygenated medium while being imaged by 2P microscopy as previously reported for LN vibratome sections (15). Using this technique, we found that T cells maintain their characteristic migratory behaviour, moving in the PALS at 8.95 ± 0.9 μm.min−1, a speed comparable to that observed in intact LNs (Sup Fig 2, Movie S2) (22–24). Analysis of 4D (x, y, z and time) datasets suggested that migrating SNARF-1 labeled T cells actively crawled on GFP+ FRC, following and morphologically adapting to the paths established by the cell bodies and extended processes of these non-hematopoietic cells (Fig 3B, Movie S3 and S4).
To assess quantitatively whether T cells actively followed the paths laid out by the FRC network, we utilized the same approach that was applied in our prior study of migration of T cells in LNs (15). We assumed that if the fibers provided guidance for cell movement, then any directional turns made by a T cell should always be associated with a corresponding turn or branch of a supporting FRC fiber. Conversely, a lack of correspondence between T cell directionality and fiber pathways would indicate that spontaneous turns or physical impediments posed by the many other cells in the densely packed PALS environment accounted for T cell directional changes. Analysis of T cell turns using this previously described method (Sup Fig 3 and (15)) revealed a 89% correlation (155 out of 174 cells) between changes in T cell direction and the presence of T cell-associated GFP+ FRC fibers running at the corresponding angle (Fig 3C). Given that this is likely an underestimate of the correspondence between T cell movement and FRC organization due to the inability to image the thinnest or dimmest FRC fibers, we conclude that as observed in LNs, T cells migrate along FRCs in the splenic WP.
FRCs support T cell entry in the PALS
Blood circulating lymphocytes enter the spleen in the MZ (8, 20, 21). It is thought that lymphocytes and DCs can enter the white pulp from the MZ sinus by passing through a layer of sinus-lining cells that form a barrier between the MZ and the WP (4) (Fig 1A). A role for MZ macrophages in this process has been proposed because of their unique location in the MZ as well as their ability to bind to lymphocytes deposited on spleen cryostat sections in a sialoadhesin-dependent manner (25). However, this hypothesized function is unlikely in light of data showing that lymphocyte homing to the PALS is unaltered in mice in which MZ macrophages have been depleted using chlodronate liposomes (26). Because T cells migrate on FRCs in the PALS and because FRCs connect the MZ to the PALS via the MZBCs, we considered the possibility that FRCs also support T cell migration from MZs to the PALS, as previously suggested based on static imaging analyses using human material (14).
We first attempted to use our vibratome cut method to address this issue but found that using this procedure, the structure of the MZ loosely attached to the WP becomes compromised, inducing lymphocytes to leak out of the MZ over time, a phenomenon we never observed in the more rigid and compact WP (data not shown). As a consequence, we used an alternative approach. Naïve polyclonal T cells were labeled with CMFDA or CFSE and injected i.v. into recipients that were euthanized 10, 20, 30, and 180 min later. Spleens were harvested and used to prepare fixed sections that were stained with B220 to locate B cell follicles, as well as with ERTR-7 to highlight the PALS and the MZBC that connect the MZ to the PALS (Fig 4A). We reasoned that if T cells are not constrained to enter the WP via FRCs, we should observe T cells initially accessing the PALS not only adjacent to the MZBCs but everywhere through the WP. At later times, T cells would eventually gather in the PALS. Alternatively, if T cells enter the WP using the FRCs located in the MZBCs, they should be observed entering the WP only where these structures connect to the PALS.
Figure 4. T cells access the PALS using MZBCs.

(A) 10 × 106 CFSE labeled polyclonal T cells (green) were transferred in recipient mice. 10, 20, 30, and 180 min later, spleen cryostat sections were stained for B220 (blue), ERTR-7 (red) and imaged using confocal microscopy in order to identify where T cells enter the WP. Arrowheads point to the location where MZBC connect the MZ. (B) Quantification of T cells entering the WP in ERTR-7− and ERTR-7+ areas of the WP over time. Data are representative of 3 different experiments.
Using this sequential static imaging approach, T cells were found throughout the MZ surrounding the WP 10 min after the transfer. Starting 20–30 min after the transfer, T cells started to enter the WP. Strikingly, T cells only entered the WP at the MZBCs (Fig 4A). Three hours after the transfer, T cells were localized in the PALS. In order to quantify this phenomenon, we counted the numbers of T cells present at 10, 20 and 30 min in the WP (i.e., when they were in the process of entering) in both ERTR-7− and ERTR-7+ regions of the WP and normalized these numbers to the surface areas of the respective regions. The analysis revealed that T cell entry into the WP almost exclusively occurred in MZBC regions where FRCs connect the PALS to the MZ (Fig 4B). B cells reside in WP follicles that lack an FRC network, leaving open the question of how this lymphocyte subset accesses this region. Forster et al. observed that before accessing the adjacent follicles, B cells are transiently retained in the PALS in a CCR7-dependent manner, indicating that B cells do not directly cross the MZ/WP border to access the follicles but rather follow a path similar to T cells (5). In accord with this idea, we observed that B cells also used the MZBCs to access the PALS (though preferentially using the external part of the corridor), indicating that both T and B cells use this pathway to enter the splenic WP (Fig 5). Altogether, our observations suggest that T and B cells enter the PALS at the MZBCs where they are able to locate and move on an FRCs pathway connecting the PALS to the MZ.
Figure 5. B cells access the PALS using MZBCs.

10 × 106 CFSE labeled polyclonal T cells (green) and 10 × 106 CMTPX labeled B cells (red) were transferred i.v. into recipient mice. 3 and 8 hours later, spleens were harvested and sectioned using a cryostat. Sections were stained for ERTR-7 (white) and imaged using confocal microscopy in order to identify the MZBCs and the PALS. At t = 3 hrs, arrows indicate the B cells that are entering the WP using the MZBCs. Only T and B cells present in the WP are shown. At 8 hrs after transfer, most B cells are localized to the follicles. Data are representative of 2 different experiments.
Discussion
Here we present evidence that FRCs support T cell access to the splenic WP by creating physical roads for T cell migration. These FRC pathways connect the MZ to the PALS via breaks in the shell of MZ macrophages and the MZ sinus, regions called MZBCs. After accessing the PALS along these guides, the T cells migrate on the FRC fibers within the T zone of the spleen, as previously observed in the paracortical region of LNs (15). Interestingly, like their LN counterparts, splenic FRCs secrete and are tightly associated with CCL21 ((27) and Sup Fig 4A), a chemokine that is an important regulator of T cell motility and positioning in the PALS and that has been shown to provide an important chemokinetic stimulus to T cells in the LN paracortex (28, 29). In Plt/Plt mice that lack expression of CCL19/CCL21 (ELC/SLC), naïve T cells do not enter the PALS efficiently ((6) and Sup Fig 4B). Similarly, in mice deficient for CCR7, the cognate receptor for these chemokines, naïve T cells cannot enter the PALS, indicating the crucial role of this molecular interaction in regulating naïve T cell access to this region (5). Interestingly, in the MZ, a subset of DCs called MZ DCs is localized at the border of MZBC (11). Upon LPS activation, these DCs migrate to the PALS and this migration is correlated with increased expression of CCR7 by the DCs (30, 31). It is therefore likely that both MZ DCs and naïve T cells access the PALS by using CCL19/CCL21 present on FRCs to guide their migration. In addition, large heavily carbon-laden (LHC) macrophages located only in the red pulp at 30 min after carbon injection start to appear along MZBCs 1–6 hrs later (32). Taken together, these observations suggest that FRC-rich MZBCs are the entry door to the PALS for several different cell types. MZBCs have previously been suggested to be the place where lymphocytes exit (but do not enter) the WP (18, 33). Therefore, it is possible that these corridors govern cell exchanges between the RP/MZ and the WP in both directions.
Although our present data together with past results point to a clear role for CCL21 and FRC fibers in guiding T cell migration into and within the PALS, the mechanisms underlying T cell migration in the MZ itself remain unclear. In the MZ, MMM location is regulated by CCL19/CCL21 because Plt/Plt mice show a reduction in MMMs colonizing the MZ (34). Because, as this result indicates, these chemokines are present and functional in the MZ, T cell migration in this region of the spleen might also be regulated by CCL19/CCL21 until the presence of FRCs at the MZBCs provides a presumably more attractive path for the T cells to follow. Alternatively, because the capillary meshwork discharges blood in the MZ, this specific area is continuously perfused (20, 21). In the MZ, a dense network of reticular fibers creates a maze that may slow down lymphocytes (Fig 2). As a consequence, it is possible that, while flowing in the MZ, lymphocytes that can “catch” an FRC present at the MZ/PALS border in the MZBC will begin their journey to the underlying PALS, while those that do not successfully interact with these FRCs will continue their movement and either enter a downstream PALS or remain in the RP.
Overall, the data we present here reinforce the conclusion we reached from our prior study of lymphocyte migration in the LN (15). Although at the gross level in the absence of inflammation, T cell migration appears random in secondary lymphoid tissues (35, 36), when examined closely, it is clear that the movement of these lymphocytes occurs along pre-formed paths. In the LN, these paths are studded with dendritic cells, thus facilitating the interaction of these two key cell types. As noted here, activated DCs traffic use similar chemokine signals as the T cells to move into the PALS and it is likely they occupy places on the same FRC network trafficked by these lymphocytes. Thus, it seems that throughout lymphoid tissues, initiation of adaptive immune responses is left less to chance than might be imagined.
Supplementary Material
Confocal image of a cryostat section from a HuCD2 GFP (green) spleen stained for desmin (red) and ERTR-7 (blue), demonstrating the overlap in location of the ERTR-7+ FRC-derived matrix and the network formed by the desmin+ FRC fibers. C.A: central arteriole. PALS: periarteriolar lymphocyte sheath.
Sup Figure 2: T cell motility in vibratome-sliced spleens
B6 mice were injected with 3 × 10⁶ CMFDA-labeled T cells (green). 24 h later, spleens were sliced using a vibratome, perfused with warm, oxygenated medium, and imaged by 2P microscopy. The graph represents the velocity distribution of T cells migrating in sliced spleens. Velocities were measured in three-dimensional space from point-to-point tracks at 30 s intervals. Three mice were analyzed. Error bars represent SD and the median velocity is indicated by a vertical double arrow. See also Movie S2.
Sup Figure 3: Turning angle analysis
Experimental protocol used to quantify, from 4D datasets, the correspondence between the turning angle of a migrating lymphocyte and that of the underlying GFP+ fibers.
Sup Figure 4: Splenic FRCs secrete and are covered with CCL21
(A) 20 μm thick splenic cryostat sections from chimeric (green) mice were examined using confocal microscopy after staining for CD3 (blue) and CCL21 (red). C.A: central arteriole. (B) 10 × 106 CFSE labeled T cells were injected i.v into wild type and plt/plt mice. Three hours later, splenic cryostat sections were examined using confocal microscopy after staining with ERTR-7 (red) and B220 (blue). T cells enter the PALS in wild type but not plt/plt mice, as previously described (6).
Movie S1: A thick section (30 μm) from a wild-type spleen stained for B220 (light blue), CD3 (deep blue), ERTR-7 (green), and MOMA-1 (red) expression is presented in 3D. The FRC network penetrates into the PALS exactly where the MMM rim is interrupted (MZBCs).
Movie S2: 3 × 10⁶ CMFDA-labeled T cells (green) were transferred i.v into a wild-type mouse and their dynamic migratory behavior in a vibratome-sliced spleen was captured using intravital 2P imaging. Playback speed 300x.
Movie S3: Dynamic image of T cells (red) migration along the FRC network (green). (z stack = 12 μM). The playback speed is 100x.
Movie S4: Another example of dynamic T cell (red) migration along the FRC fiber network (green). In this movie, arrowheads indicate the location of the motile follicular dendritic cell (FDC) network. T cells that roam at the border of the 2 networks don’t trespass into the FDC network, instead turning back on the FRC network. z stack = 12 μM, playback speed is 300x.
Acknowledgments
The authors wish to thank Hai Qi and Jackson G. Egen, for their suggestions on the manuscript. The authors declare that they have no competing financial interests. This research was supported [in part] by the Intramural Research Program of the NIH, NIAID.
Footnotes
This research was supported in part by the Intramural Research Program of NIAID, NIH, DHHS, by the Institut de la Santé et de la Recherche Médicale (INSERM) and by the Centre National de la Recherche Scientifique (CNRS).
Abbreviations used in this paper: LN: lymph node; HEV: high endothelial venule; WP: white pulp; FRC: fibroblastic reticular cell; PALS: periarteriolar lymphoid sheath; MZ: marginal zone; MZBC: marginal zone bridging channel; MZM: marginal zone macrophage, MMM: marginal metallophillic macrophage; FDC: follicular dendritic cell.
References
- 1.Pabst R, Binns RM. Heterogeneity of lymphocyte homing physiology: several mechanisms operate in the control of migration to lymphoid and non-lymphoid organs in vivo. Immunol Rev. 1989;108:83–109. doi: 10.1111/j.1600-065x.1989.tb00014.x. [DOI] [PubMed] [Google Scholar]
- 2.Miyasaka M, Tanaka T. Lymphocyte trafficking across high endothelial venules: dogmas and enigmas. Nat Rev Immunol. 2004;4:360–370. doi: 10.1038/nri1354. [DOI] [PubMed] [Google Scholar]
- 3.Warnock RA, Askari S, Butcher EC, von Andrian UH. Molecular mechanisms of lymphocyte homing to peripheral lymph nodes. J Exp Med. 1998;187:205–216. doi: 10.1084/jem.187.2.205. [DOI] [PMC free article] [PubMed] [Google Scholar]
- 4.Mebius RE, Kraal G. Structure and function of the spleen. Nat Rev Immunol. 2005;5:606–616. doi: 10.1038/nri1669. [DOI] [PubMed] [Google Scholar]
- 5.Forster R, Schubel A, Breitfeld D, Kremmer E, Renner-Muller I, Wolf E, Lipp M. CCR7 coordinates the primary immune response by establishing functional microenvironments in secondary lymphoid organs. Cell. 1999;99:23–33. doi: 10.1016/s0092-8674(00)80059-8. [DOI] [PubMed] [Google Scholar]
- 6.Nakano H, Mori S, Yonekawa H, Nariuchi H, Matsuzawa A, Kakiuchi T. A novel mutant gene involved in T-lymphocyte-specific homing into peripheral lymphoid organs on mouse chromosome 4. Blood. 1998;91:2886–2895. [PubMed] [Google Scholar]
- 7.Ansel KM, Ngo VN, Hyman PL, Luther SA, Forster R, Sedgwick JD, Browning JL, Lipp M, Cyster JG. A chemokine-driven positive feedback loop organizes lymphoid follicles. Nature. 2000;406:309–314. doi: 10.1038/35018581. [DOI] [PubMed] [Google Scholar]
- 8.Lyons AB, Parish CR. Are murine marginal-zone macrophages the splenic white pulp analog of high endothelial venules? Eur J Immunol. 1995;25:3165–3172. doi: 10.1002/eji.1830251127. [DOI] [PubMed] [Google Scholar]
- 9.Dijkstra CD, Van Vliet E, Dopp EA, van der Lelij AA, Kraal G. Marginal zone macrophages identified by a monoclonal antibody: characterization of immuno- and enzyme-histochemical properties and functional capacities. Immunology. 1985;55:23–30. [PMC free article] [PubMed] [Google Scholar]
- 10.Kraal G, Janse M. Marginal metallophilic cells of the mouse spleen identified by a monoclonal antibody. Immunology. 1986;58:665–669. [PMC free article] [PubMed] [Google Scholar]
- 11.Leenen PJ, Radosevic K, Voerman JS, Salomon B, van Rooijen N, Klatzmann D, van Ewijk W. Heterogeneity of mouse spleen dendritic cells: in vivo phagocytic activity, expression of macrophage markers, and subpopulation turnover. J Immunol. 1998;160:2166–2173. [PubMed] [Google Scholar]
- 12.Weiss L. The Structure of the Normal Spleen. Semin Hematol. 1965;39:205–228. [PubMed] [Google Scholar]
- 13.Goldschneider I, McGregor DD. Migration of lymphocytes and thymocytes in the rat. I. The route of migration from blood to spleen and lymph nodes. J Exp Med. 1968;127:155–168. doi: 10.1084/jem.127.1.155. [DOI] [PMC free article] [PubMed] [Google Scholar]
- 14.Steiniger B, Barth P, Hellinger A. The perifollicular and marginal zones of the human splenic white pulp : do fibroblasts guide lymphocyte immigration? Am J Pathol. 2001;159:501–512. doi: 10.1016/S0002-9440(10)61722-1. [DOI] [PMC free article] [PubMed] [Google Scholar]
- 15.Bajenoff M, Egen JG, Koo LY, Laugier JP, Brau F, Glaichenhaus N, Germain RN. Stromal cell networks regulate lymphocyte entry, migration, and territoriality in lymph nodes. Immunity. 2006;25:989–1001. doi: 10.1016/j.immuni.2006.10.011. [DOI] [PMC free article] [PubMed] [Google Scholar]
- 16.Nolte MA, Belien JA, Schadee-Eestermans I, Jansen W, Unger WW, van Rooijen N, Kraal G, Mebius RE. A conduit system distributes chemokines and small blood-borne molecules through the splenic white pulp. J Exp Med. 2003;198:505–512. doi: 10.1084/jem.20021801. [DOI] [PMC free article] [PubMed] [Google Scholar]
- 17.Sixt M, Kanazawa N, Selg M, Samson T, Roos G, Reinhardt DP, Pabst R, Lutz MB, Sorokin L. The conduit system transports soluble antigens from the afferent lymph to resident dendritic cells in the T cell area of the lymph node. Immunity. 2005;22:19–29. doi: 10.1016/j.immuni.2004.11.013. [DOI] [PubMed] [Google Scholar]
- 18.Mitchell J. Lymphocyte circulation in the spleen. Marginal zone bridging channels and their possible role in cell traffic. Immunology. 1973;24:93–107. [PMC free article] [PubMed] [Google Scholar]
- 19.Bajenoff M, Granjeaud S, Guerder S. The strategy of T cell antigen-presenting cell encounter in antigen-draining lymph nodes revealed by imaging of initial T cell activation. J Exp Med. 2003;198:715–724. doi: 10.1084/jem.20030167. [DOI] [PMC free article] [PubMed] [Google Scholar]
- 20.Grayson MH, Chaplin DD, Karl IE, Hotchkiss RS. Confocal fluorescent intravital microscopy of the murine spleen. J Immunol Methods. 2001;256:55–63. doi: 10.1016/s0022-1759(01)00437-9. [DOI] [PubMed] [Google Scholar]
- 21.Grayson MH, Hotchkiss RS, Karl IE, Holtzman MJ, Chaplin DD. Intravital microscopy comparing T lymphocyte trafficking to the spleen and the mesenteric lymph node. Am J Physiol Heart Circ Physiol. 2003;284:H2213–2226. doi: 10.1152/ajpheart.00999.2002. [DOI] [PubMed] [Google Scholar]
- 22.Bousso P, Robey E. Dynamics of CD8+ T cell priming by dendritic cells in intact lymph nodes. Nat Immunol. 2003;4:579–585. doi: 10.1038/ni928. [DOI] [PubMed] [Google Scholar]
- 23.Mempel TR, Henrickson SE, Von Andrian UH. T-cell priming by dendritic cells in lymph nodes occurs in three distinct phases. Nature. 2004;427:154–159. doi: 10.1038/nature02238. [DOI] [PubMed] [Google Scholar]
- 24.Miller MJ, Wei SH, Parker I, Cahalan MD. Two-photon imaging of lymphocyte motility and antigen response in intact lymph node. Science. 2002;296:1869–1873. doi: 10.1126/science.1070051. [DOI] [PubMed] [Google Scholar]
- 25.van den Berg TK, Breve JJ, Damoiseaux JG, Dopp EA, Kelm S, Crocker PR, Dijkstra CD, Kraal G. Sialoadhesin on macrophages: its identification as a lymphocyte adhesion molecule. J Exp Med. 1992;176:647–655. doi: 10.1084/jem.176.3.647. [DOI] [PMC free article] [PubMed] [Google Scholar]
- 26.Claassen E, van Rooijen N. Evidence that macrophages in the marginal zone have no role in the migration of lymphocytes into the periarteriolar lymphocyte sheaths (PALS) Immunology. 1985;56:689–694. [PMC free article] [PubMed] [Google Scholar]
- 27.Luther SA, Tang HL, Hyman PL, Farr AG, Cyster JG. Coexpression of the chemokines ELC and SLC by T zone stromal cells and deletion of the ELC gene in the plt/plt mouse. Proc Natl Acad Sci U S A. 2000;97:12694–12699. doi: 10.1073/pnas.97.23.12694. [DOI] [PMC free article] [PubMed] [Google Scholar]
- 28.Okada T, Cyster JG. CC chemokine receptor 7 contributes to Gi-dependent T cell motility in the lymph node. J Immunol. 2007;178:2973–2978. doi: 10.4049/jimmunol.178.5.2973. [DOI] [PubMed] [Google Scholar]
- 29.Worbs T, Mempel TR, Bolter J, von Andrian UH, Forster R. CCR7 ligands stimulate the intranodal motility of T lymphocytes in vivo. J Exp Med. 2007;204:489–495. doi: 10.1084/jem.20061706. [DOI] [PMC free article] [PubMed] [Google Scholar]
- 30.De Smedt T, Pajak B, Muraille E, Lespagnard L, Heinen E, De Baetselier P, Urbain J, Leo O, Moser M. Regulation of dendritic cell numbers and maturation by lipopolysaccharide in vivo. J Exp Med. 1996;184:1413–1424. doi: 10.1084/jem.184.4.1413. [DOI] [PMC free article] [PubMed] [Google Scholar]
- 31.Sallusto F, Schaerli P, Loetscher P, Schaniel C, Lenig D, Mackay CR, Qin S, Lanzavecchia A. Rapid and coordinated switch in chemokine receptor expression during dendritic cell maturation. Eur J Immunol. 1998;28:2760–2769. doi: 10.1002/(SICI)1521-4141(199809)28:09<2760::AID-IMMU2760>3.0.CO;2-N. [DOI] [PubMed] [Google Scholar]
- 32.Kotani M, Matsuno K, Ezaki T. Marginal zone bridging channels as a pathway for migrating macrophages from the red towards the white pulp in the rat spleen. Acta Anat (Basel) 1986;126:193–198. doi: 10.1159/000146214. [DOI] [PubMed] [Google Scholar]
- 33.Khanna KM, McNamara JT, Lefrancois L. In situ imaging of the endogenous CD8 T cell response to infection. Science. 2007;318:116–120. doi: 10.1126/science.1146291. [DOI] [PMC free article] [PubMed] [Google Scholar]
- 34.Ato M, Nakano H, Kakiuchi T, Kaye PM. Localization of marginal zone macrophages is regulated by C-C chemokine ligands 21/19. J Immunol. 2004;173:4815–4820. doi: 10.4049/jimmunol.173.8.4815. [DOI] [PubMed] [Google Scholar]
- 35.Miller MJ, Hejazi AS, Wei SH, Cahalan MD, Parker I. T cell repertoire scanning is promoted by dynamic dendritic cell behavior and random T cell motility in the lymph node. Proc Natl Acad Sci U S A. 2004;101:998–1003. doi: 10.1073/pnas.0306407101. [DOI] [PMC free article] [PubMed] [Google Scholar]
- 36.Wei SH, Parker I, Miller MJ, Cahalan MD. A stochastic view of lymphocyte motility and trafficking within the lymph node. Immunol Rev. 2003;195:136–159. doi: 10.1034/j.1600-065x.2003.00076.x. [DOI] [PubMed] [Google Scholar]
Associated Data
This section collects any data citations, data availability statements, or supplementary materials included in this article.
Supplementary Materials
Confocal image of a cryostat section from a HuCD2 GFP (green) spleen stained for desmin (red) and ERTR-7 (blue), demonstrating the overlap in location of the ERTR-7+ FRC-derived matrix and the network formed by the desmin+ FRC fibers. C.A: central arteriole. PALS: periarteriolar lymphocyte sheath.
Sup Figure 2: T cell motility in vibratome-sliced spleens
B6 mice were injected with 3 × 10⁶ CMFDA-labeled T cells (green). 24 h later, spleens were sliced using a vibratome, perfused with warm, oxygenated medium, and imaged by 2P microscopy. The graph represents the velocity distribution of T cells migrating in sliced spleens. Velocities were measured in three-dimensional space from point-to-point tracks at 30 s intervals. Three mice were analyzed. Error bars represent SD and the median velocity is indicated by a vertical double arrow. See also Movie S2.
Sup Figure 3: Turning angle analysis
Experimental protocol used to quantify, from 4D datasets, the correspondence between the turning angle of a migrating lymphocyte and that of the underlying GFP+ fibers.
Sup Figure 4: Splenic FRCs secrete and are covered with CCL21
(A) 20 μm thick splenic cryostat sections from chimeric (green) mice were examined using confocal microscopy after staining for CD3 (blue) and CCL21 (red). C.A: central arteriole. (B) 10 × 106 CFSE labeled T cells were injected i.v into wild type and plt/plt mice. Three hours later, splenic cryostat sections were examined using confocal microscopy after staining with ERTR-7 (red) and B220 (blue). T cells enter the PALS in wild type but not plt/plt mice, as previously described (6).
Movie S1: A thick section (30 μm) from a wild-type spleen stained for B220 (light blue), CD3 (deep blue), ERTR-7 (green), and MOMA-1 (red) expression is presented in 3D. The FRC network penetrates into the PALS exactly where the MMM rim is interrupted (MZBCs).
Movie S2: 3 × 10⁶ CMFDA-labeled T cells (green) were transferred i.v into a wild-type mouse and their dynamic migratory behavior in a vibratome-sliced spleen was captured using intravital 2P imaging. Playback speed 300x.
Movie S3: Dynamic image of T cells (red) migration along the FRC network (green). (z stack = 12 μM). The playback speed is 100x.
Movie S4: Another example of dynamic T cell (red) migration along the FRC fiber network (green). In this movie, arrowheads indicate the location of the motile follicular dendritic cell (FDC) network. T cells that roam at the border of the 2 networks don’t trespass into the FDC network, instead turning back on the FRC network. z stack = 12 μM, playback speed is 300x.