Abstract
The lack of efficient detection techniques has so far prevented ultrasound-modulated optical tomography from achieving maturity. By applying a quantum spectral filter based on spectral-hole burning, one modulation sideband of the ultrasound-modulated diffuse photons can be efficiently selected while the DC and the other sidebands are blocked. This technique features a large etendue as well as the capability of processing numerous speckles in parallel. It is also immune to speckle decorrelation, potentially allowing real-time in vivo imaging. Both theory and experiments are presented.
1. Introduction
In biological tissues, noninvasive imaging using non-ionizing optical radiation [1] is highly desirable because optical contrast provides sensitive tissue discriminations. However, high-resolution optical imaging at an imaging depth greater than one transport mean free path (∼1 mm) is challenging since biological tissues are optically turbid. Consequently, pure optical biomedical imaging techniques, such as diffuse optical tomography (DOT) [2], suffer from poor spatial resolution. Ultrasound-modulated optical tomography (UOT) [3], also called acousto-optical tomography [4], was designed to overcome the strong optical scattering challenge. UOT fuses ultrasonic and optical imaging by employing acousto-optic interactions, and has the advantages of optical contrast, as in DOT, and ultrasonic resolution, as in sonography.
In UOT, a coherent laser source illuminates a thick tissue sample while a focused ultrasound wave is launched into the sample through water or ultrasound coupling gel. The ultrasound field induces local modulations to two tissue properties: scattering particle displacement and refractive index. The multiply scattered photons propagating through the ultrasound field are consequently tagged by the ultrasound field [5, 6]. These ultrasound-tagged diffuse photons carry spatial information furnished by the ultrasound field. By using the ultrasound-tagged diffuse photons, one can form an optical image with a spatial resolution determined by the parameters of the applied ultrasonic field. Specifically, the lateral resolution is determined by the focal spot size of the ultrasound, and the axial resolution can be obtained by using either frequency-swept [7] or pulsed [8] ultrasound waves. The selective detection of the ultrasound-modulated photons in UOT is, however, challenging because the modulated light field is spatially incoherent and usually weak compared with the unmodulated scattered DC light.
Various detection methods have been reported. Among them, a single fast detector was first used to detect the modulation of the speckle pattern at the applied ultrasonic frequency [3]. This technique has a limited etendue (defined as the product of the detection area and the acceptance solid angle) because only one or a few speckle grains can be detected simultaneously; otherwise, the modulation depth of the detected light decreases by , where N is the number of detected speckle grains [9]. A confocal Fabry-Perot interferometer (CFPI) [10] was employed to filter one sideband of the ultrasound-modulated photons while blocking the DC and the other modulation sidebands. This technique still suffers from a relatively small etendue, although it is improved over that of the single detector. Parallel speckle processing using a CCD camera was reported [11], and it has a better etendue than a single detector. However, since each CCD pixel usually detects a single speckle grain, the CCD approach will soon become photon-starving as the frame rate increases. Consequently this approach may not be applicable to in vivo imaging because the resulting CCD frame rate is less than the decorrelation rate of speckles. The photorefractive effect in bismuth silicon oxide crystals was recently adopted to interferometrically detect the ultrasound-modulated photons [12-16]. Similarly, the applicability of these techniques is limited by the response time of the crystals (∼100 ms) because these techniques are sensitive to speckle decorrelation, which is less than 1 ms for in vivo detection. A faster response time of ∼250 μs has been demonstrated by employing GaAs crystals along with a strong reference beam [17]. However, the deployment of these fast GaAs crystals in UOT is challenging since one has to simultaneously fight against a low light-coupling efficiency and strong, scattered reference light, which is a dominant noise source in these systems.
The lack of an efficient detection approach has so far prevented this promising imaging modality from being developed into a clinically applicable, reliable optical imaging technique. To overcome the detection difficulty in UOT, we have recently employed spectral-hole burning (SHB) as a front-end absorptive filter, which efficiently extracts the ultrasound-modulated photons with a superior etendue [18]. This optical absorptive filter transmits one modulation sideband of the speckles while blocking the DC and the other sidebands, as in CFPI, allowing the transmitted speckles to be incoherently integrated. Furthermore, this technique offers the potential for real-time in vivo imaging due to its large etendue and immunity to speckle decorrelation. In this paper, we present the theoretical aspect of this novel technique in the context of UOT and the experimental observations.
2. Spectral filtering using spectral-hole burning
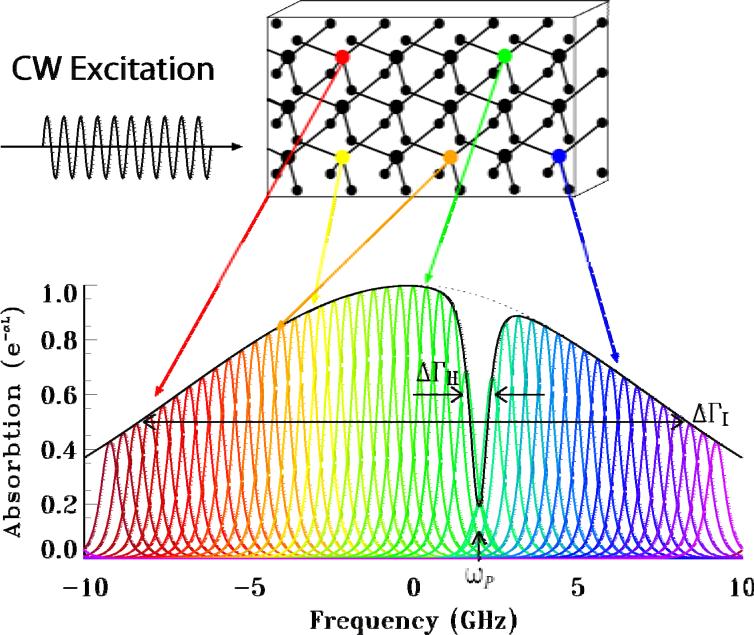
SHB has been extensively investigated for various applications [19-21]. An SHB crystal is a rare-earth ion doped, inhomogeneously broadened optical absorber, which can be modeled as a two-level system [22]. When cryogenically cooled, it has a sub-MHz homogeneous linewidth ΔΓH and a GHz inhomogeneous bandwidth ΔΓI, as shown in Fig. 1. Each homogeneous frequency can be individually accessed using properly tuned narrow laser line excitation. When a monochromatic laser source (called a pump beam) at frequency ωP with intensity IP illuminates a cryogenically cooled SHB crystal, ions at frequency ω that are nearly resonant with the pump beam absorb the photons and are then excited from their ground states, yielding a spectral hole in the crystal's absorption band [21-24]. As a consequence, the corresponding absorption coefficient α (ωP, z)is reduced.
Fig. 1.
Normalized spectral absorption profile of a SHB crystal with a spectral hole burned at ωP. ΔΓI: inhomogeneous bandwidth. ΔΓH: homogeneous linewidth.
To find the absorption coefficient change due to the pump beam, we start our derivations from the slowly varying Maxwell equation of motion at steady state given by [25]
| (1) |
where Ε(ωP, z) and Π(ωP, z) are the slowly varying amplitudes of the pump beam and the resultant polarization of the medium, , K is the wave vector, and ε is the permittivity of the host medium. Accordingly, the complex absorption coefficient is given as
| (2) |
As a result, the intensity of the pump beam evolves as
| (3) |
where , c is the speed of light.
To understand how the absorption coefficient changes as a pump beam is turned on, we need to solve the polarization of the medium in terms of the pump beam field. The polarization can be written in terms of the frequency-dependent population difference ΔN as [25]
| (4) |
where , T2 is the coherence time, , which is the excited level population Ne minus the ground level population Ng , w(z) is fractional population inversion of ions at frequency ω and position z, μe,g, is the reduced dipole matrix element between the excited and ground level transition. Note that , which is a constant. For an SHB crystal with an inhomogeneous absorption profile given as,
| (5) |
the number of absorbers resonant with the pump beam is , where NI is the total number of inhomogeneously broadened absorbers.
Next we solve for the fractional inversion w using the optical Bloch equations [22]
| (6a) |
| (6b) |
| (6c) |
where the dot denotes the time derivatives, u, v, and w are the Bloch vectors, T1 is the effective excited level decay time including any metastable states. Solving Eq. (6a–c) at the steady state, meaning the time derivatives on the left side are taken as zeros, we can obtain the fractional inversion w as
| (7) |
where weq is the equilibrium inversion and equals to −1 when no pump beam is present, is the material's saturation intensity, and is a real Lorentzian given by . So the population difference induced by the pump beam is
| (8) |
Eq. (8) indeed shows that a monochromatic pump beam engraves a Lorentzian spectral hole in the inhomogeneous bandwidth given by Eq. (5), which reduces the absorption of the crystal at the corresponding frequency. The spectral hole depth is a function of the intensity of the pump beam. And the 3-dB power broadened hole width at each position z in the crystal is given by
| (9) |
After the pump beam creates the spectral hole in the SHB crystal, we probe the same spot of the crystal with a weak signal Es(ωs). The signal induced macroscopic polarization in the SHB crystal is contributed by all the absorbers at z regardless their frequencies, therefore it is an integral over the frequency ω, that is,
| (10) |
where
| (11) |
Because the probe signal is weak, its contribution to the population inversion is negligible. As a result, the population difference ΔN inside the crystal is the same as the one induced by the pump beam. So substituting Eq. (8) and (11) into Eq. (10), and solving Eq. (2) for the complex absorption coefficient of the signal beam, one obtains
| (12) |
where α0(ω) is the small-signal-intensity absorption coefficient of the SHB crystal given as
| (13) |
For the SHB medium considered here, , so we can evaluate G(ω ) in Eq. (12) at ωS , and take it out of the integral. So Eq. (12) represents a convolution of the probe Lorentzian with the pump broadened spectral hole. The transmitted signal intensity is
| (14) |
where LC is the crystal thickness. From Eq. (14), we can see that when a probe signal has the same frequency as the pump beam, the probe beam will be transmitted with a reduced absorption. Yet a probe signal with a frequency detuned far away from the pump frequency will be attenuated by the crystal with its original absorption. A sufficiently intense pump beam excites nearly all of the resonant ions in its pathway, and as a consequence, a deep spectral hole at ωP is engraved into the absorption spectrum of the crystal, resulting in a narrowband spectral transparency at ωP. For an optically dense SHB crystal , the crystal can thus be nearly transparent at ωP yet highly absorptive at optical frequencies other than ωP. So the signal with frequency ωP can be filtered through the crystal while other frequency components detuned by more than a hole linewidth given by Eq. (9) are attenuated exponentially.
A large-area pump beam engraves a two-dimensional array of spectral filters across the SHB crystal's effective area, allowing numerous speckles to be processed in parallel. This parallel spectral filtering of the SHB is ideal for achieving a large etendue and detecting one sideband of the ultrasound-modulated diffuse photons in UOT, as described below. The transmitted speckles have their DC and other sidebands suppressed in parallel so that they can simply be incoherently integrated to achieve a high signal-to-noise ratio (SNR).
3. Detection of ultrasound-modulated diffuse photons using spectral-hole burning
When coherent light of frequency ω0 interacts with a focused ultrasound field of frequency ωu inside a turbid medium such as a biological tissue sample, the diffuse light in the ultrasound focal zone is modulated by the ultrasound [5, 6]. In the phase modulation model, the field of the nth independent optical speckle emitted from the tissue can be expressed in phase modulation as
| (15) |
where An is a constant, m is the modulation depth, and is a slowly varying random phase characterizing the speckle. For a weak modulation, Eq. (15) can be approximated as
| (16) |
which represents unmodulated DC light at ω0 and two modulation sidebands at induced by the ultrasound wave at and are random phases associated with the corresponding frequency component.
Provided that the frequency of the pump beam coincides with one sideband of the signal given in Eq. (16), say , and assuming , substituting Eq. (16) into Eq. (14), and carrying out the integral of Eq. (12) for this special case, one obtains
| (17) |
So for an optically thick crystal with a transparency created by the pump beam, the first two terms can ideally be negligible. Therefore, the lower sideband of the UOT speckle is filtered through. For a practical system, the available pump power is a constant P0. Provided the beam is expanded uniformly over an area of S, the pump intensity is IP = P0/S . As can be seen from Eq. (8) and (9), when IP becomes comparable with the crystal saturation intensity Isat as the beam area enlarges, the spectral hole depth becomes shallower and the hole width reduces. Therefore the filtered UOT signal is a nonlinear function of the pump beam area. Assuming a pump beam illumination disk, the many filtered independent UOT speckles are incoherently integrated with a large area detector, yielding an m-dependent photon current of
| (18) |
where , the product of the number N of detected speckles and the average speckle grain area σs . So under the shot-noise limited detection condition, the SNR improves by increasing the pump beam area according to
| (19) |
where SNRN and SNR1 are the SNR for N speckles and one speckle, respectively. Ideally, if the pump beam inverts all the resonant ions, resulting in , the signal SNR grows as . However in practice, the SNR improvement with increasing pump beam area will be reduced by square-root of the residual absorption of the crystal as shown by Eq. (19), which will eventually cause the SNR to decrease with increasing pump area when the pump intensity falls below the saturation intensity.
For a Gaussian distributed pump beam with a radius R and total power P0, where is the peak intensity, σ is a measure of the beam diameter. Eq.s (18) and (19) are respectively written as
| (20) |
| (21) |
Clearly if σ is smaller than the crystal size, then it determines the effective etendue. From Eq. (20), we see that the UOT signal grows nonlinearly as r becomes bigger. Consequently, the Gaussian profile of the pump beam introduces more complex nonlinearities to the SNR improvement as shown in Eq. (21).
Similarly, the other modulation sideband can be selected by simply tuning the pump beam frequency to . The signals given in Eq. (18) or (20) carry the spatial information determined by the ultrasound and can be used to form a high-resolution image of optical contrast.
For a focused ultrasound pulse, as it propagates across the focal zone of the transducer, the detected UOT signal has a Gaussian-like profile over its field of view defined along the ultrasound propagation direction, forming the so-called A-line, as verified in our experiments and reported elsewhere [26, 27]. If the optical properties are inhomogeneous within the focal zone, the detected UOT signal varies accordingly. For example, when a blood vessel, whose absorption coefficient μa is larger than that of its surrounding normal tissue, is situated within the ultrasound focal zone, the ultrasound modulated photons generated within the blood vessel experience more absorption by the blood, resulting in a dip on the detected A-line. A two-dimensional tomogram (the so-called B-mode image) of a sample is formed by displaying each A-line at its corresponding lateral spatial position when the sample is scanned.
The Gaussian-like background on the A-line degrades the image visibility at the edge of the field of view. This background may be removed as follows: (1) If an A-line can be measured in a reference region of the tissue sample with homogeneous optical properties, this A-line can be used as a normalization reference. After the normalization, a B-mode image with a flat background is produced. (2) If such a reference region is not available, digital spectral filtering [28] may be used to demodulate each A-line using a-priori knowledge of the Gaussian-like profile.
4. Experimental validations
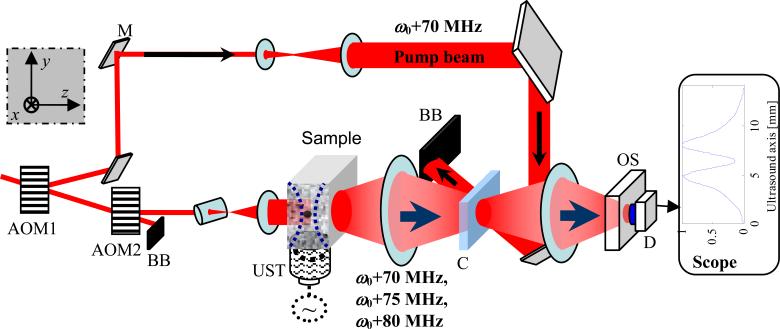
The UOT system using SHB is schematically shown in Fig. 2. The system is equipped with a 10×9×1.5 mm3 2%@Tm3+:YAG crystal (Scientific Materials Corp.). Its working wavelength at 793 nm is a preferred wavelength for biomedical imaging, and solid state laser sources at this wavelength are readily available. A single-mode CW Ti:Sapphire laser (Coherent MBR110) with a linewidth of 181 KHz, pumped by a frequency-doubled diode-pumped Nd:YAG laser (Coherent Verdi 10 W), is utilized as the laser source, which operates at 793.38 nm with an output of 2 W. The laser beam is frequency-shifted by 70 MHz with an acousto-optic modulator (AOM) (IntraAction, Model: AOM802A1), labeled as AOM1 in Fig. 2. The AOM1 generates 980 mW, 3.3 ms long, 70 MHz frequency-shifted optical pulses. These pulses function as the pump beam as shown in Fig. 2, and are expanded to cover the 9 mm diameter clear aperture of the crystal. The crystal is cryogenically cooled to ∼4 K with a continuous flow cryostat (Janis, Model: STVP-400). The pump beam burns transparent spectral holes across the crystal's clear aperture, forming numerous narrowband parallel bandpass filters at 70 MHz. The lifetime of these filters is approximately 10 ms.
Fig. 2.
Experimental setup. AOM: acousto-optic modulator. UST: ultrasound transducer. M: mirror. C: crystal. BB: beam block. D: detector. OS: optical shutter. Left top inset: lab coordinates: x, sample scanning direction; y, ultrasound propagation direction; z, light propagation direction.
Once the narrowband bandpass filters are engraved, AOM1 is turned off and another AOM of the same model, AOM2, is turned on with a driving frequency at 75 MHz, equal to the AOM1 driving frequency 70 MHz plus the ultrasound frequency 5 MHz. The light pulse, which has a 20 μs duration and a 500 mW peak power, is diffracted off the AOM2 and then shaped into a 0.3 mm × 8 mm elliptical beam, which overlaps with the ultrasound focal zone in the 50 × 50 × 10 mm tissue-mimicking phantom sample. The sample consists of 10% porcine skin gelatin (Sigma G2500) and 1% Intralipid, yielding a reduced scattering coefficient of 7 cm−1 at the wavelength of 793 nm. A 2-cycle 5 MHz ultrasound pulse is simultaneously launched into the sample through water, using a focused ultrasound transducer (Panametrics-NDT, Model: A326S-SU, focal length: 16.2 mm, focal spot size: 0.5 mm). The acousto-optic interaction inside the tissue phantom yields two primary weak sidebands at 70 MHz and 80 MHz, in addition to the strong unmodulated DC speckle field at 75 MHz. The diffuse light from the sample is passed through the SHB crystal where the 70 MHz spectral filters were created. The spectral filters transmit the UOT sideband at 70 MHz while significantly attenuating the strong unmodulated DC at 75 MHz and the other sideband at 80 MHz. The transmitted speckles are detected using a large area (3.6 mm × 3.6 mm) Si detector (Thorlabs PDA55) operating at a transimpedance gain of 1.5×10⁵ V/A. An optical shutter (Uniblitz VS14S2S1) is employed in front of the detector to avoid detector saturation due to the scattered pump beam when it is on.
The ultrasound pulse has a peak pressure of 4.3 MPa, resulting in a mechanical index of 1.9 (defined as the ratio of the ultrasound peak pressure in MPa to the square root of the central frequency in MHz), which is compliant to the ultrasound safety standard [29]. The laser safety issue in our system is addressed elsewhere [18].
The ultrasound pulse forms a volumetric ultrasonic field of 0.12 mm3 in the transducer focal zone (assumed ultrasound speed in tissue = 1.5 mm/μs). This determines the spatial resolution of the tomograms. The multiply scattered light in this propagating ultrasound volume allows the creation of a spatial map of the optical properties of the sample along the ultrasound path (an A-line).
We first characterized the spectral filtering capability of the SHB crystal used in our experiments by measuring its absorption, before and after the crystal was cooled. A frequency-chirped optical waveform (from 50 MHz to 80 MHz, with a chirp rate of 30 MHz/ms) was generated by AOM2 and this was later diffused by the tissue mimicking phantom in the imaging demonstration. The frequency-filtering capability of the SHB crystal is shown in Fig. 3. With the pump beam off, the transmitted light was measured both at room temperature and at a cryogenic temperature of 4.7 K. At room temperature there is no absorption in the SHB crystal, so this data (the blue dot-dashed curve) shows the band shape of the diffraction efficiency versus frequency for AOM2. At a cryogenic temperature, it can be seen that the majority of light (the black solid line) was absorbed by the crystal. The difference between these two measurements gives the DC suppression as governed by Beer's law with the pump turned off. For this particular SHB crystal, a DC suppression of 18 dB was measured. A higher DC suppression ratio may be obtained by using an optically thicker crystal . The pump beam was then turned on at 4.7 K, and it engraved spectral filters at the desired frequency, 76 MHz in this case. As shown by the red dashed curve, the engraved spectral filters substantially improved the light transmission at the corresponding frequency, while attenuations at other frequencies were unchanged. Transmission improvements of 14 dB were observed at this pump intensity. At the same time, the power-broadened FWHM of the transmission peak, which defines the bandwidth of the spectral filter, was measured to be about 710 KHz.
Fig. 3.
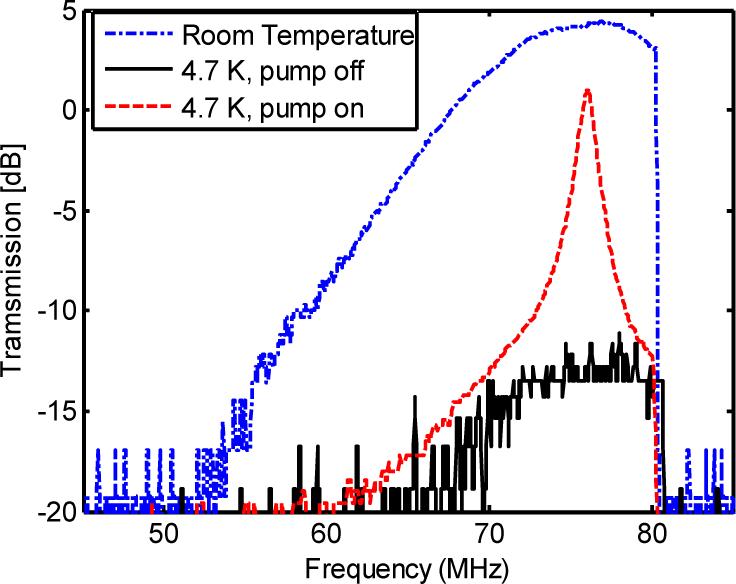
Spectral filtering using spectral-hole burning.
The acousto-optical interactions in a tissue mimicking phantom with a thickness of 10 mm were also verified by measuring the power spectrum of the UOT signal. The results are shown in Fig. 4. In this experiment, a 1 MHz ultrasound wave was applied. To observe the ultrasound modulation, a pump beam created the spectral filter at 70 MHz, and the sample illumination beam was frequency swept from 60 MHz to 80 MHz. When the illumination light was modulated by the applied 1 MHz acoustic field, UOT signals with 1 MHz modulation sidebands resulted and are shown by the dotted curve in Fig. 4. For comparison, the spectrum of the DC light when the ultrasound field was not applied is shown by the solid curve.
Fig. 4.
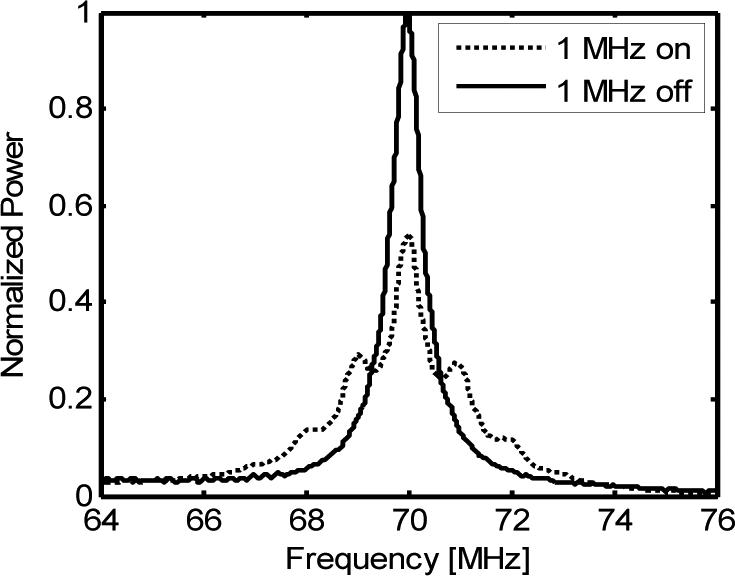
Power spectrum of a UOT signal. Solid line: ultrasound was off. Dotted line: ultrasound was on.
Figure 5 shows the diffuse UOT signals transmitted through the SHB crystal as a function of time with the pump beam turned on and off. In this experiment, 2-cycle 5 MHz ultrasound pulses were used, and the sample illumination light was fixed at 75 MHz. The black trace in Fig. 5 is the detected transmission when no spectral filters were created (pump beam off), and the red trace depicts the transmission when the spectral filters were engraved (pump beam on). It can be seen from the figure that when the pump beam was turned off, both the weak ultrasound-modulated sidebands and the strong unmodulated DC speckles experienced the same strong absorption (about 18 dB here), no UOT modulation was detected. This is equivalent to detect many UOT speckles using a single detector and an ND filter. After the pump beam was turned on to create the spectral filter, the transmission of the UOT modulation sideband at 70 MHz was significantly improved, yet the strong DC and the other sideband at 80 MHz still experienced the same strong attenuation, as governed by Eq. (17). As a result, the weak modulation was detected as shown by the red trace. As a consequence of this spectral filtering and the ultrasound pulse propagation, the optical fluence rate in a homogeneous scattering medium along the ultrasound propagation path was sequentially mapped (the red trace). This trace is an A-line, and the field of view along the ultrasound axis is primarily determined by the focal depth of the transducer. When an object having a larger μa than its surroundings is in the field of view, a portion of the modulated photons generated at the position of the object are absorbed by it, resulting in a dip that indicates the position of the target, as illustrated by the oscilloscope trace in Fig. 2.
Fig. 5.
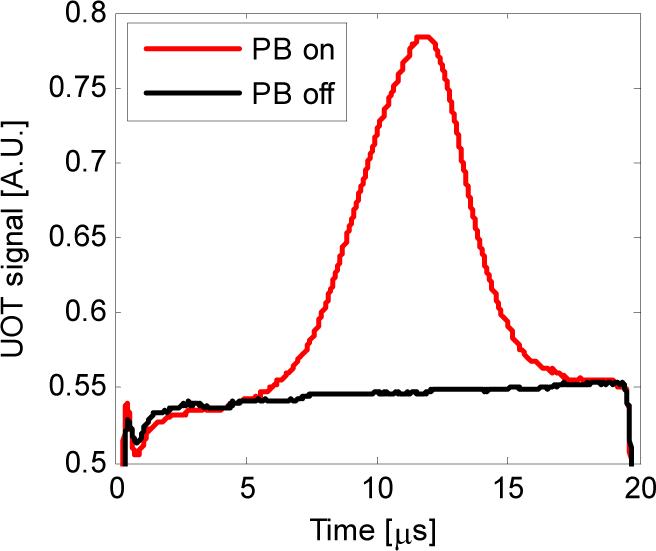
Typical UOT signals with the pump beam on (red) and off (black). PB: pump beam.
As predicted by Eq. (18), the detected UOT signal should linearly grow with N as the number of the processed independent speckles N increases. By controlling the effective pump beam size, this prediction has been verified experimentally. The detailed relationship between the UOT signal strength and the pump beam area (proportional to N) has been discussed elsewhere [18]. We also experimentally examined the prediction of the improvements of the SNR by . Figure 6 shows the measured SNR (stars) as a function of the pump beam area, which is proportional to N. The solid red line is a theoretical fitting. It can be seen from Fig. 6 that the measured data points at the center agree well with the theoretical fitting. The discrepancy between theory and experiment for the two lowest SNR cases is likely caused by the digitization error since in this case only a small number of speckles were processed, yielding weak modulated signals and a strong DC background. As a result, the digitization noise dominates the intensity noise (assuming shot-noise limited). As the pump beam size was enlarged, more speckles were processed. The signals became stronger, so the intensity (shot) noise dominated and the measured SNRs coincided with the theoretical predictions. The highest two SNRs falling short of the theoretical values are mainly due to the Gaussian distribution of the pump beam, as verified in Ref. [18]. Because of the large area of the Gaussian distributed pump beam, the pump intensity at the edge of the pump beam was lower, the spectral holes were burned less deeply and the transmitted edge speckles experienced a higher attenuation. Threfore, the transmitted signal broke its linear relationship with N, resulting in smaller SNRs compared to the theoretical values that assumed uniform laser intensity and spatially uniformly processed speckles. Provided a uniform and sufficiently powerful pump beam, one may expect that the measured SNRs will match their theoretical values over a larger pump beam area.
Fig. 6.
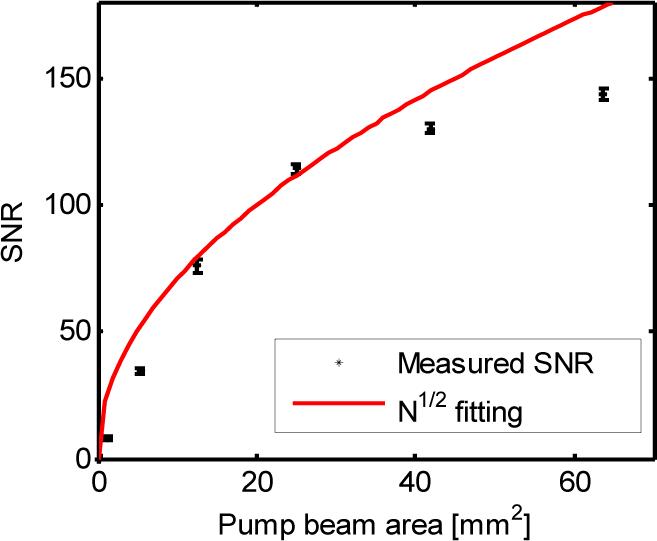
SNR improvement as a function of the pump beam area.
The axial resolution of our pulsed SHB UOT is determined by the duration of the ultrasound pulse. This has been qualitatively verified in our experiment. Here, a small absorber (2.8 mm × 1.3 mm × 0.8 mm) dyed by black India ink, photographically shown in the top left inset of Fig. 7, was buried inside a 10 mm thick tissue phantom. The absorber was positioned at the focus of the ultrasound transducer. Figure 7 shows A-lines when ultrasound pulses with different durations propagate in the direction of the red arrow. The dips correspond to the position of the absorber. It can be seen from Fig. 7 that as the duration of the ultrasound pulse increases, the signal grows. Yet long ultrasound pulses also deteriorate the contrast and resolution of the images. As can be seen from Fig. 7, for a 1-cycle short pulse, the image contrast is 88%, whereas the image contrast degrades to only 49% for a 9-cycle pulse. The deterioration of image contrast is due to the degraded resolution. To understand this, let us qualitatively examine the edge spread functions of the image of the absorber. As shown in Fig. 7, the bottom edge of the absorber resulted in the falling edge of the image dip, and its top edge induced the rising edge of the dip. When a short pulse, such as the single cycle case, was applied, the two edges were well resolved and separated, so the image contrast is the best. However, when a long pulse, such as the 9-cycle pulse, was applied, because the resolution deteriorated, these two edges consequently spread out to overlap each other, yielding inferior image contrast and distortion. In addition, for very long pulses, such as those with 15 cycles and 20 cycles, the distortion was so severe that the dip in ultrasound modulated light due to the absorber appears split as if there were two absorbers. The reasons for this split are as follows: since the acoustic pulses extend so much longer than the absorber, the dominant signal contribution comes from the region outside the absorber, which has a maximum when the acoustic pulse overlaps with the focal zone. The absorber only slightly suppresses the signal, giving the two shoulders on the central peak.
Fig. 7.
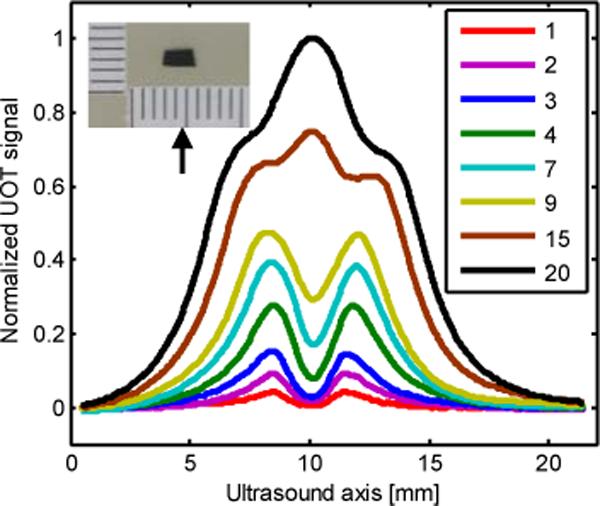
Signal strength and resolution as a function of ultrasound pulse duration. Legend: number of cycles.
As pointed out in Section 3, tomograms obtained with our pulsed UOT system have a Gaussian-like background in their axial dimension, and this background degrades the image visibility. Figure 8 shows one of our B-mode tomograms obtained with the present system. In this experiment, a patterned absorber dyed with black India ink, photographically shown at the left side of Fig. 8 (a), was buried in the middle of the 50 × 50 × 10 mm (x, y, z) tissue phantom to mimic the optical absorption of a soft biological tissue. The dimensions of the top and bottom lines along the ultrasound axis y are 0.6 mm and 0.7 mm, respectively. The gap between these two lines is 0.7 mm. The thickness of the target in the light propagation direction z is 0.9 mm. At the right side of this absorber, five cubic absorbers (0.85 × 0.85 × 0.85 mm) were also buried along the ultrasound propagation direction. The separation between adjacent cubes was about 3 mm. In the experiment, the ultrasound transducer and the sample illumination light were fixed. The phantom was scanned along x for 14 mm with a step size of 0.2 mm. Each A-line was averaged 64 times and the tomogram was interpolated. The theoretical axial resolution is 0.6 mm. As shown in Fig. 8 (b), the patterned absorber was imaged with high fidelity, and the 0.7 mm gap was well resolved. Figure 8 (b) also shows the limited field of view as well as the undesirable background. It can be seen that only the central three cubic absorbers are visible. The other two, at the top and the bottom, are not detected because they are out of the field of view. Moreover, it is also obvious that the Gaussian-like background deteriorates the visibility of the structure. The Gaussian-like background can be removed by normalizing each A-line to an absorber-free reference A-line as described in Section 3. Figure 8 (c) shows the same tomogram as Fig. 8 (b) but with the background normalized to a reference A-line. The reference A-line used here is the A-line at the center of the gap between the patterned absorber and the cube absorbers. It can be seen that the visibility has been significantly improved.
Fig. 8.
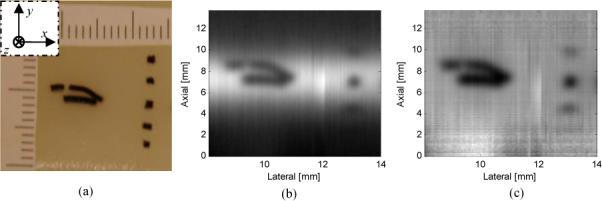
Tomogram obtained with the SHB UOT system. (a) Photograph of the object. Scale in mm. Left top inset: lab coordinates. (b) B-mode tomogram with the background. (c) B-mode tomogram with the background removed by division.
5. Conclusions
In summary, we established a theoretical model to describe a novel technique that utilizes a nonlinear optical filter afforded by an SHB crystal to detect ultrasound-modulated photons in UOT. Experimental results are also presented. The method has the largest etendue [18] among the existing UOT approaches and processes a large number of speckles in parallel. Since this technique is based on fast frequency-dependent absorption, it is inherently insensitive to fast speckle decorrelation, potentially allowing in vivo imaging. In our experiments, we imaged tissue-mimicking phantoms at 10 mm depth. It should be pointed out immediately that this is not the limit of our technique, since the imaging depth may be improved by utilizing an optically thicker SHB crystal to further suppress the strong DC, along with a balanced detection scheme [30] to reject laser intensity noise. This technique opens a new opportunity for the development of a reliable optical imaging system with ultrasound resolution for various biomedical applications, such as early breast cancer detection.
Acknowledgements
This work is supported by US National Institute of Health grant R33 CA 094267.
Footnotes
OCIS codes: (170.6960) Tomography; (170.1065) Acousto-optics; (110.0113) Imaging through turbid media; (030.6140) Speckle; (160.5690) Rare-earth-doped materials; (270.1670) Coherent optical effects.
References and links
- 1.Jöbsis FF. Noninvasive, infrared monitoring of cerebral and myocardial oxygen sufficiency and circulatory parameters. Science. 1977;198:1264–1267. doi: 10.1126/science.929199. [DOI] [PubMed] [Google Scholar]
- 2.Boas DA, Brooks DH, Miller EL, DiMarzio CA, Kilmer M, Gaudette RJ, Zhang Q. Imaging the body with diffuse optical tomography. IEEE Sig. Proc. 2001;18:57–75. [Google Scholar]
- 3.Wang LV, Jacques SL, Zhao X. Continuous-wave ultrasonic modulation of scattered laser light to image objects in turbid media. Opt. Lett. 1995;20:629–631. doi: 10.1364/ol.20.000629. [DOI] [PubMed] [Google Scholar]
- 4.Kempe M, Larionov M, Zaslavsky D, Genack AZ. Acousto-optic tomography with multuply scattered light. J. Opt. Soc. Am. A. 1997;14:1151–1158. [Google Scholar]
- 5.Wang LV. Mechanisms of ultrasonic modulation of multiply scattered coherent light: a Monte Carlo model. Opt. Lett. 2001;26:1191–1193. doi: 10.1364/ol.26.001191. [DOI] [PubMed] [Google Scholar]
- 6.Wang LV. Mechanisms of Ultrasonic Modulation of Multiply Scattered Coherent Light: An Analytic Model. Phys. Rev. Lett. 2001;87:043903. doi: 10.1103/PhysRevLett.87.043903. [DOI] [PubMed] [Google Scholar]
- 7.Wang LV, Ku G. Frequency-swept ultrasound-modulated optical tomography of scattering media. Opt. Lett. 1998;23:975–977. doi: 10.1364/ol.23.000975. [DOI] [PubMed] [Google Scholar]
- 8.Lev A, Sfez BG. Pulsed ultrasound-modulated light tomography. Opt. Lett. 2003;28:1549–1551. doi: 10.1364/ol.28.001549. [DOI] [PubMed] [Google Scholar]
- 9.Leutz W, Maret G. Ultrasonic modulation of multiply scattered light. Physica B. 1995;204:14–19. [Google Scholar]
- 10.Sakadžić S, Wang LV. High-resolution ultrasound-modulated optical tomography in biological tissues. Opt. Lett. 2004;29:2770–2772. doi: 10.1364/ol.29.002770. [DOI] [PubMed] [Google Scholar]
- 11.Lévêque S, Boccara AC, Lebec M, Saint-Jalmes H. Ultrasonic tagging of photon paths in scattering media: parallel speckle modulation processing. Opt. Lett. 1999;24:181–183. doi: 10.1364/ol.24.000181. [DOI] [PubMed] [Google Scholar]
- 12.Murray TW, Sui L, Maguluri G, Roy RA, Nieva A, Blonigen F, DiMarzio CA. Detection of ultrasound-modulated photons in diffuse media using the photorefractive effect. Opt. Lett. 2004;29:2509–2511. doi: 10.1364/ol.29.002509. [DOI] [PubMed] [Google Scholar]
- 13.Ramaz F, Forget BC, Atlan M, Boccara AC, Gross M, Delaye P, Roosen G. Photorefractive detection of tagged photons in ultrasound modulated optical tomography of thick biological tissues. Opt. Express. 2004;12:5469–5474. doi: 10.1364/opex.12.005469. [DOI] [PubMed] [Google Scholar]
- 14.Gross M, Ramaz F, Forget BC, Atlan M, Boccara AC, Delaye P, Roosen G. Theoretical description of the photorefractive detection of the ultrasound modulated photons in scattering media. Opt. Express. 2005;13:7097–7112. doi: 10.1364/opex.13.007097. [DOI] [PubMed] [Google Scholar]
- 15.Sui L, Roy RA, DiMarzio CA, Murray TW. Imaging in diffuse media with pulsed-ultrasound-modulated light and the photorefractive effect. Appl. Opt. 2005;44:4041–4048. doi: 10.1364/ao.44.004041. [DOI] [PubMed] [Google Scholar]
- 16.Xu X, Zhang H, Hemmer P, Qing D.-k., Kim C, Wang LV. Photorefractive detection of tissue optical and mechanical properties by ultrasound modulated optical tomography. Opt. Lett. 2007;32:656–658. doi: 10.1364/ol.32.000656. [DOI] [PubMed] [Google Scholar]
- 17.Lesaffre M, Jean F, Ramaz F, Boccara AC, Delaye P, Roosen G. In situ monitoring of the photorefractive response time in a self-adaptive holography setup developed for acousto-optic imaging. Opt. Express. 2007;15:1030–1042. doi: 10.1364/oe.15.001030. [DOI] [PubMed] [Google Scholar]
- 18.Li Y, Zhang H, Kim C, Wagner KH, Hemmer P, Wang LV. Pulsed ultrasound-modulated optical tomography using spectral-hole burning as a narrowband spectral filter. Appl. Phys. Lett. 2008;93:011111. doi: 10.1063/1.2952489. [DOI] [PMC free article] [PubMed] [Google Scholar]
- 19.Mossberg TM. Time-domain frequency-selective optical storage. Opt. Lett. 1982;7:77–79. doi: 10.1364/ol.7.000077. [DOI] [PubMed] [Google Scholar]
- 20.Ménager L, Lorgeré I, Le-Gouët J-L, Dolfi D, Huignard J-P. Demonstration of a radio-frequency spectrumanalyzer based on spectral hole burning. Opt. Lett. 2001;26:1245–1247. doi: 10.1364/ol.26.001245. [DOI] [PubMed] [Google Scholar]
- 21.Li Y, Hoskins A, Schlottau F, Wagner KH, Embry C, Babbitt WR. Ultrawideband coherent noise lidar range-Doppler imaging and signal processing by use of spatial-spectral holography in inhomogeneously broadened absorbers. Appl. Opt. 2006;45:6409–6420. doi: 10.1364/ao.45.006409. [DOI] [PubMed] [Google Scholar]
- 22.Allen L, Eberly JH. Optical resonance and two-level atoms. Dover publications, Inc.; New York: 1987. [Google Scholar]
- 23.Mitsunaga M, Brewer RG. Generalized perturbation theory of coherent optical emission. Phys. Rev. A. 1985;32:1605–1613. doi: 10.1103/physreva.32.1605. [DOI] [PubMed] [Google Scholar]
- 24.Colice M, Schlottau F, Wagner KH. Broadband radio-frequency spectrum analysis in spectral-hole-burning media. Appl. Opt. 2006;45:6393–6408. doi: 10.1364/ao.45.006393. [DOI] [PubMed] [Google Scholar]
- 25.Meystre P, S. M., III . Elements of Quantum Optics. 3 ed. Springer-Verlag Berlin Heidelberg; New York: 1999. [Google Scholar]
- 26.Marks FA, Tomlinson HW, Brooksby GW. A comprehensive approach to breast cancer detection using light: photon localization by ultrasound modulation and tissue characterization by spectral discrimination. Proc. SPIE. 1993;1888:500–510. [Google Scholar]
- 27.Atlan M, Forget BC, Ramaz F, Boccara AC, Gross M. Pulsed acousto-optic imaging in dynamic scattering media with heterodyne parallel speckle detection. Opt. Lett. 2005;30:1360–1362. doi: 10.1364/ol.30.001360. [DOI] [PubMed] [Google Scholar]
- 28.Hayes MH. Statistical digital signal processing and modeling. Jogn Wiley & Sons, Inc.; New York: 1996. [Google Scholar]
- 29.Dalecki D. Mechanical bioeffects of ultrasound. Annu. Rev. Biomed. Eng. 2004;6:229–248. doi: 10.1146/annurev.bioeng.6.040803.140126. [DOI] [PubMed] [Google Scholar]
- 30.Hobbs PCD. Ultrasensitive laser measurements without tears. Appl. Opt. 1997;36:903–920. doi: 10.1364/ao.36.000903. [DOI] [PubMed] [Google Scholar]


