Abstract
A model was developed to simulate acoustically the effects of excitation spread in cochlear implants (CI). Based on neurophysiologic data, the proposed model simulates the electrical-current decay rate associated with broad and narrow types of excitation, such as those produced by monopolar and bipolar electrode configurations. The effect of excitation spread on speech intelligibility was simulated in normal hearing subjects by varying the slopes of the synthesis bands in the noise vocoder. Sentences and monosyllabic words processed via 4–16 channels of stimulation with varying degrees of excitation spread were presented to normal-hearing listeners for identification. Results showed significant interaction between spectral resolution (number of channels) and spread of excitation. The effect of narrowing the excitation spread was minimal when the spectral resolution was sufficiently good (> 8 channels) but it was significant when the spectral resolution was poor (4 channels). A significant decrement in performance was observed for extremely narrow excitation spread. This outcome is partly consistent with behavioral data obtained with cochlear implant studies in that CI users tend to do as well or better with monopolar stimulation than with bipolar stimulation.
Keywords: cochlear implant, monopolar, bipolar, current spread, vocoder
1. INTRODUCTION
A number of factors can influence channel interaction in cochlear implants (Stickney et al., 2006; Boex et al., 2003). These include, but are not limited to, the electrode configuration (e.g., bipolar, monopolar) employed to generate the electrical field, and the design and placement of the electrode array (e.g. the distance between electrodes and spiral ganglion cells). In the bipolar electrode configuration, electric fields generated between two narrowly spaced electrodes (e.g. a bipolar pair) produce theoretically localized neural activation. In the monopolar electrode configuration the spatial distance between the active and return electrodes is larger so theoretically the current spread is greater than bipolar configuration.
Several studies reported measurements of current spread in bipolar and monopolar configurations using different methods (see summary in Table 1). The slopes of forward-masked spatial tuning-curves (FmSTC) are thought to reflect the current decay with spatial distance along the cochlea. With the FmSTC method (Nelson et. al., 2008), the average current decay was found to be 3.7 dB/mm for bipolar stimulation, approximately three times steeper than the average decay rate of 1.2 dB/mm for monopolar stimulation. The FmSTC current-decay estimates exhibit large variability across subjects because the tuning depends largely on the survival rate of the auditory nerve. A more accurate and reliable method would be to measure decay rate directly from neuron responses to electric stimulation.
Table 1.
Current spread estimates measured with five different methods.
| Spread (dB/mm) | FmSTC(Nelson et al., 2008) | Ringer’s bath(Kral et al., 1998) | Nerve Unit (Kral et al., 1998) | Cat (Hartmann et al., 1990b) | Ix=IEexp(−x/λ)(Black and Clark, 1985, O’Leary 1985) | Mean |
|---|---|---|---|---|---|---|
| Monopolar | 1.2 | 3.75 | 3.12 | 3 | 2–4 | 2.8 |
| Bipolar | 3.7 | 7.5 | 8.7 | 7.4 | 8–11 | 7.4 |
In Nucleus-22 cochlear implants, measurements of potential decay in a 500-ml bath filled with Ringers’s solution showed decays of 3.75 dB/mm for monopolar and 7.5 dB/mm for bipolar configurations (Kral et al. 1998). In cats, auditory nerve single-unit thresholds to electrical stimulation were used to determine spatial tuning curves for monopolar and bipolar configurations; the respective decay rates were 3.12 and 8.47 dB/mm (Kral et al. 1998). These thresholds have been used to determine the spatial resolution of the electrical stimulus (Hartmann and Klinke, 1990b). The mean slopes were found to be ~3 and ~7.4 dB/mm for monopolar and bipolar stimulations respectively (Hartmann and Klinke, 1990b). Finally, estimates can be inferred from the equation used to compute current spread: IX = IE exp(−x/λ), where IX is the current at point x, IE is the current impressed by the electrode, and λ is the current-attenuation distance constant. Early studies reported constants of 2–4 and 8–11 mm for bipolar and monopolar stimulations respectively (Black and Clark, 1985; Black et al., 1981, 1983; O’Leary et al., 1985). The ratio of monopolar to bipolar distance (~3) is consistent across studies.
Based on the above evidence, it seems reasonable to expect that, in terms of speech recognition, bipolar configuration would be more beneficial than monopolar. Behavioral data from CI users, however, suggest otherwise. Subjects fitted with monopolar stimulation perform as well or better than with bipolar stimulation. In the study by Pfingst et al. (1997), for instance, Nucleus-22 patients fitted with a wide bipolar configuration (BP+6; 5.25 mm separation) performed better on speech recognition tasks than when fitted with a narrow bipolar configuration (BP; separation of 0.75 mm). A similar outcome was also observed by Pfingst et al. (2001) with Nucleus-24 patients using the SPEAK strategy. In addition, an interaction was observed between effects of electrode configuration and place of stimulation. Similarly, in other studies (Lehnhardt et al., 1992; Zowlan, et al., 1996) subjects showed stronger preference for monopolar stimulation over bipolar stimulation.
The potential mechanisms underlying the benefit of broader excitation patterns produced by monopolar stimulation remain unknown. One hypothesis is that monopolar electrode configuration reduces current levels required to elicit an auditory sensation. Evidence from forward-masking experiments showed that the current spread might be equivalent in both cases since the bipolar configuration requires larger current amplitude to elicit the same loudness of the monopolar configuration (Kwon and van Honert, 2006; Chatterjee, 1999; Pfingst et al., 1997, 2001; van den Honert and Stypulkowski, 1987). Another hypothesis is that broader configurations excite larger neuron populations providing a more robust representation of information on each channel. It is known that the number of neurons excited by an electrical stimulus increases considerably as the stimulus level increases. Furthermore, many types of discrimination improve as a function of stimulus level (Morris and Pfingst, 2001). These hypotheses need to be interpreted with caution given the large number of confounding factors associated with cochlear implants. Foremost among them is the variability in surviving nerve fiber sites as well as the differences in the distribution of neural sites containing excitable neuron elements among cochlear implant users. These confounds make it extremely difficult to gauge the perceptual effect of monopolar/bipolar configurations.
Another disparity between theoretical expectations and experimental data is that increasing the number of channels should lead to better spectral resolution and therefore yield better speech recognition performance. However, several studies (Fishman, Shannon, & Slattery, 1997; Friesen, Shannon, Baskent, & Wang, 2001) have demonstrated that speech recognition does not improve once the number of channels exceeds ten. These findings are accounted for partly in terms of channel interactions and the limited spatial selectivity of stimulation.
The above studies lead us to simulate, at the acoustic level, the effect of spread of excitation using a physiologically-based model that describes the decay rate of electrical current dispersed in the cochlea. In the present study we extend the noise-band vocoder simulations to take into account the spread of excitation. Others have attempted to model channel interaction in vocoder simulations by changing the slopes of the analysis (Fu and Shannon, 2002) and/or synthesis (Shannon et al., 1998) bandpass filters. The choices of filter slopes, however, were not based on physiological data (as it is in our study) and the simulated spread of excitation was restricted to a small frequency region (signal bandwidth). In contrast, in our simulation the filter slopes decay exponentially to simulate the same exponential rate of current decay. In addition, the bandwidth of the different synthesis filters depends on the current spread along the basilar membrane and the characteristic frequency along the excited basilar-membrane segment. So, in our simulation the spread of excitation is not restricted in any way and extends up to 20 kHz. In the present vocoder simulations, we chose the monopolar and bipolar current-decay estimates according to measurements made directly from neuron responses to electric stimulation; this method is more accurate and reliable since it avoids the confounding factor of neuron survival rate. The bipolar current decay is 8 dB/mm, which is simulated by a synthesis filter with 26.67 dB/mm attenuation rate. The monopolar current decay rate is 4 dB/mm, which is simulated by a synthesis filter with 13.3 dB/mm. The 1 dB/mm current decay, simulated by a synthesis filter with 3.33 dB/mm attenuation is much wider than the typical monopolar-stimulation current decay.
Vocoder simulations are used in the present study for several reasons. For one, these simulations have been shown by many (e.g., Dorman and Loizou, 1997) to provide results consistent with the outcome of cochlear implants. Secondly, the vocoded speech can be presented to normal-hearing listeners in the absence of confounding factors (e.g., neuron survival sites) associated with cochlear implants. The present study focuses on the interaction between spectral resolution (number of channels) and spread of excitation. Spectral resolution is varied by processing the stimuli in 4–16 channels with varying degrees of excitation spread. The processed stimuli (sentences in quiet and in noise, and monosyllabic words) are presented to normal-hearing listeners in a speech identification paradigm.
2. METHOD
2.1. Subjects and speech material
Twenty three undergraduate college students with normal hearing were paid to participate in the experiments; ages ranged from 18 to 24 years old. All participants were native speakers of American English. HINT sentences (Nilsson et al., 1994) and monosyllabic words (Peterson and Lehiste, 1962) were used in the recognition test in quiet. The HINT sentences were also presented in speech-shaped noise at 10 dB SNR. The (steady) speech-shaped noise had a spectrum that matched the long-term spectrum of the HINT sentences The research protocol was approved by the Institutional Review Board of the University of Central Oklahoma.
2.2. Signal processing
The effect of excitation spread on speech intelligibility was simulated in normal hearing subjects by varying the slopes of the synthesis bands in the noise vocoder. More specifically, the synthesis-band slopes (acoustic spectral decay) matched the current decay rate (measured in dB/mm) typical of monopolar and bipolar stimulation. The effective bandwidth of the synthesis bands approximated the current spread along the basilar membrane. The slopes of the analysis bands were held constant at −36dB/octave (see Table 2).
Table 2.
Filter slopes used for simulating the various spread of excitation conditions.
| Current spread dB/mm | Filter Slope dB/mm | Filter Slope dB/octave | Q-factor(fc/3dB bandwidth) |
|---|---|---|---|
| −1 | −3.33 | −14 | 3.7 |
| −4 | −13.33 | −50 | 14.5 |
| −8 | −26.66 | −110 | 28.6 |
| baseline | −36 | 1.6 |
The stimuli were processed through 4-, 8-, or 16-channels (see block diagram in Fig. 1). The test material was first band-pass filtered (6th order Butterworth) into 4–16 channels according to a logarithmic filter spacing. Table 3 lists the center-frequencies and bandwidths of the analysis filters. Following the bandpass filtering, the envelopes were computed using a half-wave rectifier followed by a second-order Butterworth low-pass filter with a 400-Hz cutoff frequency. The resulting envelopes of each channel were modulated with white noise and re-filtered with synthesis filters having slopes matched to the current decay rate of monopolar and bipolar stimulation. Figure 2–Figure 3 show the magnitude frequency response of the synthesis filters used in 4- and 8-channel vocoders. Note that the bandwidth of the synthesis band-pass filters matched the frequency range corresponding to the cochlear segment excited by electrical stimulation. Finally, the stimuli were synthesized by summing up the outputs across all channels.
Fig. 1.
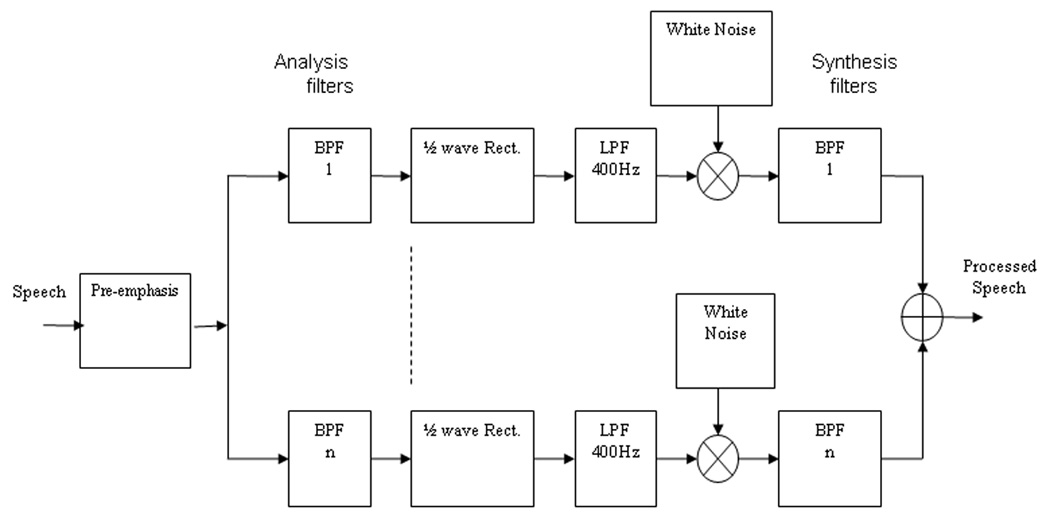
Block diagram of noise-excited vocoder.
Table 3.
Center frequencies (Fc) and bandwidths (BW) of 4-, 8-, 16-, and 22-channel vocoders. Frequencies are given in Hz.
| Ch 4 | Ch8 | Ch16 | |||
|---|---|---|---|---|---|
| Fc | BW | Fc | BW | Fc | BW |
| 626 | 875 | 313 | 250 | 251 | 125 |
| 1563 | 1000 | 563 | 250 | 376 | 125 |
| 3063 | 2000 | 876 | 375 | 501 | 125 |
| 6001 | 3875 | 1313 | 500 | 688 | 250 |
| 1938 | 750 | 938 | 250 | ||
| 2876 | 1125 | 1188 | 250 | ||
| 4313 | 1750 | 1438 | 250 | ||
| 6563 | 2750 | 1688 | 250 | ||
| 2001 | 375 | ||||
| 2438 | 500 | ||||
| 2938 | 500 | ||||
| 3501 | 625 | ||||
| 4188 | 750 | ||||
| 5001 | 875 | ||||
| 6001 | 1125 | ||||
| 7251 | 1375 | ||||
Fig. 2.
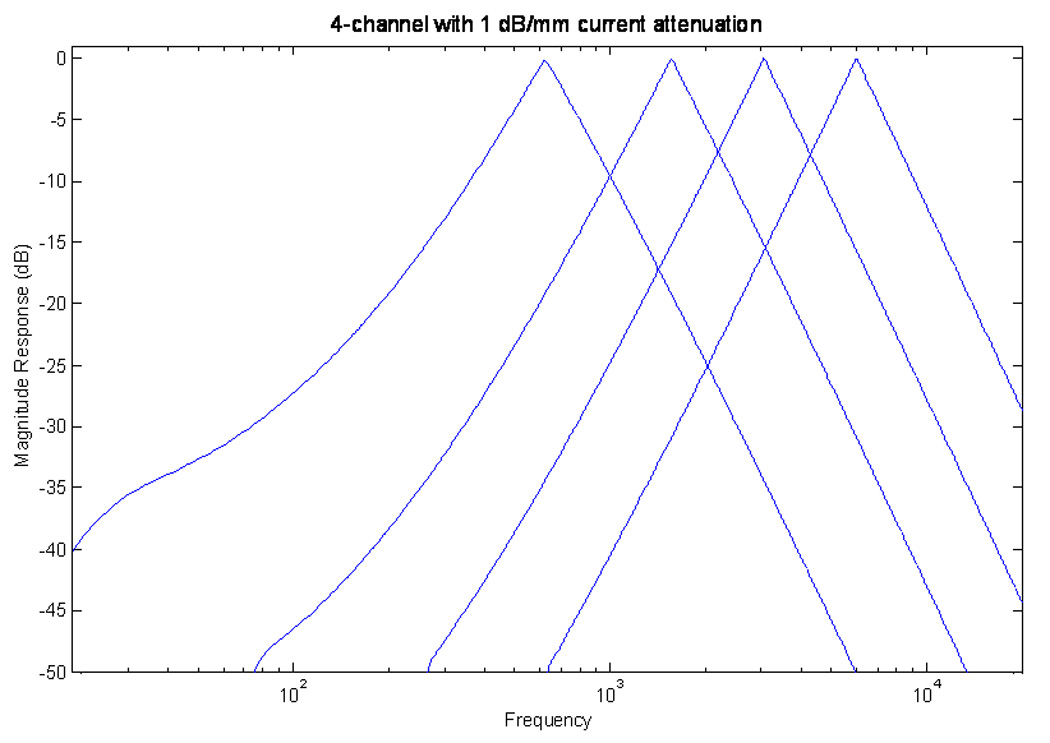
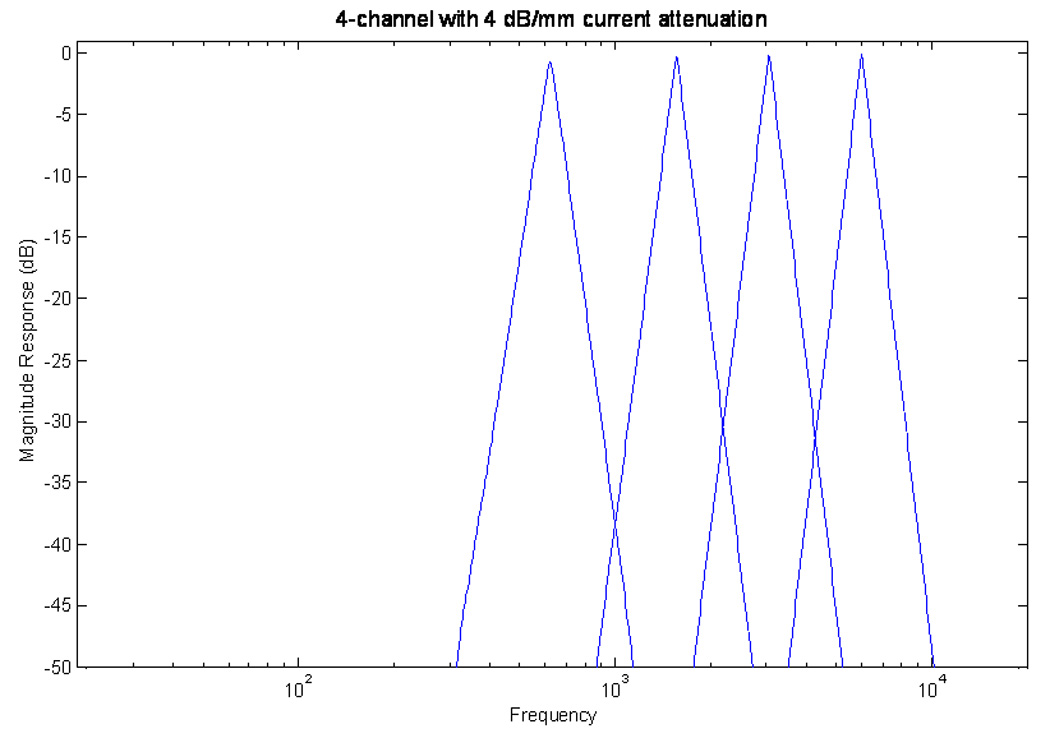

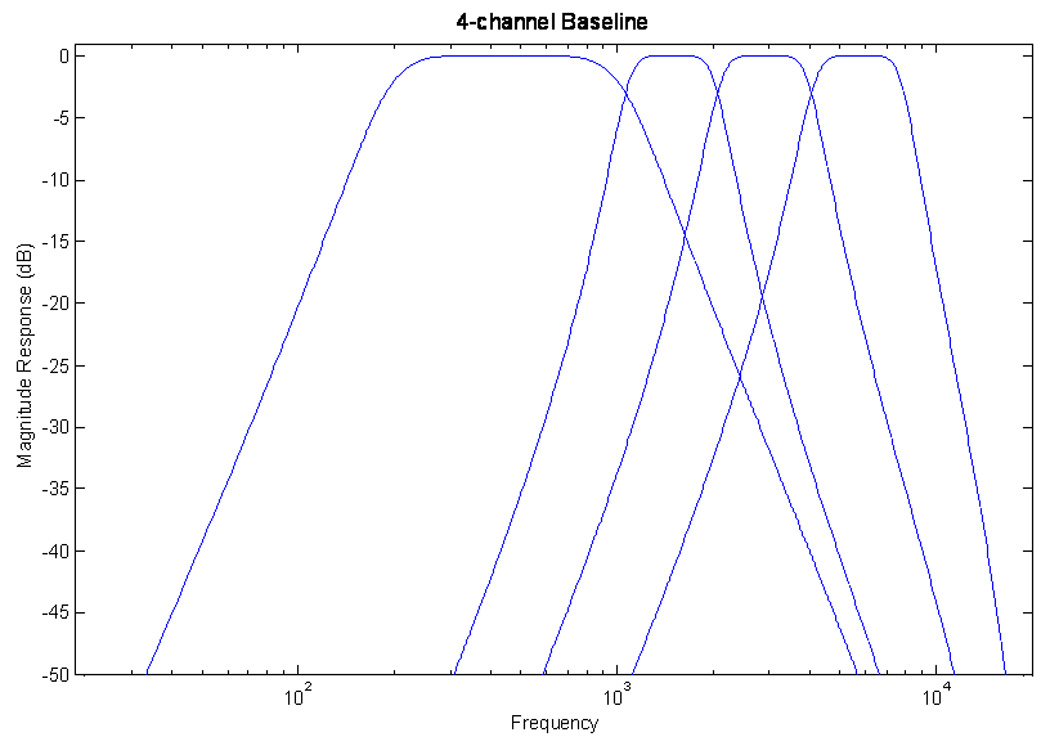
(a, b, c, d). Magnitude responses of the synthesis filters for the 4-channel vocoder with slopes of 3.33. 13.3, and 26.67 dB/mm (equivalent to current decay rate of 1, 4, and 8 dB/mm respectively) from top to bottom respectively. Bottom panel shows the filter used in the baseline condition.
Fig. 3.
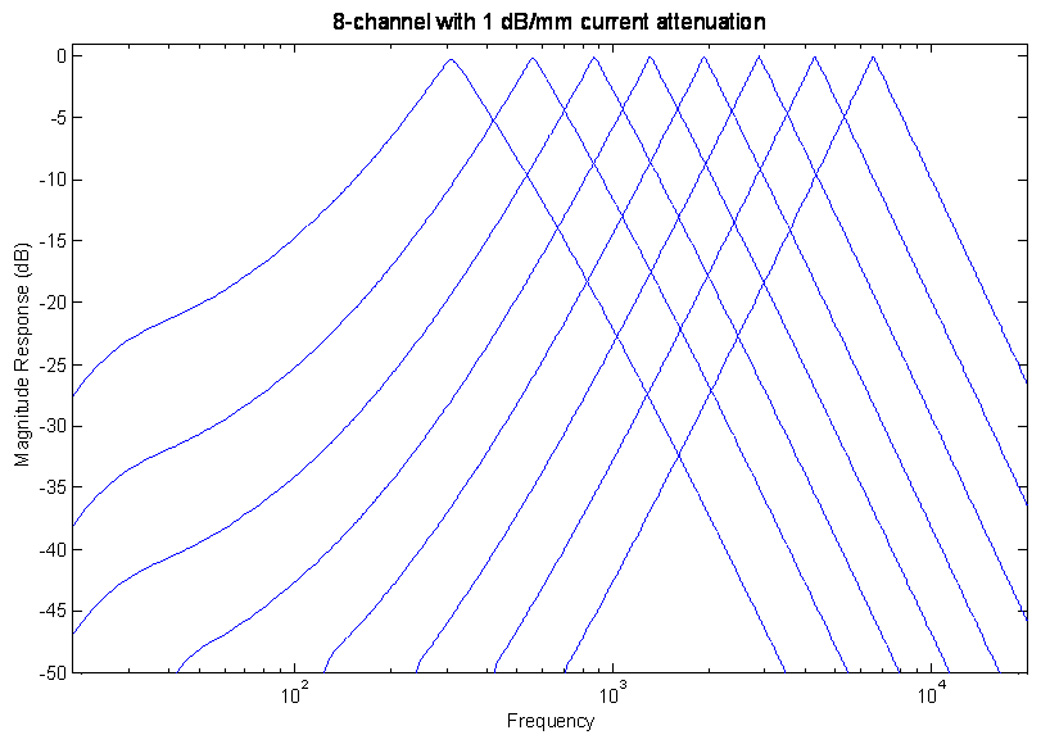
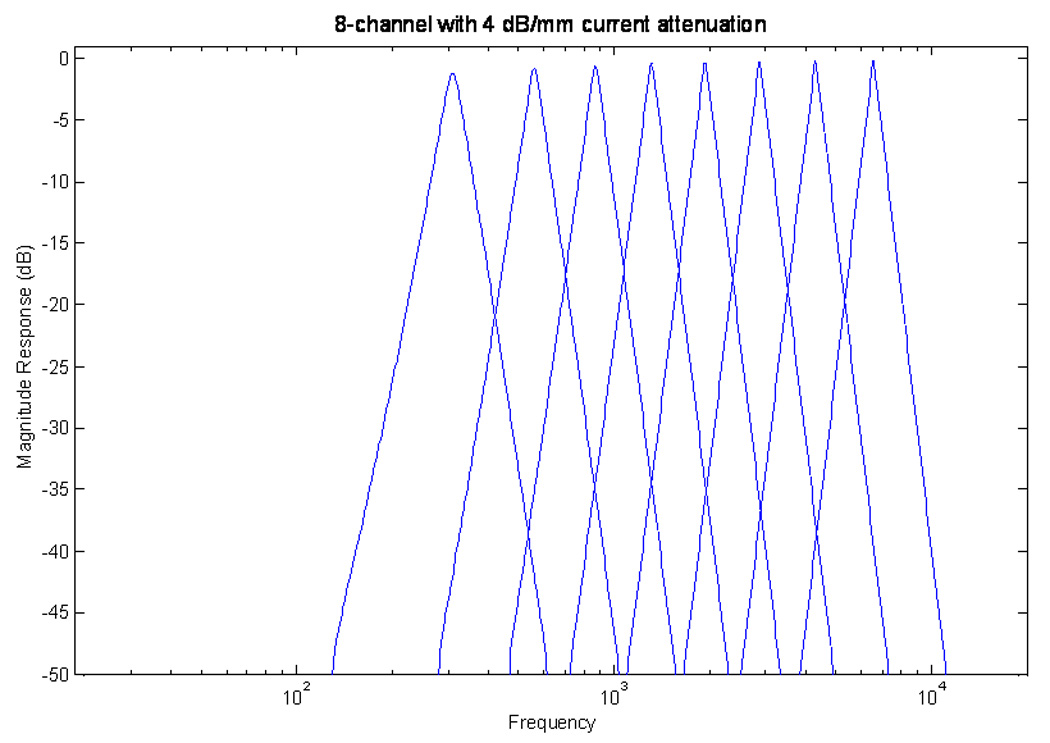
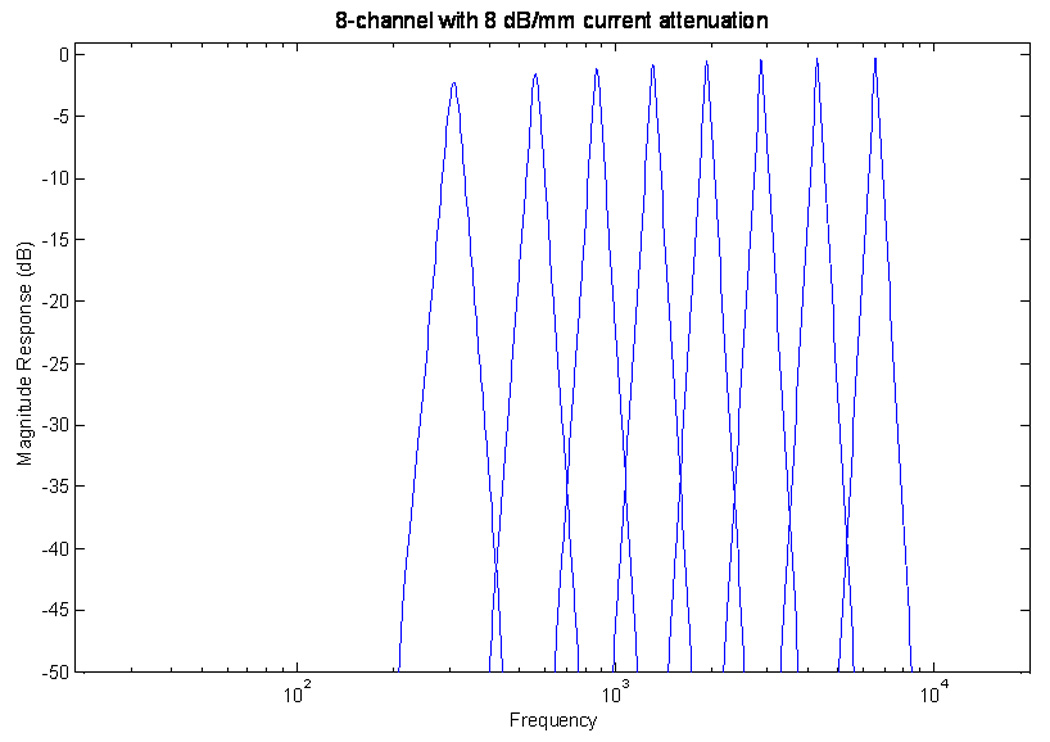
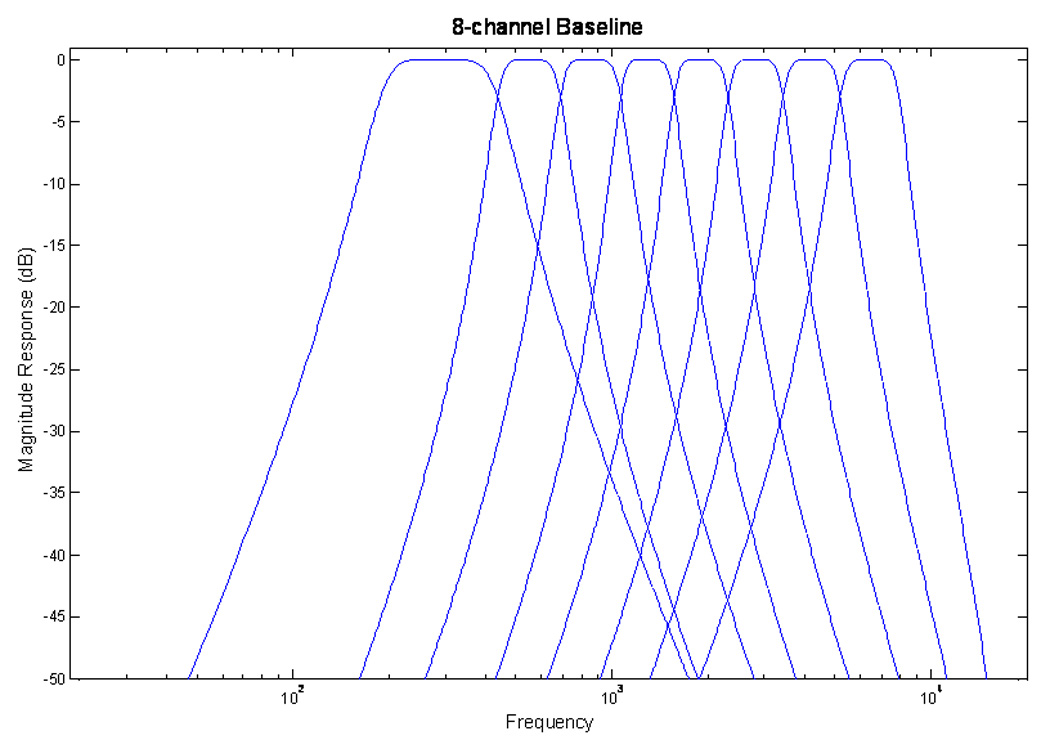
(a, b, c, d). Magnitude responses of the synthesis filters for the 8-channel vocoder with slopes of 3.33. 13.3, and 26.67 dB/mm (equivalent to current decay rate of 1, 4, and 8 dB/mm respectively) from top to bottom respectively. Bottom panel shows the filter used in the baseline condition.
The slopes of the synthesis filters (acoustic spectral decay) were computed by taking into account the difference in speech dynamic range between cochlear implant and normal-hearing listeners. On average, the electrical dynamic range (DRCI) is 15 dB and the acoustic (speech) dynamic range (DRNH) is 50 dB (Zeng et al., 2002). Hence, the slope of the synthesis filters was computed by multiplying the current decay rate (αc) by the ratio of the acoustic to electrical dynamic range:
| (1.1) |
where αS is the slope of the designed synthesis filters expressed in dB/mm. For current decay rates of 1, 4, or 8 dB/mm, the equivalent slopes of the synthesis filters were set to 3.3, 13.3 and 26.67 dB/mm respectively.
The bandwidth of the synthesis filter was not equal to the bandwidth of the analysis filters, but rather proportional to either the monopolar or bipolar current spread along the basilar membrane. The extent of spread along the basilar membrane (L) can be calculated by dividing the electrical dynamic range by the current decay rate:
| (1.2) |
where L is expressed in mm. According to Equation 1.2, for current decay rates of 1, 4 and 8 dB/mm and electrical dynamic range of 15 dB, the extent of excitation spread to either side of the active electrode is 15, 3.75 and 1.875 mm respectively. The Greenwood frequency-to-place function (Greenwood, 1990) was used to determine the range of frequencies encompassing the spread of excitation. Note that the overall spread of excitation depends largely on the basilar membrane location, i.e., on the characteristic frequency. For example, the overall spread of 3.75 mm at 625-Hz center frequency (characteristic frequency), extends from 313 Hz to 1148 Hz place in frequency. However, the same spread at a 3063-Hz center frequency extends from 1766 to 5241 Hz. In addition, the overall bandwidths (spread of excitation) are not the same because the frequency mapping along the basilar membrane is logarithmic. The synthesized filters with the specified magnitude were designed in MATLAB using the fir2 function (this function calculates the coefficients of a digital finite impulse response filter with frequency response magnitude that matches exactly the current spread envelope). The filter attenuation slopes in dB/octave were measured from Fig. 2a to be −14, −50, and −110 dB/octave for the current attenuations of −1, −4, and −8 dB/mm respectively.
The speech stimuli were processed offline in MATLAB through 4, 8, or 16 channels, each with synthesis filter slopes set at 3.33, 13.33, or 26.67 dB/mm. As an additional control condition, stimuli were processed also through the same number of channels and synthesis filters as those of the analysis filters (see Figure 2–Figure 3).
2.3. Procedure
The experiments were performed on a PC equipped with a Creative Labs SoundBlaster 16 soundcard. Stimuli were presented monaurally over Sony headphones with flat frequency response in the 18–22,000 Hz range and 98 dB/volt sensitivity. Subjects were asked to write down the words they heard. Performance per sentence was scored in terms of percent words correctly identified (all words were scored).
Testing was carried out in two different sessions (in different days): the HINT sentence tests (in quiet and in 10 dB SNR) in the first session and the CNC test in the second session. At the beginning of each test, the subjects had a practice session first with speech materials processed through the 16-channel condition, then through the 8- and the 4-channel conditions. The goal was to maximize practice listening to vocoded speech. Prior to the beginning of each test, subjects practiced with 15 sentences and 25 words for each channel condition. The sentences and words used in the practice session were not used in the test sessions. In the practice session, subjects were allowed to adjust the signal level to comfortable loudness. Following the practice session, the subjects were tested in the various experimental conditions.
Overall, the first 10 subjects were tested in a total of 12 conditions (= 4 different number of channels × 3 slopes) including the baseline condition in which the analysis and synthesis filters were the same. Twenty HINT sentences and 25 CNC words1 were used for each condition. The presentation order of the processed and control conditions was randomized for each subject. Seven subjects were tested in a total of 12 conditions (= 4 different number of channels × 3 slopes), and another group of six subjects was tested in the 3 baseline conditions (=3 different number of channels).
3. RESULTS
Mean recognition scores for HINT sentences and CNC words presented in quiet are shown in Figure 4. Mean recognition scores for HINT sentences presented in noise (10 dB SNR) are shown in Figure 5. The sentences were scored in terms of percent of words identified correctly (all words were scored). Two-way ANOVA (with repeated measures) performed on the sentence scores in quiet showed significant main effects of number of channels (F[2,18]=150.9, p< 0.0005), spread of excitation (F[2,18]=41.4, p< 0.0005), and significant interaction (F[4,36]=54.2, p< 0.0005). Two-way ANOVA (with repeated measures) performed on the word scores showed significant effects of number of channels (F[2,18]=365.2, p < 0.0005), spread of excitation (F[2,18]=81.6, p<0.0005), and significant interaction (F[4,36]=64.6, p<0.0005). Two-way ANOVA performed on the HINT sentence scores in noise showed significant effect of number of channels (F[2,12]=439.6, p<0.005), significant effect of spread of excitation (F[2,12]=27.4, p< 0.005) and a significant interaction (F[4,24]=31.8, p< 0.005).
Fig. 4.
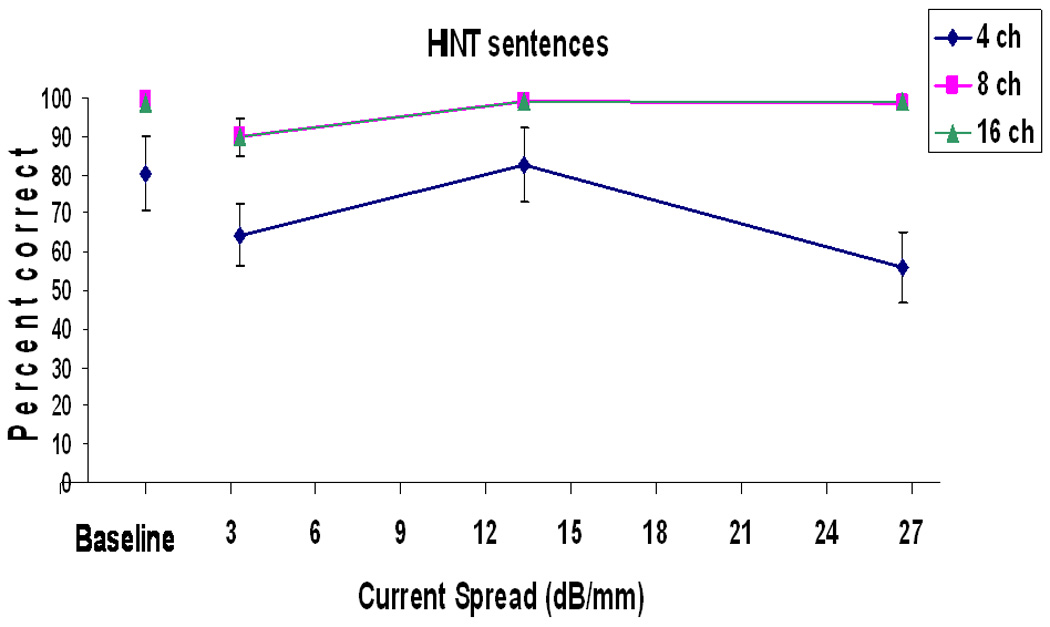
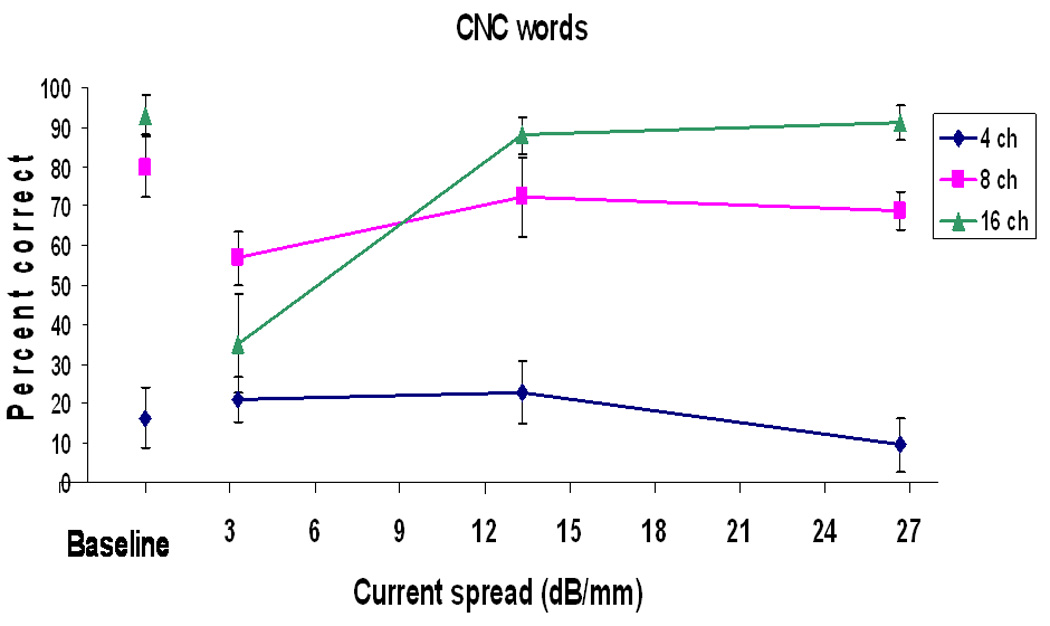
Mean percent scores on sentence recognition (top panel) and word recognition (bottom panel) as a function of simulated spread of excitation. Error bars indicate standard deviations. The baseline condition scores are shown also.
Fig. 5.
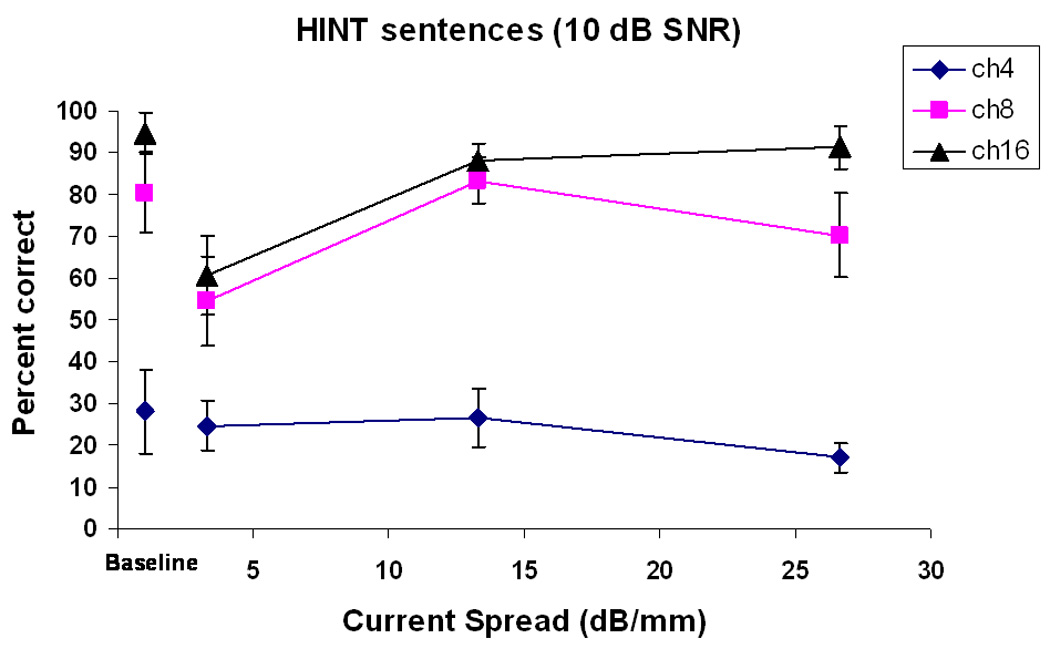
Mean percent scores on sentence recognition in noise (10 dB SNR) as a function of simulated spread of excitation. The baseline condition scores are shown also.
The results clearly show that performance depends both on the effective spectral resolution (number of channels) and spread of excitation. For sufficiently fine resolution (more than 8 channels), performance on sentence and word recognition in quiet seems to be relatively unaffected by spread of excitation, except in the extreme condition of 3 dB/mm current spread. Post-hoc tests (Fisher’s LSD) showed that the sentence recognition performance improved significantly (p < 0.05) for all number of channel conditions when the spread of excitation was reduced from 3 dB/mm to 13 dB/mm. Performance asymptoted at 13 dB/mm with 8 and 16 channels of stimulation. A similar pattern was observed in word recognition (middle panel in Fig 4) using 8 and 16 channels of stimulation. A slightly different picture emerged on sentence recognition in noise with 8 channels of stimulation: while performance improved with 8 channels of stimulation when the spread of excitation was reduced from 3 dB/mm to 13 dB/mm, performance degraded significantly (p< 0.05, Fisher’s LSD) when the spread of excitation was reduced to 26.6 dB/mm.
The overall pattern of performance changed when the spectral resolution was reduced to 4 channels. Sentence recognition performance in quiet reached a peak at 13 dB/mm, and declined significantly (p< 0.05, Fisher’s LSD) at 27 dB/mm. Sentence recognition performance in noise was the same at 3 dB/mm and 13 dB/mm, but declined significantly (p< 0.05, Fisher’s LSD) at 27 dB/mm. Similarly, word recognition performance was the same (p>0.05) at 3 dB/mm and 13 dB/mm, but declined significantly (p<0.05, Fisher’s LSD) at 27 dB/mm. These data suggest that performance is affected significantly by the spread of excitation when the spectral resolution is poor (4 channels in quiet and 8 channels in noise).
It is interesting to note that, in the baseline control condition (synthesis filters matched to the analysis filters), performance was comparable to that attained with the 13 dB/mm synthesis filters (see Figure 4). This was expected since in this condition the roll-off of the synthesis filters was comparable to that of the 13 dB/mm synthesis filters (see bottom panels in Figure 2 and Figure 3). Performance in the control conditions continued to improve as the number of channels increased. However, performance with the 13 dB/mm synthesis filters improved slightly as the number of channel increased beyond 8 channels, and deteriorated for the 3 dB/mm synthesis filters.
4. DISCUSSION
The present data revealed a significant interaction between spectral resolution (number of channels) and spread of excitation. Performance was worst with the broadest excitation spread (3 dB/mm), and the effect was most evident in the word- and the sentence-recognition task in noise. The poor performance obtained with broadest excitation spread can be explained on the basis of spectral smearing, which is known to have a deleterious effect on speech recognition (e.g., Keurs et al., 1992).
Reducing the spread of excitation had little effect on recognition of HINT sentences and CNC words in quiet, when the spectral resolution was adequate (> 8 channels). A comparatively larger effect was observed with recognition of sentences in noise (Fig 5). Performance in noise with 8 and 16 channels of stimulation improved by 30–35 percentage points, when the spread of excitation was reduced to 13.3 dB/mm. Reducing the spread of excitation further (26.6 dB/mm) produced no improvement in performance with 16 channels of stimulation. A small, but statistically significant (p<0.05), decrement in performance was observed when the spread of excitation was reduced to 26.6 dB/mm with 4 and 8-channels of stimulation. This outcome is partly consistent with CI behavioral data (Pfingst et al., 1997, 2001). In the study by Pfingst et al. (1997), Nucleus patients fitted with a wide bipolar configuration (BP+6; 5.25 mm separation), hence a wider excitation spread, exhibited better speech recognition than when fitted with a narrow bipolar configuration (BP; separation of 0.75 mm). The peak performance at 13.3 dB/mm for 4- and 8-channel vocoders and the performance drop at wider and narrower current spreads is in line with previous findings (Pfingst, 2001): the average CNC phoneme-recognition scores of six CI24 users were 20, 32, 25% for BP, BP+6, and MP2 electrode configurations, respectively. In terms of the present data, this would imply that the Nucleus patients were effectively utilizing a small number of channels of spectral information. Several studies (Fishman et al., 1997; Friesen et al., 2001) support this implication demonstrating that many CI users appear to effectively function with a small number (4–8) of channels of stimulation despite the considerably larger number (22) of electrodes available.
There are few plausible explanations for the decrement in performance observed with narrow spread of excitation when only a small number (4–8) of channels of stimulation is available. For one, fewer neuron populations are recruited and activated. As argued by Pfingst et al. (1997), when fewer neurons are activated more spikes per neuron would be required to reach the same loudness obtained with wider spread of excitation. This would then drive the neurons to rate saturation and reduce the amount of spatial detail in the neural activity pattern. The condition having four narrow bands of information might be viewed as analogous to listening to a coarse but “discrete” spectrum. Such an impoverished spectral representation would arguably make it extremely difficult for listeners to “fill in” the spectral gaps and extract say formant frequency information or any other useful information from the spectral envelope. In contrast, a wider spread of excitation would somehow fill up the spectral gap to some degree, and make it easier for listeners to “interpolate” in between the four narrow bands of spectral information.
For the sentence-recognition test in noise (HINT), speech intelligibility improved slightly as the number of channels (spectral resolution) increased to 16 (for the same spread of excitation) and remained relatively unaffected by the reduced spread of excitation. This suggests that with narrow spread of excitation, it is possible to improve speech intelligibility by increasing the number of channels. This finding is in agreement with the conclusions of Fu and Nogaki (2004); in their study, cochlear implant users and normal hearing (NH) subjects were asked to recognize sentences in modulated noise. In the acoustic simulations, NH listeners were tested with different degrees of spectral resolution (4–16 channels) and spectral smearing (carrier filter slopes of −24 or −6 dB/octave). With little spectral smearing (−24 dB/octave), NH subjects were able to obtain significant release from masking, even when the spectral resolution was severely reduced. In contrast, when the carrier bands were smeared to simulate channel interaction (−6 dB/octave), NH listeners exhibited no significant release from masking, even when the spectral resolution was moderately high (eight channels). Overall, with severely smeared bands (−6 dB/octave), the improvement in performance obtained when the spectral resolution increased from 4 to 16 channels was small compared to the condition in which the carrier bands were not severely smeared (−24 dB/octave). That is, performance improved the most when the number of channels increased from 4 to 16 and the carrier bands were not severely smeared (−24 dB/octave). This outcome is consistent with our data in noise (Fig. 5). With wide spread of excitation (3 dB/mm), performance improved by 30 percentage points when the number of channels increased from 4 to 8, but with narrow spread of excitation (13 dB/mm) performance improved by nearly 60 percentage points. Overall, the data in the present study support the conclusions by Fu and Nogaki (2004) that improving the effective number of spectral channels as well as reducing channel interactions may improve implant users’ performance in noise.
The present current-spread vocoder simulations predict cochlear-implant performance more accurately than the conventional vocoder simulations. In agreement with actual performance of cochlear implant users, speech intelligibility is lower with current-spread vocoder simulations than with the conventional vocoder simulations, and smaller improvements are observed with an increase in number of channels from 8 to 16.
5. CONCLUSIONS
The present paper proposed an acoustic simulation vocoder which can be used to model the spread of excitation in the cochlea. The data confirmed a significant interaction between spectral resolution and spread of excitation. A narrow spread of excitation beyond 13.3 dB/mm had little effect on sentence and word recognition in quiet when the spectral resolution was adequate (> 8 channels) but had a significant effect when the spectral resolution was poor. A significant decrement in performance was observed for extremely narrow excitation patterns with 4-channels of stimulation in quiet and 8-channels in noise. The 8- and 4-channel outcomes are consistent with that obtained in cochlear-implant studies in that CI users tend to do as well as or better with (and often prefer) monopolar stimulation. In addition, the present data showed that recognition of sentences in noise may improve as the spread of excitation is narrowed and the spectral resolution is improved to 8–16 channels.
ACKNOWLEDGMENTS
The research was supported by Oklahoma IDeA Network of Biomedical Research Excellence (INBRE) and in part by Grant No. R01 DC007527 (awarded to PCL) from the National Institute of Deafness and other Communication Disorders, NIH. We thank Dr. Kent Hawkins and Justin Wilson for helping with the subject testing.
Footnotes
The fact that we used 25 words (rather than 50 words) for each condition limits admittedly the interpretation of significant changes in test scores and lowers the statistical power of the tests. Nevertheless, the overall pattern in performance with the CNC word test was very similar to that observed with the HINT sentence test in noise.
Publisher's Disclaimer: This is a PDF file of an unedited manuscript that has been accepted for publication. As a service to our customers we are providing this early version of the manuscript. The manuscript will undergo copyediting, typesetting, and review of the resulting proof before it is published in its final citable form. Please note that during the production process errors may be discovered which could affect the content, and all legal disclaimers that apply to the journal pertain.
REFERENCES
- Bierer J, Middlebrooks J. Auditory Cortical Images of Cochlear-Implant Stimuli: Dependence on Electrode Configuration. J. Neurophysiol. 2002;87:478–492. doi: 10.1152/jn.00212.2001. [DOI] [PubMed] [Google Scholar]
- Boëx C, de Balthasar C, Maria-Izabel K, Pelizzone M. Electrical filed interactions in different cochlear implant systems. J. Acoust. Soc. Am. 2003;114(4):2049–2057. doi: 10.1121/1.1610451. [DOI] [PubMed] [Google Scholar]
- Briare JJ, Frjins JHM. Field patterns in a 3D tapered spiral model of the electrically stimulated cochlea. Hear. Res. 2000;148:18–30. doi: 10.1016/s0378-5955(00)00104-0. [DOI] [PubMed] [Google Scholar]
- Chatterjee M. Effects of stimulation mode on threshold and loudness growth in multielectrode cochlear implants. J Acoust Soc Am. 1999;105:850–860. doi: 10.1121/1.426274. [DOI] [PubMed] [Google Scholar]
- Dingemanse J, Frijns J, Briaire J. Psychophysical Assessment of spatial spread of excitation in electrical hearing with single and dual electrode contact maskers. Ear & Hearing. 2006:645–657. doi: 10.1097/01.aud.0000246683.29611.1b. [DOI] [PubMed] [Google Scholar]
- Dorman M, Loizou P. Speech intelligibility as a function of the number of channels of stimulation for normal-hearing listeners and patients with cochlear implants. The American Journal of Otology. 1997;18:S113–S114. [PubMed] [Google Scholar]
- Fishman K, Shannon R, Slattery W. Speech recognition as a function of the number of electrodes used in the SPEAK cochlear implant processor. J Speech Hear Res. 1997;40:1201–1215. doi: 10.1044/jslhr.4005.1201. [DOI] [PubMed] [Google Scholar]
- Friesen LM, Shannon RV, Baskent D, Wang X. Speech recognition in noise as a function of the number of spectral channels: comparison of acoustic hearing and cochlear implants. J. Acoust. Soc. Am. 2001;110(2):1150–1163. doi: 10.1121/1.1381538. [DOI] [PubMed] [Google Scholar]
- Fu Q, Shannon R. Frequency mapping in cochlear implants. Ear Hear. 2002;23:339–348. doi: 10.1097/00003446-200208000-00009. [DOI] [PubMed] [Google Scholar]
- Fu Q, Nogaki G. Noise Susceptibility of Cochlear Implant Users: The Role of Spectral Resolution and Smearing. JARO. 2004;6:19–27. doi: 10.1007/s10162-004-5024-3. [DOI] [PMC free article] [PubMed] [Google Scholar]
- Greenwood D. A cochlear frequency-position function for several species—29 years later. J. Acoust. Soc. Am. 1990;87:2592–2605. doi: 10.1121/1.399052. [DOI] [PubMed] [Google Scholar]
- Hartmann R, Klinke R. Impulse patterns of auditory nerve fibres to extra and intracochlear electrical stimulation. Acta Oto-Laryngol. 1990;469 Suppl.:128–134. [PubMed] [Google Scholar]
- Jolly CN, Spelman FA, Clopton BM. Quadrupolar stimulation for cochlear prostheses: Modeling and experimental data. IEEE Trans. Biomed. Eng. 1996;43:857–865. doi: 10.1109/10.508549. [DOI] [PubMed] [Google Scholar]
- Keurs M, Festen J, Plomp R. Effect of spectral envelope smearing on speech reception: I. J. Acoust Soc. Am. 1992;91(5):2872–2880. doi: 10.1121/1.402950. [DOI] [PubMed] [Google Scholar]
- Kral A, Hartmann R, Mortazavi D, Klinke R. Spatial resolution of cochlear implants: the electrical field and excitation of auditory afferents. Hear. Res. 1998;121:11–28. doi: 10.1016/s0378-5955(98)00061-6. [DOI] [PubMed] [Google Scholar]
- Kwon B, van den Honert C. Effect of electrode configuration on psychophysical forward masking in cochlear implant listeners. J. Acoust. Soc. Am. 2006;119(5):2994–3002. doi: 10.1121/1.2184128. [DOI] [PubMed] [Google Scholar]
- Lehnhardt E, Gnadeberg D, Battmer RD, von Wallenberg EL. Evaluation of different coding strategies and stimulation modes for the Nucleus multichannel cochlear implant. In: Yanagihara N, Suzuki J, editors. Transplants and Implants in Otology. New York: Kugler; 1992. pp. 283–290. [Google Scholar]
- Nelson D, Donaldson G, Kreft H. Forward-masked spatial tuning curves in cochlear implant users. J. Acoust. Soc. Am. 2008;123:1522–1543. doi: 10.1121/1.2836786. [DOI] [PMC free article] [PubMed] [Google Scholar]
- Nilsson M, Soli S, Sullivan J. Development of the Hearing in Noise Test for the measurement of speech reception thresholds in quiet and in noise. J. Acoust. Soc. Am. 1994;95:1085–1099. doi: 10.1121/1.408469. [DOI] [PubMed] [Google Scholar]
- Morris DJ, Pfingst BE. Effects of electrode configuration and stimulus level on rate and level discrimination with cochlear implants. JARO. 2001;1:211–223. doi: 10.1007/s101620010022. [DOI] [PMC free article] [PubMed] [Google Scholar]
- O'Leary S, Black R, Clard G. Current distributions in the cat cochlea. Hear. Res. 1985;18:273–281. doi: 10.1016/0378-5955(85)90044-9. [DOI] [PubMed] [Google Scholar]
- Peterson GE, Lehiste I. Revised CNC lists for auditory tests. Journal of Speech and Hearing Disorders. 1962;27:62–70. doi: 10.1044/jshd.2701.62. [DOI] [PubMed] [Google Scholar]
- Pfingst BE, Zwolan TA, Holloway LA. Effects of stimulus configuration on psychophysical operating levels and on speech recognition with cochlear implants. Hearing Res. 1997;112:247–260. doi: 10.1016/s0378-5955(97)00122-6. [DOI] [PubMed] [Google Scholar]
- Pfingst B, Franck K, Xu L, Bauer E, Zwolan T. Effects of Electrode Configuration and Place of Stimulation on Speech Perception with Cochlear Prostheses. J. Assoc. Res. Otol. 2001;2:87–103. doi: 10.1007/s101620010065. [DOI] [PMC free article] [PubMed] [Google Scholar]
- Raggio MW, Schreiner CE. Neuronal responses in cat primary auditory cortex to electrical cochlear stimulation. IV. Activation pattern for sinusoidal stimulation. J. Neurophysiol. 2003;89:3190–3204. doi: 10.1152/jn.00341.2002. [DOI] [PubMed] [Google Scholar]
- Rebscher SJ, Snyder RL, Leake PA. The effect of electrode configuration and duration of deafness on threshold and selectivity of responses to intracochlear electrical stimulation. J. Acoust. Soc. Am. 2001;109(5 Pt 1):2035–2048. doi: 10.1121/1.1365115. [DOI] [PubMed] [Google Scholar]
- Shannon RV, Zeng FG, Wygonski J. Speech recognition with altered spectral distribution of envelope cues. J. Acoust. Soc. Am. 1998;104:2467–2476. doi: 10.1121/1.423774. [DOI] [PubMed] [Google Scholar]
- Snyder RL, Bierer JA, Middlebrooks JC. Patterns of inferior colliculus activity in response to acoustic and electric intracochlear electrical stimulation: Activation selectivity. J. Assoc. Res. Otolaryngol. 2004;5:305–322. doi: 10.1007/s10162-004-4026-5. [DOI] [PMC free article] [PubMed] [Google Scholar]
- Spelman FA, Pfingst BE, Clopton BM, Jolly CN, Rodenhiser KL. Effects of electrical current configuration on potential fields in the electrically stimulated cochlea: Field models and measurements. Ann. Otol. Rhinol. Laryngol. 1995;166 Suppl.:131–136. [PubMed] [Google Scholar]
- Stickney G, Loizou P, Mishra L, Assmann P, Shannon R, Opie J. Effects of electrode design and configuration on channel interactions. Hearing Research. 2006;211:33–45. doi: 10.1016/j.heares.2005.08.008. [DOI] [PubMed] [Google Scholar]
- van den Honert C, Stypulkowski PH. Single fiber mapping of spatial excitation patterns in the electrically stimulated auditory nerve. Hearing Res. 1987;29:195–206. doi: 10.1016/0378-5955(87)90167-5. [DOI] [PubMed] [Google Scholar]
- Zeng F, Grant G, Niparko J, Galvin J, Shannon R, Opie J, Segel P. Speech dynamic range and its effect on cochlear implant performance. J. Acoust. Soc. Am. 2002;111:377–386. doi: 10.1121/1.1423926. [DOI] [PubMed] [Google Scholar]
- Zwolan TA, Kileny PR, Ashbaugh C, Telian SA. Patient performance with the Cochlear Corporation '20+2' implant: Bipolar versus monopolar activation. Am. J. Otol. 1996;17:717–723. [PubMed] [Google Scholar]


