

Abstract
Quercetin, a polyphenolic compound and a major bioflavonoid in the human diet, has anti-inflammatory properties and has been postulated to enhance energy expenditure (EE). We sought to determine whether quercetin alters body weight, body composition, EE, and circulating markers of inflammation. At 6 weeks (W) of age, 2 cohorts of C57BL/6J mice (N = 80) were placed on one of 2 diets for 3W or 8W: (1) high fat (HF) (45% kcal fat) or (2) high fat + quercetin (HF + Q) (45% kcal fat + 0.8% quercetin). Quercetin concentrations in the diet and plasma were evaluated using mass spectrometry. Body weight, composition (nuclear magnetic resonance), and food consumption were measured weekly. Energy expenditure was measured by indirect calorimetry at 3 and 8W, and inflammatory markers were measured in plasma obtained at 8W. The presence of quercetin in the HF diet did not alter food consumption over time in the HF + Q group and did not differ from the HF group at any time point. However, circulating plasma quercetin concentrations declined between 3 and 8W. At 3W, EE was higher during both day and night phases (P < .0001) in the HF + Q group compared with the HF group; but this difference was not detected at 8W and did not translate into significant differences between the HF + Q and HF groups with respect to body weight or body composition. During the night phase, concentrations of the inflammatory markers (interferon-γ, interleukin-1α, and interleukin-4) were significantly lower when compared with HF treatment group (P < .05). Dietary supplementation with quercetin produces transient (3W) increases in EE that are not detected after 8W on the diet. A corresponding decrease in circulating quercetin between 3 and 8W suggests that metabolic adaptation may have diminished the impact of quercetin's early effect on EE and diminished its overall effect on nutrient partitioning and adiposity. However, quercetin at the levels provided was effective in reducing circulating markers of inflammation observed in animals on an HF diet at 8W.
1. Introduction
It is estimated that more than 1 billion adults worldwide are overweight, and at least 300 million are considered obese. Major contributors to this epidemic across the world are secondary to sedentary lifestyles; consumption of high-fat, caloric-dense diets; and increased urbanization. Obesity predisposes one to development of type 2 diabetes mellitus and cardiovascular disease, and has also been considered a low-grade inflammatory disease [1]. Importantly, it has been well established that a reduction in body weight in the range of 5% to 10% can significantly slow the progression of these conditions [2]. Thus, although it is well established that caloric restriction and exercise greatly improve insulin resistance, the success of lifestyle intervention in long-term maintenance of weight loss is poor. Therefore, strategies to decrease weight by pharmacologic or nutritional supplementation represent a very attractive approach; and the flavonoids have been advanced as a potential botanical component of an effective obesity treatment regimen [3].
Quercetin (3,3′,4′,5,7-pentahydroxyflavone) is a polyphenolic compound in the flavonol subgroup of flavonoids [4]. Although quercetin is the major bioflavonoid in the human diet [5], US consumption of dietary quercetin is only about 30 mg/d [6]. High concentrations are found in apples, tea, onions, and red wine [7]. Although absorption of quercetin occurs within 30 minutes of ingestion [8], tissue distribution of quercetin requires further evaluation.
The flavonols and quercetin have been proposed to increase cellular energy expenditure (EE) by elevating oxygen consumption in human skeletal myocytes. The mechanism is thought to involve up-regulation of type 2 deiodinase expression, which has been shown to increase EE [9] by increasing formation of triiodothyronine [10]. Although these data are promising, rigorous evaluation of well-characterized compounds in physiological models is needed to provide more convincing results. Specifically, a common problem with many of the studies evaluating quercetin is imprecise information regarding the amount of compound actually provided, leaving significant uncertainty as to the effective dose of quercetin required to achieve the desired response [11].
Many studies report that quercetin has potent anti-inflammatory properties [12]. Although the underlying mechanisms for this response are unclear, it has been suggested that quercetin's anti-inflammatory properties may be due to its ability to decrease production of inflammatory cytokines [13]. Given the potential of quercetin to increase EE and mediate anti-inflammatory activities, the present study was designed to provide a comprehensive phenotypic evaluation of the therapeutic responses to a defined dose provided as a food admixture in the well-characterized C57BL/6J model of diet-induced obesity.
2. Methods
2.1. Animals
Male C57BL/6J mice (N = 80) (Jackson Laboratory, Bar Harbor, ME) were weaned onto a low-fat diet (10% kcal fat; Research Diets, New Brunswick, NJ) and, at 6 weeks (W) of age, were randomized and given free access to either high-fat diet (HF, 45% kcal fat, D12451) or high-fat diet formulated to contain 1.2% quercetin (HF + Q, D06081502) (Table 1). Energy expenditure was measured in one cohort (n = 8 per treatment) at 3 and 8W. Food consumption and body composition were measured in 2 cohorts (n = 8 per treatment per cohort) of mice that were killed at the zenith (midnight) or nadir (noon) of the metabolic cycle at the 3 and 8W time points. All mice were singly housed in shoebox cages with corncob bedding in controlled environmental conditions (22°C) on a 12-hour light/dark cycle. All experiments were reviewed and approved by the Pennington Biomedical Research Center Institutional Animal Care and Use Committee.
Table 1.
Diet composition
| Macronutrient/ingredient |
HF diet (D12451) |
HF + Q (D06081502) |
||
|---|---|---|---|---|
| Macronutrient | g % | kcal % | g % | kcal % |
| Protein | 23.7 | 20 | 23.4 | 20 |
| Carbohydrate | 41.4 | 35 | 40.9 | 35 |
| Fat | 23.6 | 45 | 23.3 | 45 |
| Total | 88.7 | 100 | 87.6 | 100 |
| kcal/g | 4.73 | 4.67 | ||
| Ingredient | g | kcal | g | kcal |
| Casein, 80 mash | 200 | 800 | 200 | 800 |
| l-Cystine | 3 | 12 | 3 | 12 |
| Cornstarch | 72.8 | 291 | 72.8 | 291 |
| Maltodextrin 10 | 100 | 400 | 100 | 400 |
| Sucrose | 172.8 | 691 | 172.8 | 691 |
| Cellulose, BW200 | 50 | 0 | 50 | 0 |
| Soybean oil | 25 | 225 | 25 | 225 |
| Lard | 177.5 | 1598 | 177.5 | 1598 |
| Mineral mix S10026 | 10 | 0 | 10 | 0 |
| Dicalcium phosphate | 13 | 0 | 13 | 0 |
| Calcium carbonate | 5.5 | 0 | 5.5 | 0 |
| Potassium citrate, 1 H20 | 16.5 | 0 | 16.5 | 0 |
| Vitamin mix V10001 | 10 | 40 | 10 | 40 |
| Choline bitartrate | 2 | 0 | 2 | 0 |
| Quercetin | 0 | 0 | 10.43 | 0 |
| FD&C yellow dye 5 | 0 | 0 | 0 | 0 |
| FD&C red dye 40 | 0.05 | 0 | 0 | 0 |
| FD&C blue dye 1 | 0 | 0 | 0.05 | 0 |
| Total | 858.2 | 4057 | 868.6 | 4057 |
FD&C indicates foods, drugs and cosmetics.
2.2. Diets and food consumption
Research Diets formulated the HF + Q diet by cold processing to contain 1.2% (wt/wt) quercetin (Sigma Aldrich, St Louis, MO; ≥98% purity by high-performance liquid chromatography [LC], Q0125). To establish final quercetin concentration in the diet and assess its stability during storage, the HF + Q diet was evaluated using mass spectrometry (MS) at the beginning and end of the study. All diets were stored at 4°C in light-protected, airtight containers; and food was changed every 3 days. Water was provided ad libitum. Food consumption was measured as the difference between food provided and the sum of remaining and wasted food during a 48-hour period each week.
2.3. Quercetin diet and plasma analysis
Quercetin concentration and stability in the HF + Q diet were analyzed using MS at the beginning of the study and in a sample that was stored for 8W in the conditions described above. Briefly, 1-g samples of murine high-fat diet formulated with quercetin were powdered with a mortar and pestle and extracted with 5 mL of 95% ethanol. One-gram samples of murine high-fat diet without quercetin were spiked with 12 mg of quercetin and processed simultaneously. The solids were removed by centrifugation. The extract was dried with a SpeedVac (Thermo Scientific, Waltham, MA), resuspended in 1 mL of water, and partitioned 3 times with 1 mL of hexane. The water was then partitioned 3 times with 1 mL of ethyl acetate, dried, and resuspended in 500 μL ethanol for LC/MS analysis as described below.
Frozen blood plasma (200 μL) samples were thawed and immediately diluted with 200 μL water and 500 μL of 100 mmol/L sodium acetate buffer with a pH 5. β-Glucuronidase type HP-2 (20 014 U, Sigma) was then added, briefly vortexed, and incubated at 37°C for 30 minutes. After incubation, the samples were transferred to glass tubes with 1 mL of water and partitioned once with hexanes (2 mL) to defat. The samples were vortexed and sonicated at 50°C for 15 minutes and centrifuged at 5000 rpm for 6 minutes. The hexane fraction was then removed and discarded. The samples were then partitioned 3 times with 2 mL of ethyl acetate. The samples were then vortexed and placed back into the sonicator for 15 minutes at 50°C. The samples were then placed in the centrifuge and spun at the same speed and time. The ethyl acetate partitions were dried in a SpeedVac and resuspended in 125 μL of 95% ethanol in a sonicator at 50°C for 10 minutes. After centrifugation, the samples were analyzed with an LC/MS system as previously described [14].
2.4. Body weight and composition
Body weight and composition (nuclear magnetic resonance [NMR]; Bruker Minispec, Billerica, MA) were measured on a weekly basis in 2 cohorts of mice per treatment group (n = 8 mice per treatment per time point) for the duration of the study. Body composition was measured using a mouse NMR (Bruker Minispec) on a weekly basis. Fat mass (FM) was subtracted from total body weight to determine the fat-free mass (FFM). Percentage fat and percentage FFM were calculated by dividing FM or FFM by total body weight and multiplying by 100.
2.5. Energy expenditure
Body weight and body composition (mouse NMR, Bruker Minispec) were evaluated in a separate cohort (n = 8 mice per treatment per time point) and animals that were singly housed and given free access to their prescribed diet (specified above) and water in the metabolic chambers. After an overnight acclimation to the chambers, the volume of oxygen consumption (VO2) and the CO2 production were measured for 72 hours using indirect calorimetry and used to calculate respiratory exchange ratios (RERs) for each recording interval. Recording intervals were 60 seconds in duration, and one reading was completed on all animals every 45 minutes. Energy expenditure was calculated using VO2 and RER (VO2 × [3.815 + (1.23 × RER)] × 40.1868) and expressed as kilojoules per kilogram FFM per hour (Flowmax; Columbus Instruments, Columbus, OH).
2.6. Circulating inflammatory markers
The EDTA-treated blood samples were obtained by cardiac puncture from mice at the zenith and nadir of the metabolic cycle (n = 8 mice per treatment) at 8W. Circulating concentrations of inflammatory markers were measured in duplicate with 25 μL of plasma using an 8-plex (interleukin [IL] 1β, monocyte chemoattractant protein [MCP] 1, tumor necrosis factor [TNF] α, IL-1β, IL-2, IL-4, IL-10, and interferon [IFN] γ) Linco Research (St Charles, MO) murine multiplex kit on a Luminex 100 (Austin, TX) platform.
2.7. Statistical analysis
The data were analyzed with JMP statistical analysis software (SAS, Cary, NC), and results were expressed as means ± standard error. All measurements were evaluated using a 1-way analysis of variance (ANOVA) designed to examine the differences between the groups (HF and HF + Q) at the 3 and 8W time points, respectively. A Dunnett's test was used post hoc as necessary. A P value < .05 was used to assess significance.
3. Results
3.1. Quercetin concentration and stability in the diet
Using MS, quercetin was not detected in the high-fat diet formulated without quercetin. In the high-fat diet formulated with quercetin, 67% of the 12 g/kg (1.2%) initially added to the diet was recovered by MS, resulting in an actual final concentration of 0.80 g quercetin per kilogram diet. Quercetin was also measured in samples of the HF + Q diet held in the diet storage area for the duration of the study. The quercetin concentration measured in these samples was 0.79%, which corresponds to a 1% decrease in quercetin during the 8W of storage.
3.2. Circulating quercetin concentration and food consumption
Because quercetin was administered as a food admixture and mice have a diurnal pattern of food consumption, quercetin was measured in blood samples taken in the middle of their nighttime and daytime cycles after 3 and 8W. Mice are nocturnal feeders and consume most of their 24-hour food consumption at night when they are awake. As expected, plasma quercetin concentration was higher in nighttime blood samples vs daytime blood samples at both 3 and 8W (Fig. 1). Plasma quercetin was 1.5-fold higher in samples taken at night vs those taken during the day at the 3W time point and 2-fold higher after 8W. If we take plasma quercetin averaged over night and day as a measure of overall treatment with quercetin, total plasma quercetin decreased by ∼80% between 3 and 8W (Fig. 1). This observation indicates a significant decrease in effective dosing of the mice with quercetin between 3 and 8W, and examination of food consumption between the groups during this period provides no evidence for a decrease in consumption of the HF + Q diet as a basis for the decrease in circulating quercetin (Fig. 2). Food consumption over the 8W study averaged 23.41 ± 0.09 kcal/48 h (HF + Q) and 24.05 ± 0.12 kcal/48 h (HF) in the respective groups, and there was no evidence that food consumption changed over time in either group (Fig. 2). Collectively, these results show that the decrease in circulating quercetin in the HF + Q group between 3 and 8W is not due to a decrease in the consumption of the diet or a decrease in the stability of quercetin in the diet. These results are consistent with a change in quercetin pharmacokinetics between 3 and 8W, although the nature of the change remains to be established.
Fig. 1.
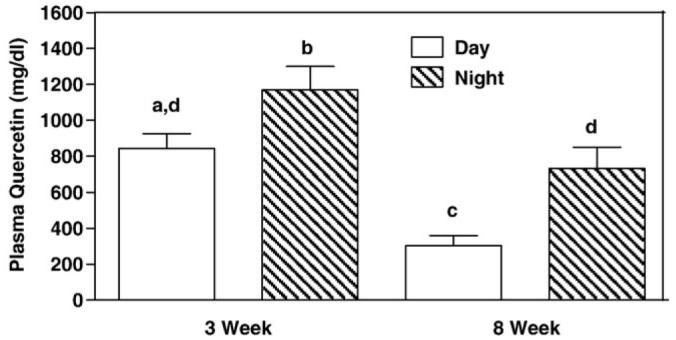
Plasma quercetin concentration in samples taken from mice at the zenith (1:00 am, night) and nadir (1 pm, day) of the metabolic cycle after consuming a high-fat diet (45 kcal%) containing 0.80% quercetin for 3W or 8W. Quercetin was measured by MS as described in Methods. Means were calculated from 3 to 4 mice sampled at each time of day and time on diet and compared by ANOVA. Means with different letters differ at P < .05.
Fig. 2.
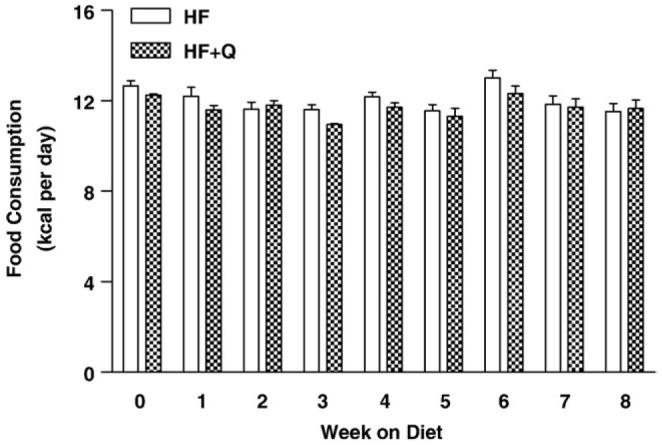
Change in food consumption (kilocalories per day) over time in mice provided high-fat diets (45 kcal %) containing either vehicle (HF) or 0.8% quercetin (HF + Q). Food consumption, accounting for spillage, was measured over a 2-day period each week for 32 mice per diet from 0 to 3W and 16 mice per diet from 4 to 8W. Means were compared by 2-way ANOVA as described in Methods to test for diet-dependent differences in food consumption each week. Mean food consumption did not differ between the diets at any week during the study.
3.3. Change in body weight and composition over time
Mean body weights did not differ between the groups at the beginning, end, or at any week during the course of the study. The mice in both groups gained an average of 9 g of body weight during the 8W study (Fig. 3), and there was no evidence that the composition of the added weight differed between the groups (Fig. 4). For example, Fig. 4 shows that the relative adiposity (grams fat per gram body weight × 100) of mice in both groups was ∼10% at the beginning of the study and ∼20% at the end of the study. Adiposity did not differ between the groups at either of these time points or at any time point between (Fig. 4). Given that food consumption also did not differ between the groups at any point, the results show collectively that quercetin altered neither postweaning growth nor the composition of that growth in C57BL/6J mice weaned onto a high-fat diet.
Fig. 3.
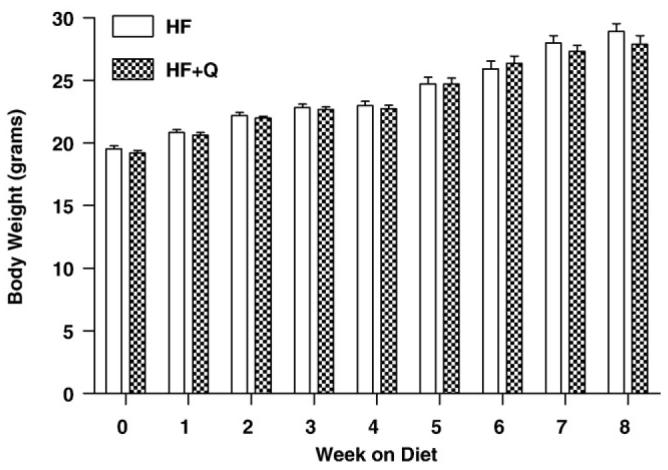
Change in body weight over time in mice provided high-fat diets (45 kcal%) containing either vehicle (HF) or 0.8% quercetin (HF + Q). Means were compared by 2-way ANOVA as described in Methods to test for diet-dependent differences in body weight each week. Mean body weight did not differ between the groups at any week during the study.
Fig. 4.
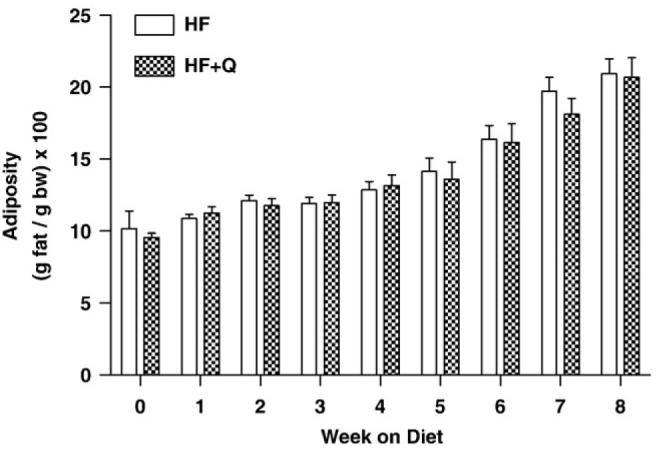
Change in FM as a percentage of body weight over time in mice provided high-fat diets (45 kcal %) containing either vehicle (HF) or 0.8% quercetin (HF + Q). Body composition was determined each week by NMR as described in Methods, and FM was expressed as a percentage of body weight to measure relative adiposity. Means were compared by 2-way ANOVA to test for diet-dependent differences in adiposity at each week. Mean adiposity did not differ between the 2 groups at any week during the study.
3.4. Energy expenditure
Oxygen consumption and CO2 production were measured by indirect calorimetry after 3 and 8W on the respective diets to test whether quercetin altered EE or respiratory quotient (RQ) in this study. Total EE expressed relative to lean mass was significantly elevated in the HF + Q group compared with the HF group at the 3W (P < .0001) but not at the 8W time point (Fig. 5A, B). The increase in EE detected at the 3W time point was evident not only in comparisons made during the day (P < .001), when mice normally sleep, but also in nighttime comparisons, when mice are awake, physically active, and consuming food (P < .001). This outcome is indicative of an overall increase in metabolic rate rather than an exaggerated thermogenic response to food. Furthermore, when physical activity was assessed by interruption of infrared beams, no evidence was found to support differences in voluntary activity as a basis for increased EE during the day (HF mean: 2234.72 ± 237.72 beam breaks; HF + Q mean: 2415.61 ± 207.03 beam breaks; P = .57) or night (HF mean: 24875.6 ± 1648.8 beam breaks; HF + Q mean: 22656.2 ± 1556.6 beam breaks; P = .5699, P = .34). Thus, at 3W, there was an increase in EE in HF + Q animals, but no change in food intake, voluntary activity, weight, body composition, or substrate selection. Examination of EE after 8W on the respective diets found no evidence of increased EE in the HF + Q group during the day or night, indicating that the early effect of quercetin at 3W did not persist for 8W (Fig. 5B).
Fig. 5.
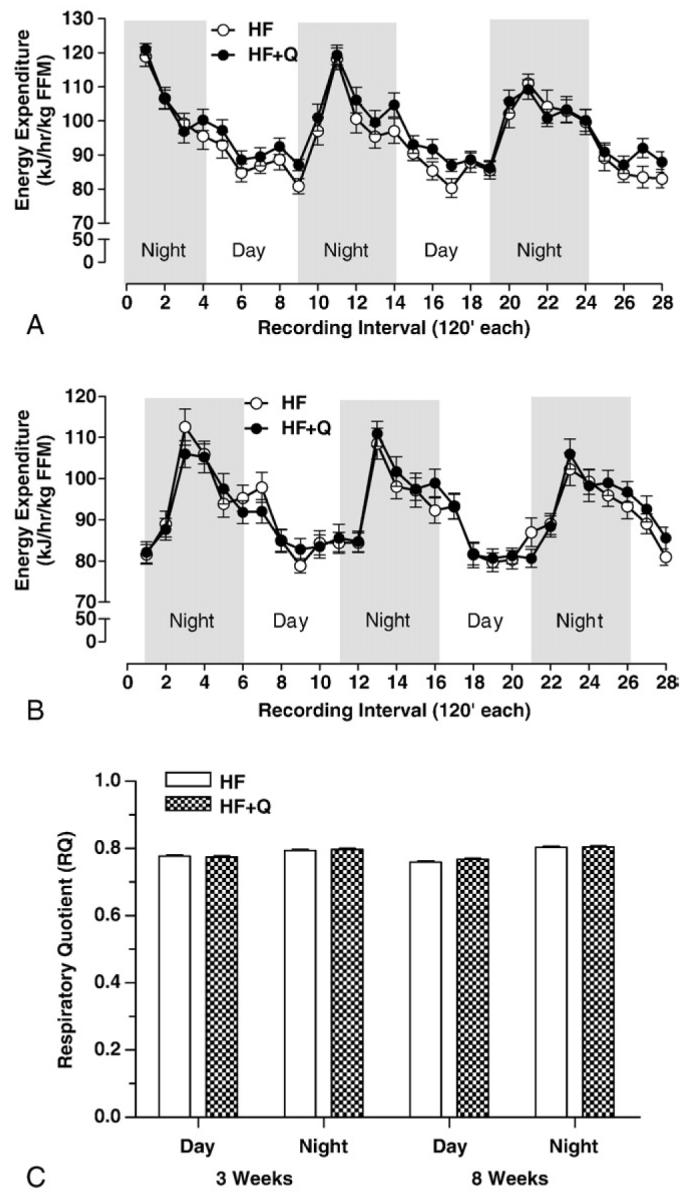
Energy expenditure (kilojoules per hour per FFM) was measured by indirect calorimetry in mice after 3W (A) or 8W (B) on the respective HF (n = 8) or HF + Q (n = 8) diets. Mean EEs during the night and day intervals were compared between diets at 3 and 8W using 2-way ANOVA as described in Methods. Mean EE during the night at 3W and during the day and night at 8W did not differ between dietary groups, but mean EE during the day at 3W was significantly higher (P < .05) in the HF + Q compared with the HF group. (C) Oxygen consumption and CO2 production were measured continuously at 45-minute intervals for 3 days by indirect calorimetry in mice after 3 and 8W on the respective HF (n = 8) or HF + Q (n = 8) diets. Respiratory quotients were calculated as the ratio of CO2 produced vs O2 consumed, and mean RQs were obtained from the measurements taken between 7:00 pm and 7:00 am (night) and between 7:00 am and 7:00 pm (day). Mean day and night RQs determined after 3 and 8W on the respective diets were compared using 2-way ANOVA as described in Methods. Mean RQs did not differ between diets and between time of day, and no time of day × diet interaction was detected.
Respiratory exchange ratio is an indicator of the composition of metabolic fuels being oxidized at any point in time, with RERs near 1 indicative of a sole reliance on carbohydrate as a fuel source and RERs near 0.7 indicative of fat as a fuel source. The RERs calculated from the respective groups provide no evidence to suggest that quercetin altered substrate selection at 3W (Fig. 5C), when EE differed between the groups (Fig. 5A), or at 8W (Fig. 5C), when no effect of quercetin on EE was evident (Fig. 5B). Collectively, these findings show that quercetin increased EE without altering substrate selection at 3W, but the effect on EE was no longer evident at 8W. Although the connection remains to be established, this loss of effect coincides with the significant decrease in circulating quercetin between 3 and 8W (Fig. 1).
3.5. Circulating markers of inflammation
Differences in inflammatory protein levels between the treatment groups were most significant during the night phase (Fig. 6) at 8W. More specifically, the HF + Q group was lower in INF-γ (P = .05), IL-1α (P = .0285), and IL-4 (P = .0464) (Fig. 6). At 8W, during the day, INF-γ trended to be lower in the HF + Q compared with the HF (P = .08) group. Interleukin 2 (P = .0250), MCP-1 (P = .0480), and TNF-α (P = .0195) at night were significantly higher compared with those during the day in the HF group.
Fig. 6.
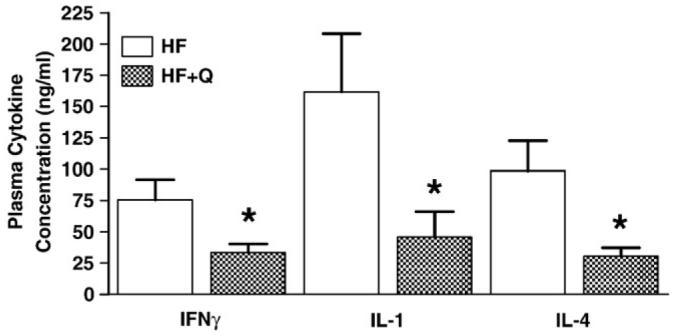
Plasma cytokine concentrations in mice after 8W on the respective HF (n = 6) or HF + Q (n = 6) diets. Mean plasma concentrations of each cytokine were compared between diets using 1-way ANOVA as described in Methods. Means denoted with an asterisk differ at P < .05.
4. Discussion
The promotion of the health benefits of quercetin has spurred increased interest in the scientific community [15] and the dietary supplements industry [6]. Specifically, a 21% reduction in cardiovascular disease mortality in humans has been reported for intakes of quercetin of greater than 4 mg/d [16]. Castilla et al [17] found that red grape juice, of which quercetin is the primary polyphenol, increased high-density lipoprotein concentrations and reduced low-density lipoprotein and oxidized low-density lipoprotein. Given the potential of quercetin to act as an anti-inflammatory agent, it is surprising that studies addressing the influence of quercetin on body weight, composition, and the corresponding alterations of inflammatory markers are limited.
Our data clearly demonstrate that continuous quercetin ingestion increased EE when measured after 3W but not after 8W. The failure to maintain increases in EE and reductions in plasma quercetin concentrations at 8W suggests a metabolic adaptation or change in pharmacokinetics to the quercetin supplementation. Despite these observations, quercetin remained effective in reducing the inflammation observed in animals on an HF diet at 8W. Although it remains to be established, these findings are consistent with the possibility that the change in circulating quercetin between 3 and 8W was sufficient to drop the quercetin dose below the threshold for effects on EE. It is also possible that the effective dose needed for reducing inflammatory markers is below the dose needed for effects on EE. These questions will need to be addressed directly in future studies.
An important question raised by our findings is the apparent disconnect between the effect of quercetin on EE (Fig. 5A) and the lack of an effect on growth or body composition (Figs. 3 and 4). We expected that the increase in EE at 3W would translate into reduced fat deposition, particularly because food consumption did not differ between the groups. However, if the effect of quercetin on EE was short-lived and lost earlier than the 8W time point documented here, it is unlikely that the modest effect of quercetin on EE noted at 3W would be sufficient to impact overall energy balance and fat deposition. Our body composition data from the 3W time point (Fig. 4) support this interpretation, but it will be important in future studies to determine the time course and duration of the effect of quercetin on EE.
We found that consumption of an HF diet supplemented with 0.8% quercetin for 3W increased EE relative to HF controls. The higher EE detected at 3W did not translate into significant differences in body weight (Fig. 3) or adiposity (Fig. 4). The lack of a quercetin-mediated shift in substrate utilization (Fig. 5C) suggests that the magnitude of the difference in EE between the groups was not significant enough to influence body composition. A few other studies support our findings. For example, a 0.5% quercetin diet fed to 1-month–old Swiss mice for 28 days did not result in changes in body weight compared with control animals [18]. Similar results were seen in rats fed high-fat, high-sucrose diets containing 0.02%, 0.2%, and 0.07% quercetin fed ad libitum for 4W [19].
Surprisingly, after 8W, there were no significant differences between EE in the HF and HF + Q groups (Fig. 5B.). In addition, blood plasma concentrations of quercetin were higher at the 3W time point than at the 8W time point for both day and night measures. Although circulating levels of quercetin were higher at night, which coincides with the nocturnal feeding habits of the mice and the long half-life (∼24 hours) of quercetin [20], the diurnal variation at 8W is greater, with significant differences noted at the 8W time point and not at 3W (Fig. 1). Together, these results suggest a metabolic adaptation to the diet such that the mice were able to quickly remove the quercetin from their system after 8W. Little is known about the adaptation to quercetin in the diet, and further exploration would be essential to understanding the benefits and/or risks associated with this botanical compound.
Given our discrepancy between 3 and 8W EE measurements, absolute levels, and diurnal changes in circulating quercetin concentration, it is important to note that diet composition is linked to quercetin absorption. A high-fat diet was chosen not only because it induces obesity in C57BL/6J mice, but also because quercetin absorption is greater and elimination is delayed with high-fat diets in other animal (porcine) models [8]. Specifically, increasing the fat content in quercetin-enriched diets from 3% to 17% resulted in a 50% increase in total bioavailability of quercetin in pigs [8]. In addition, the method of delivery has been implicated as a major factor in the effectiveness of the treatment; and it serves as a confounding variable when comparing our results to other studies. Injection [21], gavage [22], and addition of quercetin to food [22] or drinking water [23] are most commonly used. In a recent study, 5W-old spontaneously hypertensive rats (SHR) were provided 1.5 g quercetin per kilogram of diet for 5W or 11W [22]. Although there was an absence of a delayed progression of the cardiovascular morbidities that occur in SHR rats in those animals on the dietary intervention, 15W-old SHR when gavaged once daily with quercetin (10 mg/kg) for 4 days were observed to have a decreased arterial pressure when compared with the untreated control groups [22].
We observed a quercetin-mediated decrease in circulating markers of inflammation in a physiological model that were consistent with previous studies that have addressed quercetin's action in cell culture models [24,25]. Ishikawa et al [25] demonstrated the ability of quercetin to suppress nuclear factor–κB in glomerular cells, thus inhibiting IL-1–triggered MCP-1 expression. Quercetin has also been shown to reduce macrophage expression of TNF-α,IL-1β, and IL-6 in a dose-dependent manner through an inhibition of lipopolysaccharide-induced expression of these proinflammatory cytokines [26]. Quercetin has also been associated with an inhibition of protein kinase C translocation and activity and the activation of extracellular signal–regulated kinases and c-Jun NH2-terminal kinase, but did not influence the activation of the p38 mitogen–activated protein kinase (MAPK) pathway in human cultured mast cells. In other cell lines, however, MAPK pathway activation is inhibited by quercetin. For example, MAPK activation in human epidermal carcinoma cells was inhibited by quercetin (30 μmol/L) [27].
Once absorbed, quercetin is usually present in glycosylated forms, such as quercitrin (3-rhamnosylquercetin) and rutin. Previous in vitro experiments have shown that quercetin is more effective, when compared with quercitrin, in the down-regulation of the inflammatory responses [28]. This down-regulation was shown to occur via the nuclear factor–κB pathway without modification of c-Jun N-terminal kinase activity (both in vitro and in vivo) resulting in lower levels of cytokine and inducible nitric oxide synthase expression in a rat model of colitis. A more extensive exploration of the mechanisms associated with quercetin-mediated reductions in inflammation in physiological models is a promising area for future research.
The present study derives its novelty in part from rigorous attention to establishing the identity and purity of the quercetin used to formulate the diet, establishing the concentration and stability of quercetin in the diet, carefully measuring food consumption, and assessing a composite of the pharmacokinetics of the compound by measuring concentrations of quercetin in the blood at the peak and nadir of the metabolic cycle. Collectively, these aspects of the study provide a sound foundation for interpreting the physiological responses of the mice to the dose of quercetin administered in this work. The diet was originally formulated to contain 1.2% quercetin by weight, which translates to a dose of ∼30 mg/d per mouse based on an average food consumption of 2.5 g/d. However, upon analysis, the HF + Q diet actually contained 0.8% quercetin, which translates to a daily dose of 20 mg per mouse or 0.8 mg/d per gram of body weight for the weight range of mice in our study. Previous studies have used a variety of doses ranging from 50 μg/d per mouse [23] to 10 mg quercetin per kilogram of body weight [29] to as high as 5000 mg per kilogram of body weight per day [30]. Quercetin administered at 10%, 4%, and 1% in a pellet diet was not carcinogenic; and when 1% croton oil was administered after 1% quercetin, there were no increases in tumor incidence in Chinese golden hamsters [31]. In addition, when oral doses of 1 to 1000 mg of quercetin per kilogram of body weight were given to male mice, there were no mutagenic effects, as defined by the micronucleus test or the Salmonella tester strain TA 98 host-mediated assay [32]. The maximum tolerable dose of quercetin was determined to be 2500 mg/kg twice per day through intraperitoneal injection. At this dose, as well as at 1250 and 625 mg/kg twice per day, DNA damage was detected with alkaline single-cell gel electrophoresis; however, because of the high doses, it was suggested that clastogenic effects due to consumption would be unlikely [30]. Doses of quercetin in human intervention studies have ranged from 21 to 1000 mg/d, with no adverse side effects [7].
In summary, this study provides novel insights into potential metabolic actions of dietary quercetin. A high-fat diet (45 kcal %) supplemented with 0.8% quercetin produced a transient increase in EE after 3W on the diet that was not evident after 8W. A corresponding decrease in plasma quercetin without any decrease in food intake suggests that adaptive changes in the pharmacokinetics of quercetin may have diminished its biological efficacy. However, the dose of quercetin provided in this study produced a significant sustained decrease in several circulating markers of inflammation at 8W. These changes occurred in the absence of any reduction in adiposity by quercetin, suggesting a potential use of this compound in the chronic low-level inflammatory state associated with obesity. A more in-depth examination of quercetin and inflammation as it relates to disease development is necessary.
Acknowledgment/Conflict of Interest
This work was supported by the National Center for Complementary and Alternative Medicine (NCCAM) and the Office of Dietary Supplements (ODS) (NIH Grant P50AT002776-01), and by support from NIH CNRU P30 DK072476 and P20 RR021945 (TWG). The authors thank Michael Pellizzon, PhD (Research Diets), for his expertise in the quercetin diet formulation and Jamie Tuminello and Jennifer Rood for assistance with the multiplex cytokine analysis.
Footnotes
Publisher's Disclaimer: This article appeared in a journal published by Elsevier. The attached copy is furnished to the author for internal non-commercial research and education use, including for instruction at the authors institution and sharing with colleagues. Other uses, including reproduction and distribution, or selling or licensing copies, or posting to personal, institutional or third party websites are prohibited.
References
- 1.Mehta S, Farmer JA. Obesity and inflammation: a new look at an old problem. Curr Atheroscler Rep. 2007;9:134–8. doi: 10.1007/s11883-007-0009-4. [DOI] [PubMed] [Google Scholar]
- 2.Pi-Sunyer FX. A review of long-term studies evaluating the efficacy of weight loss in ameliorating disorders associated with obesity. Clin Ther. 1996;18:1006–35. doi: 10.1016/s0149-2918(96)80057-9. [discussion 5] [DOI] [PubMed] [Google Scholar]
- 3.Peluso MR. Flavonoids attenuate cardiovascular disease, inhibit phosphodiesterase, and modulate lipid homeostasis in adipose tissue and liver. Exp Biol Med (Maywood) 2006;231:1287–99. doi: 10.1177/153537020623100802. [DOI] [PubMed] [Google Scholar]
- 4.Enkhmaa B, Shiwaku K, Katsube T, Kitajima K, Anuurad E, Yamasaki M, et al. Mulberry (Morus alba L.) leaves and their major flavonol quercetin 3-(6-malonylglucoside) attenuate atherosclerotic lesion development in LDL receptor–deficient mice. J Nutr. 2005;135:729–34. doi: 10.1093/jn/135.4.729. [DOI] [PubMed] [Google Scholar]
- 5.Lamson DW, Brignall MS. Antioxidants and cancer, part 3: quercetin. Altern Med Rev. 2000;5:196–208. [PubMed] [Google Scholar]
- 6.Weldin J, Jack R, Dugaw K, Kapur RP. Quercetin, an over-the-counter supplement, causes neuroblastoma-like elevation of plasma homovanillic acid. Pediatr Dev Pathol. 2003;6:547–51. doi: 10.1007/s10024-003-5061-7. [DOI] [PubMed] [Google Scholar]
- 7.Williamson G, Manach C. Bioavailability and bioefficacy of polyphenols in humans. II. Review of 93 intervention studies. Am J Clin Nutr. 2005;81(1 Suppl):243S–55S. doi: 10.1093/ajcn/81.1.243S. [DOI] [PubMed] [Google Scholar]
- 8.Lesser S, Cermak R, Wolffram S. Bioavailability of quercetin in pigs is influenced by the dietary fat content. J Nutr. 2004;134:1508–11. doi: 10.1093/jn/134.6.1508. [DOI] [PubMed] [Google Scholar]
- 9.Silva JE. Thermogenic mechanisms and their hormonal regulation. Physiol Rev. 2006;86:435–64. doi: 10.1152/physrev.00009.2005. [DOI] [PubMed] [Google Scholar]
- 10.da-Silva WS, Harney JW, Kim BW, Li J, Bianco SD, Crescenzi A, et al. The small polyphenolic molecule kaempferol increases cellular energy expenditure and thyroid hormone activation. Diabetes. 2007;56:767–76. doi: 10.2337/db06-1488. [DOI] [PubMed] [Google Scholar]
- 11.Swanson CA. Suggested guidelines for articles about botanical dietary supplements. Am J Clin Nutr. 2002;75:8–10. doi: 10.1093/ajcn/75.1.8. [DOI] [PubMed] [Google Scholar]
- 12.Camuesco D, Comalada M, Concha A, Nieto A, Sierra S, Xaus J, et al. Intestinal anti-inflammatory activity of combined quercitrin and dietary olive oil supplemented with fish oil, rich in EPA and DHA (n-3) polyunsaturated fatty acids, in rats with DSS-induced colitis. Clin Nutr. 2006;25:466–76. doi: 10.1016/j.clnu.2005.12.009. [DOI] [PubMed] [Google Scholar]
- 13.Liu J, Li X, Yue Y, Li J, He T, He Y. The inhibitory effect of quercetin on IL-6 production by LPS-stimulated neutrophils. Cell Mol Immunol. 2005;2:455–60. [PubMed] [Google Scholar]
- 14.Logendra S, Ribnicky DM, Yang H, Poulev A, Ma J, Kennelly EJ, et al. Bioassay-guided isolation of aldose reductase inhibitors from Artemisia dracunculus. Phytochemistry. 2006;67:1539–46. doi: 10.1016/j.phytochem.2006.05.015. [DOI] [PubMed] [Google Scholar]
- 15.Pawlikowska-Pawlega B, Gruszecki WI, Misiak L, Paduch R, Piersiak T, Zarzyka B, et al. Modification of membranes by quercetin, a naturally occurring flavonoid, via its incorporation in the polar head group. Biochim Biophys Acta. 2007;1768:2195–204. doi: 10.1016/j.bbamem.2007.05.027. [DOI] [PubMed] [Google Scholar]
- 16.Graf BA, Milbury PE, Blumberg JB. Flavonols, flavones, flavanones, and human health: epidemiological evidence. J Med Food. 2005;8:281–90. doi: 10.1089/jmf.2005.8.281. [DOI] [PubMed] [Google Scholar]
- 17.Castilla P, Echarri R, Davalos A, Cerrato F, Ortega H, Teruel JL, et al. Concentrated red grape juice exerts antioxidant, hypolipidemic, and antiinflammatory effects in both hemodialysis patients and healthy subjects. Am J Clin Nutr. 2006;84:252–62. doi: 10.1093/ajcn/84.1.252. [DOI] [PubMed] [Google Scholar]
- 18.Barrenetxe J, Aranguren P, Grijalba A, Martinez-Penuela JM, Marzo F, Urdaneta E. Effect of dietary quercetin and sphingomyelin on intestinal nutrient absorption and animal growth. Br J Nutr. 2006;95:455–61. doi: 10.1079/bjn20051651. [DOI] [PubMed] [Google Scholar]
- 19.Yamamoto Y, Oue E. Antihypertensive effect of quercetin in rats fed with a high-fat high-sucrose diet. Biosci Biotechnol Biochem. 2006;70:933–9. doi: 10.1271/bbb.70.933. [DOI] [PubMed] [Google Scholar]
- 20.Hollman PC, Katan MB. Bioavailability and health effects of dietary flavonols in man. Arch Toxicol Suppl. 1998;20:237–48. doi: 10.1007/978-3-642-46856-8_21. [DOI] [PubMed] [Google Scholar]
- 21.Dias AS, Porawski M, Alonso M, Marroni N, Collado PS, Gonzalez-Gallego J. Quercetin decreases oxidative stress, NF-kappaB activation, and iNOS overexpression in liver of streptozotocin-induced diabetic rats. J Nutr. 2005;135:2299–304. doi: 10.1093/jn/135.10.2299. [DOI] [PubMed] [Google Scholar]
- 22.Carlstrom J, Symons JD, Wu TC, Bruno RS, Litwin SE, Jalili T. A quercetin supplemented diet does not prevent cardiovascular complications in spontaneously hypertensive rats. J Nutr. 2007;137:628–33. doi: 10.1093/jn/137.3.628. [DOI] [PubMed] [Google Scholar]
- 23.Hayek T, Fuhrman B, Vaya J, Rosenblat M, Belinky P, Coleman R, et al. Reduced progression of atherosclerosis in apolipoprotein E–deficient mice following consumption of red wine, or its polyphenols quercetin or catechin, is associated with reduced susceptibility of LDL to oxidation and aggregation. Arterioscler Thromb Vasc Biol. 1997;17:2744–52. doi: 10.1161/01.atv.17.11.2744. [DOI] [PubMed] [Google Scholar]
- 24.Cho JY, Park SC, Kim TW, Kim KS, Song JC, Kim SK, et al. Radical scavenging and anti-inflammatory activity of extracts from Opuntia humifusa Raf. J Pharm Pharmacol. 2006;58:113–9. doi: 10.1211/jpp.58.1.0014. [DOI] [PubMed] [Google Scholar]
- 25.Ishikawa Y, Sugiyama H, Stylianou E, Kitamura M. Bioflavonoid quercetin inhibits interleukin-1–induced transcriptional expression of monocyte chemoattractant protein–1 in glomerular cells via suppression of nuclear factor–kappaB. J Am Soc Nephrol. 1999;10:2290–6. doi: 10.1681/ASN.V10112290. [DOI] [PubMed] [Google Scholar]
- 26.Cho SY, Park SJ, Kwon MJ, Jeong TS, Bok SH, Choi WY, et al. Quercetin suppresses proinflammatory cytokines production through MAP kinases and NF-kappaB pathway in lipopolysaccharide-stimulated macrophage. Mol Cell Biochem. 2003;243:153–60. doi: 10.1023/a:1021624520740. [DOI] [PubMed] [Google Scholar]
- 27.Bird TA, Schule HD, Delaney PB, Sims JE, Thoma B, Dower SK. Evidence that MAP (mitogen-activated protein) kinase activation may be a necessary but not sufficient signal for a restricted subset of responses in IL-1-treated epidermoid cells. Cytokine. 1992;4:429–40. doi: 10.1016/1043-4666(92)90003-a. [DOI] [PubMed] [Google Scholar]
- 28.Comalada M, Camuesco D, Sierra S, Ballester I, Xaus J, Galvez J, et al. In vivo quercitrin anti-inflammatory effect involves release of quercetin, which inhibits inflammation through down-regulation of the NF-kappaB pathway. Eur J Immunol. 2005;35:584–92. doi: 10.1002/eji.200425778. [DOI] [PubMed] [Google Scholar]
- 29.Duarte J, Perez-Palencia R, Vargas F, Ocete MA, Perez-Vizcaino F, Zarzuelo A, et al. Antihypertensive effects of the flavonoid quercetin in spontaneously hypertensive rats. Br J Pharmacol. 2001;133:117–24. doi: 10.1038/sj.bjp.0704064. [DOI] [PMC free article] [PubMed] [Google Scholar]
- 30.da Silva J, Herrmann SM, Heuser V, Peres W, Possa Marroni N, Gonzalez-Gallego J, et al. Evaluation of the genotoxic effect of rutin and quercetin by comet assay and micronucleus test. Food Chem Toxicol. 2002;40:941–7. doi: 10.1016/s0278-6915(02)00015-7. [DOI] [PubMed] [Google Scholar]
- 31.Morino K, Matsukara N, Kawachi T, Ohgaki H, Sugimura T, Hirono I. Carcinogenicity test of quercetin and rutin in golden hamsters by oral administration. Carcinogenesis. 1982;3:93–7. doi: 10.1093/carcin/3.1.93. [DOI] [PubMed] [Google Scholar]
- 32.Aeschbacher HU, Meier H, Ruch E. Nonmutagenicity in vivo of the food flavonol quercetin. Nutr Cancer. 1982;4:90–8. doi: 10.1080/01635588209513744. [DOI] [PubMed] [Google Scholar]