

Abstract
G protein-coupled receptors mediate cell responses to extra-cellular stimuli and likely function in the context of a larger signal transduction complex. Utilizing the third intracellular loop of a G protein-coupled receptor in glutathione S-transfer-ase pulldown assays from rat brain lysates coupled with high sensitivity detection methods and subsequent functional studies, we report the identification of SET as a regulator of muscarinic receptor signaling. SET is a putative oncogene reported to inhibit protein phosphatase 2A and regulate gene transcription. SET binds the carboxyl region of the M3-muscarinic receptor i3 loop, and endogenous SET co-immunoprecipitates with intact M3 muscarinic receptor expressed in cells. Small interfering RNA knockdown of endogenous SET in Chinese hamster ovary cells stably expressing the M3 muscarinic receptor augmented receptor-mediated mobilization of intracellular calcium by ∼35% with no change in agonist EC50, indicating that interaction of SET with the M3 muscarinic receptor reduces its signaling capacity. SET knockdown had no effect on the mobilization of intracellular calcium by the P2-purinergic receptor, ionomycin, or a direct activator of phospholipase C, indicating a specific regulation of M3 muscarinic receptor signaling. These data provide expanded functionality for SET and a previously unrecognized mechanism for regulation of GPCR signaling capacity.
G protein-coupled receptors (GPCRs)2 represent the largest family of membranous receptors and process signals from a great diversity of endogenous and exogenous stimuli including biogenic amines, peptides, glycoproteins, lipids, nucleotides, ions, proteases, photons, odors, and taste. GPCRs possess a characteristic seven transmembrane domains linked by three extracellular and three intracellular loops. Interaction of agonist with the receptor initiates conformational changes within the receptor that are propagated to intracellular domains of the receptor, resulting in G protein activation and initiation of intracellular events. A long-term objective of our research effort is to define factors that influence the specificity and efficiency of signal propagation from GPCRs to G protein and perhaps function in the context of a larger signal transduction complex. Such proteins may influence receptor targeting to specific subcellular compartments, assembly of the receptor into functional complexes (i.e. receptosomes), and receptor trafficking to and from the plasma membrane as well as effector activation (1, 2).
The third intracellular loop (i3 loop) and the carboxyl terminus tail of the receptor are key sites for signal initiation and termination for most members of GPCRs. These regions can be of considerable size and represent potential sites for protein interaction.
Carboxyl-terminal domains of GPCRs contain discrete motifs that efficiently interact with cellular proteins such as the PDZ (PSD95-disc large-Zonula occludens) recognition motif (3). Other proteins interact with the carboxyl termini of some GPCRs via Src homology 2 (SH2) and SH3, pleckstrin homology, or Ena/VASP homology (EVH) domains (3). Although the i3 loop is one of the most important domains of GPCRs for their interaction with G proteins, only a few proteins have been identified as binding to this region (2, 4-11).
We previously identified interaction sites for Gβγ subunits and β arrestins within the i3 loops of M2 and M3 muscarinic receptors (M2-/M3-i3) (4-6). The binding of Gβγ to the i3 loop results in formation of a ternary complex consisting of the i3 loop, Gβγ, and G protein-coupled receptor kinase 2, postulated to position the enzyme on its substrate. In addition to its role in receptor regulation, the interaction of Gβγ or arrestin with the i3 loop may also facilitate the interface of GPCRs to diverse signaling pathways via complex formation with additional Gβγ- and arrestin-binding proteins. Other proteins including calmodulin, RGS2, and casein kinase 1α also interact with the M2-i3 and/or M3-i3 loops (9-11). Casein kinase 1α phosphorylates the M3-MR controlling the magnitude of M3 muscarinic signaling.
The i3 loop does not generally contain obvious predicted binding motifs or structural properties other than the two α helixes located at the juxtamembrane regions of the i3 loop. The small number of proteins interacting with the i3 loop relative to the carboxyl-terminal tail of GPCRs may be due to the weakness of the interaction itself and/or limited sensitivity of techniques used to isolate binding proteins.
As part of a broader effort to define protein complexes with the i3 loop, we initially used the i3 loop of the M2-MR, which is characterized by a larger i3 loop (180 amino acids), as a GST fusion protein to isolate binding partners from brain lysates. We took advantage of recent technologies that enhance sensitivity for detecting specific interactions utilizing fluorescent protein labeling and two-dimensional gel electrophoresis. Using this approach we report the identification of the protein SET as a surprising binding partner with the i3 loop of M2-MR. SET, also called template-activating factor I, was first identified as a partner of the SETCAN fusion gene, a putative oncogene associated with an acute undifferentiated leukemia (12). SET is reported to regulate transcription and inhibit protein phosphatase 2A (PP2A) (13, 14), which may be of particular interest for receptor regulation and signaling. In this study we report that SET directly interacts with the i3 loop of the M2- and M3-MRs, co-immunoprecipitates with intact receptor expressed in cells and specifically inhibits M3-MR-dependent signaling. These data suggest that SET/i3 loop interaction within the M3-MR leads to reduced signaling capacity for the receptor, providing an unexpected mode of regulation for GPCR coupling to downstream signaling pathways.
EXPERIMENTAL PROCEDURES
Recombinant Protein Preparations
The cDNAs encoding the i3 loop of the human M2- and rat M3-MRs (His208—Arg387 and Arg252—Gln490, respectively) were subcloned into pGEX-2T or pGEX-4T-1 vectors, respectively (4). The M3-MR i3 loop subdomains (Arg252—Gln389, Gly308—Gln 389, Val390— Gln 490, Lys-369—Thr424, Lys425—Gln 490, Thr450—Gln 490, Lys425—Gln 474) were generated using the full-length M3-MR i3 loop as template and cloned into the BamHI and EcoRI restriction sites of the PGEX-4T-1 vector as described previously (5). To generate the M3-MR Ile474—Gln490 construct, complementary oligonucleotides from this region were synthesized and annealed before ligation into the BamHI and EcoRI restriction sites of the PGEX-4T-1 vector. GST fusion proteins were expressed in BL21 cells and purified on glutathione-Sepharose 4B (GE Healthcare) as described previously (5, 6). Immobilized fusion proteins were stored at 4 °C, and each batch of fusion proteins used for experiments was first analyzed by SDS-PAGE and Coomassie Blue staining. The full-length encoding sequence of human SET cloned into the pQE30 vector was kindly provided by Dr. R. Z. Qi (Hong Kong University of Science and Technology). The His-tagged SET protein was expressed in M15 bacteria and purified on Ni2+-nitrilotriacetic acid beads (Qiagen Inc.) according to the manufacturer’s instructions.
Protein Interaction Assays
Rat brains were homogenized on ice with a Dounce homogenizer in 3 ml of hypotonic lysis buffer (5 mM Tris-HCl, pH 7.5, 5 mM EDTA, 5 mM EGTA)/g of tissue. All buffers contained a protease inhibitor mixture (1 tablet/10 ml, Complete Mini, EDTA-free, Roche Diagnostics). The tissue homogenate was centrifuged at 100,000 × g for 30 min at 4 °C to generate a cytosolic fraction. To reduce nonspecific interactions with GST alone or glutathione resin, brain cytosol was pre-cleared by successive incubations with GST bound to the glutathione-Sepharose 4B matrix followed by an incubation with the glutathione-Sepharose 4B matrix alone (Fig. 1A). Precleared brain cytosol (20 mg) was diluted 5 times (4 mg/ml) in buffer A (50 mM Tris-HCl, pH 7.5, 50 mM NaCl, 5 mM EGTA, 5 mM EDTA) and incubated overnight at 4 °C with GST or GSTM2-i3 (∼400 nM) pre-complexed with the glutathione-Sepha-rose 4B matrix (40 μl). Resins were then washed 2 times with 5 ml of buffer A containing 150 mM NaCl followed by 2 washes in the same buffer without NaCl. Bound proteins were eluted with 35 μl of 30 mM Tris-HCl, pH 8.5, 7 M urea, 2 M thiourea, and 4% CHAPS by rotation for 2 h at 4°C.
FIGURE 1. GST pulldown assay and overview of sample processing.

A, GST pulldown assay. Left panel, GST or GST fusion proteins encompassing the i3 loop of the M2-MR (His208—Arg387) were expressed in BL21 cells and purified as described under “Experimental Procedures.” The purified GST fusion proteins were electrophoresed on denaturing polyacrylamide gels (10%) and visualized by Coomassie Blue staining. Right panel, schema of the protein interaction procedure. Rat brain cytosol extracts were precleared by incubation with GST fusion protein alone followed by an incubation with glutathione-Sepharose 4B and then incubated with equimolar amounts of fusion proteins (400 nM; GST/GST-M2-i3) bound to Glutathione-Sepharose 4B (overnight, 4 °C). The matrix was washed, and bound proteins were eluted as described under “Experimental Procedures.” B, overview of protein labeling and sample processing. Proteins eluted from the different resins were labeled with three different CyDye fluorochromes: Cy5, Cy3, or Cy2. The three sets of labeled proteins were mixed and separated on the same two-dimensional gel. The CyDye labeled protein gels were scanned using a Typhoon 9400 Variable Mode Imager and analyzed with the DeCyder differential analysis software DIA, Version 5.0 (GE Healthcare). C, the three sets of images reflect the signals from proteins labeled with either Cy5, Cy3, or Cy2 fluorochromes separated on the same two-dimensional gel.
Two-dimensional Fluorescence Difference Gel Electrophoresis
Brain cytosol proteins eluted from GST or GST-M2-i3 resins were labeled with 400 pmol of the CyDye fluorochromes Cy2 or Cy5, respectively (GE Healthcare), by coupling of the dye to εNH2 group of lysine residues in a volume of 35 μl. The stoichiometry of CyDye labeling is specifically intended to achieve a minimal labeling of lysines (1–2% of all proteins). As an additional control, proteins eluted from GST-M2-i3 resin alone were labeled with Cy3. Labeling was performed on ice in the dark at pH 8.5 for 30 min incubation, after which the reaction was quenched by the addition of 1 μl of 10 mM lysine for 10 min. An equal volume of rehydration buffer (30 mM Tris, pH 8.5, 7 M urea, 2 M thiourea, 4% CHAPS, 130 mM dithiothreitol) containing 2% Bio-Lyte 3/10 ampholytes (Bio-Rad) was added, and samples were incubated at 24 °C for 10 min. The three samples labeled with Cy2, Cy3, or Cy5 were combined in the presence of an equal volume of DeStreak (GE Healthcare), and proteins were separated on first and second dimensions.
Two-dimensional Gel Electrophoresis
Proteins were first separated according to their isoelectric point along a linear immobilized pH-gradient strip (pH 3–10, 24 cm long) using the PROTEAN IEF cell (Bio-Rad). Sample loading was performed by active in-gel re-swelling (50 V), and protein separated by applying the following parameters: 200 V for 3 h and 1000 V for 4 h gradient; 8000 V for 8 h gradient; 8000 V for 4 h; 200 V for 48 h. After the first dimension the immobilized pH-gradient strips were equilibrated for 15 min in a buffer containing 6 M urea, 0.375 mM Tris, pH 8.8, 2% SDS, 20% glycerol, 2% dithiothreitol, and then for 15 min in the same buffer containing 2.5% iodoacetamide in place of dithiothreitol. For the second dimension, the strips were loaded onto manual cast 12.5% SDS-polyacrylamide DALT gels (GE Healthcare). Proteins were separated using the following parameters: 30 min at 5 watts/gel and 4 h at 17 watts/gel. After electrophoresis gels were fixed in a solution of 7% acetic acid and 10% methanol for 30 min.
Image Acquisition and Two-dimensional Gel Spot Pattern Analysis
Fluorophore-labeled protein gels were scanned using a Typhoon 9400 Variable Mode Imager at 100 μm resolution, with the photomultiplier tube set in the 425–500 V range (GE Healthcare). CyDyes are optimally detected using the following wavelength settings: Cy2, excitation 488 nm, emission 520 nm; Cy3, excitation 532 nm, emission 580 nm; Cy5, excitation 633 nm, emission 670 nm. Spot detection and quantification were performed using the DeCyder differential analysis software DIA, Version 5.0 (GE Healthcare). Gels were then post-stained with Sypro Ruby, and images were captured again using a Typhoon 9400 Variable Mode Imager. Protein spots of interest were excised using the Ettan Spot Handling Work station with a 2-mm diameter spot-picking head (GE Healthcare).
Protein Identification by Matrix-assisted Laser-desorption Ionization Time-of-flight (MALDI-TOF) Mass Spectrometry
Gel plugs were destained by incubation in 20 mM ammonium bicarbonate and 50% acetonitrile (3 times, 30 min each) followed by dehydration with 100% acetonitrile (20 min). Dehydrated gel plugs were automatically digested via the Spot Handling Work station (GE Healthcare) in-gel with 20 mM ammonium bicarbonate solution containing 20 ng/ml porcine modified trypsin protease (Promega). The tryptic peptide mixtures were extracted from the gel plugs in 2 cycles of 50% acetonitrile, 0.1% trifluoroacetic acid and dried by evaporation. Peptides were reconstituted in 50% acetonitrile, 0.1% trifluoroacetic acid and mixed with an equal volume of 10 mg/ml α-cyano-4-hydroxycinnamic acid for spotting in duplicate onto a MALDI plate.
MALDI-TOF-mass spectrometry and tandem TOF/TOF mass spectrometry were performed on a Voyager 4700 (Applied BioSystems). Ions specific for each sample (discrete from background and trypsin-derived ions) were then used to interrogate sequences entered in the SWISS-PROT and NCBI non-redundant databases using MASCOT. Tandem mass spectrometry was used to generate limited amino acid sequence information on selected ions if additional confirmation was required. Searches were performed without constraining protein molecular weight or isoelectric point and allowed for carbamidomethylation of cysteine, partial oxidation of methionine residues, and one missed trypsin cleavage. Highest confidence identifications have a statistically significant search score(s) and are consistent with the gel region from which the protein was excised (Mr and pI).
GST Pulldown Assay with Purified SET
Human recombinant His-tagged SET protein (30 nM) was gently mixed for 1 h at 4 °C with GST-M2-i3, GST-M3-i3 (full-length or truncated fragments), or GST fusion proteins (∼300 nM) bound to the glutathione-Sepharose 4B (12.5 μl) in 750 μl of buffer B (25 mM Tris-HCl, pH 7.5, 1 mM EDTA, 100 mM NaCl, 1 mM dithiothreitol, 0.1% Nonidet P-40, and protease inhibitors). Resins were washed 3 times with 500 μl of buffer B. The retained proteins were eluted from the resin with 25 μl of 5× loading buffer, placed in a boiling water bath for 5 min, and applied to 10% SDS-polyacrylamide gels. Separated proteins were then transferred to a polyvinylidene difluoride membrane and process for immunoblotting with a polyclonal anti-SET antibody (1:1000) kindly provided by Dr. T. D. Copeland (15) (NCI-Frederick, National Institutes of Health). Membranes were systematically re-probed with an anti-GST antibody (1:5000, GE Healthcare) to confirm equal amounts of GST fusion proteins and to control for protein loading.
Immunoprecipitation
100-mm dishes of COS-7 cells were transfected with 12 μg of empty vector (pcDNA3) or 12 μg of pcDNA3::M3MR with Lipofectamine 2000 according to manufacturer’s instructions (Invitrogen). After 72 h cells were lysed in Nonidet P-40 lysis buffer and incubated on ice for 1 h. The lysate was centrifuged at 12,000 × g for 30 min at 4 °C and precleared with Gamma-Bind Sepharose (GE Healthcare). The precleared lysates (5 mg of protein in 1 ml of lysis buffer) were incubated with 25 μl of monoclonal M3-MR antibody overnight at 4 °C. Gamma-Bind G-Sepharose (12.5 μl) was added, and incubation was continued for 1 h. The resin was pelleted, washed 3 times with Nonidet P-40 lysis buffer, resuspended in 2× protein sample buffer, and incubated at room temperature for 30 min followed by SDS-PAGE and immunoblotting with polyclonal anti-M3MR antibody (provided by Dr. Jurgen Wess, National Institutes of Health, Bethesda) (16) and SET antibody. Confluent 100-mm plates of CHO cells stably expressing the M3-MR (CHO-M3, ∼400 fmol/mg protein) and control CHO cells were lysed and processed for M3-MR immunoprecipitation as described above.
The mouse monoclonal M3-MR antibody was generated against the mouse M3-MR third intracellular loop (Arg252— Thr491) purified as a GST fusion protein (17) and prepared by Harlan Sera Labs (United Kingdom). The antibody recognizes the rat, mouse, and human M3-MR.
siRNA-mediated Gene Silencing of SET
siRNA duplexes 5′-CCAUCCACAAGUGUCUGCACUGCUU (bp 327–351) and 5′-CCGAAAUCAAAUGGAAAUCUGGAAA (bp 530 – 554) targeted to the human SET mRNA sequence (GenBank™ accession number D45198) were selected based upon optimal sequences as predicted by computational programs provided by Invitrogen. Control CHO cells and CHO-M3 cells at 30 – 40% confluency were transfected with a combination of SET siRNA duplexes (bp 327–351 and 530 –554) using Lipofectamine 2000 according to the manufacturer’s instructions (Invitrogen). In control experiments cells were transfected with the corresponding predicted oligonucleotide control for the siRNA duplex bp 327–351 (5′-CCAACACGUGAGUCUUCACGCUCUU) together with a random low GC oligonucleo-tide control provided by Invitrogen. The transfection mixture was removed 5 h later and replaced by F-12 medium containing 10% fetal bovine serum (FBS, Invitrogen) and 1% penicillin-streptomycin (Invitrogen).
To assess SET siRNA knockdown, cells were homogenized in lysis buffer (50 mM Tris, pH 8.0, 150 mM NaCl, 5 mM EDTA, 1% Nonidet P-40) and incubated for 1 h on ice. Cell homogenates were centrifuged at 10,000 × g at 4 °C, and 12.5 μg of the super-natant were separated on a 10% SDS-polyacrylamide gels and transferred to a polyvinylidene difluoride membrane. Expression of SET was assessed by immunoblotting with a polyclonal anti-SET antibody. The specificity of the knockdown for SET was validated by reprobing blots with antisera to α-actin (Chemicon international) and Gq.
The Gq antibody was generated against the carboxyl-terminal 10 amino acids of Gq (QLNLKEYNLV) cross-linked to KLH via a cysteine added to the amino terminus when the peptide was synthesized. Rabbits were immunized with the conjugate, and the antibody was purified on a protein A-Sepharose resin (GE Healthcare) (18).
Measurement of Cell Calcium Content
To evaluate receptor-effector coupling, we determined the ability of agonist to increase intracellular calcium in CHO control and CHO-M3 cells using a fluorometric imaging plate reader system (Molecular Devices Corp.). Seventy-two hours after siRNA transfection, CHO-M3 cells were seeded in F-12 medium containing 2% FBS and 1% penicillin-streptomycin (35,000 cell/100 μl/well) in 96-well clear-bottomed black microplates (Corning Costar Corp.) precoated with 100 μg/ml poly-D-lysine (Sigma-Aldrich). Four hours later cells were dye-loaded (FLIPR calcium 3 assay kit, Molecular Devices) with 100 μl of the dye-loading buffer containing 2.5 mM probenecid for 1 h at 37°C in a 5% CO2 incubator. During a data run cells in different wells were exposed to different concentrations of drugs, and the system recorded fluorescent signals for all 96 wells simultaneously every 5 s for 5 min. Increases in intracellular calcium were observed as sharp peaks above the basal fluorescent levels typically 10 s after drug addition. The increases in intracellular calcium levels were determined by subtracting the base-line to the peak values (heights). Data were plotted, and t½ to peak values and for signal decay were determined using Graphpad Prism (version 4.0). Data are representative of 4–7 independent experiments; the data point for any drug concentration is an average from 3 to 4 wells.
Quantification of Cell Surface M3-muscarinic Receptor
Cell surface receptor number in CHO-M3 transfectants was determined by radioligand binding using [3H]NMS as described previously (5). Seventy-two hours after siRNA transfection, ∼500,000 cells from one 100-mm plate were plated in a 12-well plate. Parallel immunoblots indicated effective knockdown of SET as described above. Four hours later cells were placed on ice and washed 3 times with 1 ml of ice-cold cell washing solution (137 mM NaCl, 2.6 mM KCl, 1.8 mM KH2PO4,10 mM Na2HPO4) and incubated with the muscarinic plasma membrane-impermeable antagonist [3H]NMS (2 nM) in the presence or absence of atropine (10 μM) at 4 °C for 4 h. Cells were then washed 3 times with 1 ml of ice-cold cell washing solution, and 0.5 ml of cell washing solution containing 1% Triton X-100 was added to each well. Cells were scraped and transferred to vials containing 3.5 ml of Ecoscint A (National Diagnostics) for analysis by scintillation spectrometry. Under these experimental conditions, total [3H]NMS binding in intact cells ranged from 20,000 to 30,000 disintegrations/min, and nonspecific [3H]NMS binding was <3% of the total binding.
RESULTS
Isolation of Proteins Interacting with the i3 Loop of M2-muscarinic Receptor
As part of a broader effort to identify components of a GPCR signaling complex, we focused on the subgroup of GPCRs possessing a larger i3 loop such as found in the muscarinic receptors. We constructed a GST fusion protein containing the i3 loop of the M2-MR (180 amino acids, GST-M2-i3) and used it as an affinity matrix to pull down proteins from rat brain cytosol (Fig. 1A). GST-M2-i3 or GST fusion proteins were expressed in BL21 bacteria and purified by binding to glutathione-Sepharose 4B beads (Fig. 1A). We took advantage of recent technologies that enhance the sensitivity for detecting specific interactions and which involve fluorescent protein labeling and two-dimensional gel electrophoresis (Fig. 1B). We labeled proteins bound to the GST control or to the GST-M2-i3 affinity resins with different CyDye fluorochromes. We labeled proteins bound to GST-M2-i3 with Cy5 and proteins bound to the GST control with Cy2 (Fig. 1B). As an additional control, we used Cy3 to label the GSTM2-i3 fusion protein itself without preincubation with brain cytosol. The three sets of labeled proteins were then mixed and separated on a single two-dimensional gel to eliminate intergel variability often encountered by processing individual samples on different gels. This strategy allowed us to clearly identify proteins that interact specifically with the M2-i3 loop with a high degree of sensitivity by virtue of the CyDye fluorescent tags.
Fig. 1C presents the results of a representative CyDye labeling experiment with the two-dimensional gel pattern obtained for each set of labeled proteins. Each spot corresponds to a protein separated according to its apparent molecular weight and its isoelectric point (pI). The green and red signals with Mr ∼ 56,000 correspond to the GSTM2-i3 fusion protein (Cy3 and Cy5 pictures). The green spots below the Mr ∼ 56,000 likely correspond to fragments of the Mr ∼ 56,000 species, GST-M2-i3 fusion protein (Cy3 picture). The blue signal with an Mr ∼ 29,000 in the Cy2 picture corresponds to the GST fusion protein. All these three fluorescent pictures derive from the same single two-dimensional gel.
On the overlay picture containing the three fluorescent signals (Fig. 2, left panel), the merged colors yellow and purple (i.e. spots a and b) correspond to proteins present not only in the sample labeled with Cy5 but also in the sample labeled with Cy3 or Cy2. This is illustrated on the right panel of Fig. 2 where enlarged areas of the two-dimensional gel containing the Cy5 nonspecific spots a and b are shown in the three channels, Cy5, Cy3, and Cy2. The corresponding quantification of each spot in all three channels is represented by the histograms. Spot a is present in the Cy5 and Cy3 channels and relates to the GST-M2-i3 fusion protein itself, whereas spot b present in the Cy5 and Cy2 channels relates to a brain protein that interacts with the GST fusion protein (control). We identified two red spots, spots c and d, present only in the Cy5 channel (Fig. 2, right panel, Cy5-specific spots). These spots correspond to two proteins that bind specifically the M2-i3 loop. To identify these two M2-i3-binding proteins, the CyDye fluorophore-labeled protein gel was post-stained with Sypro Ruby, and spots c and d were cored, digested with trypsin, and analyzed by MALDI-TOF mass spectrometry.
FIGURE 2. Visualization of M2-i3 interacting proteins.

Left panel, representative image of the three labeled samples after separation on the same gel matrix. The merged colors, yellow and purple (spots a and b) correspond to proteins that appear in the Cy5 channel and in the Cy3 or Cy2 channels, respectively. The red spots correspond to proteins that appear only in the Cy5 channel (spots c and d). Right panel, quantification of spots a and b (Cy5-nonspecific) and c and d (Cy5-specific) with the DeCyder differential analysis software DIA, Version 5.0 (GE Healthcare). For each spot an enlarged area of the gel where the spot is located is shown in all three channels. The histograms represent the volume of each spot determined with the DIA software.
Identification of SET as a Binding Partner of the M2-i3 Loop
Three major peaks were identified in the mass spectrum from spot c (Fig. 3A). The three peaks correspond to three distinct peptides with a related mass (m/z) of 1208.63 (#1), 1840.82 (#2), or 2195.03 (#3). The data from the MALDI tandem mass spectrometry analysis were used to interrogate sequences contained in the SWISS-PROT and NCBInr databases using MASCOT. This analysis indicated that each peptide was an apparent tryptic fragment of the rat protein SET (Fig. 3B). SET (gi/2144100) is an acidic protein (pI 4.12) containing 277 amino acids with a calculated molecular mass of 32,085 Da. Both the Mr and the pI of the protein corresponding to spot c on the gel match with the characteristics of SET.
FIGURE 3. Identification of SET by MALDI TOF mass spectrometry.
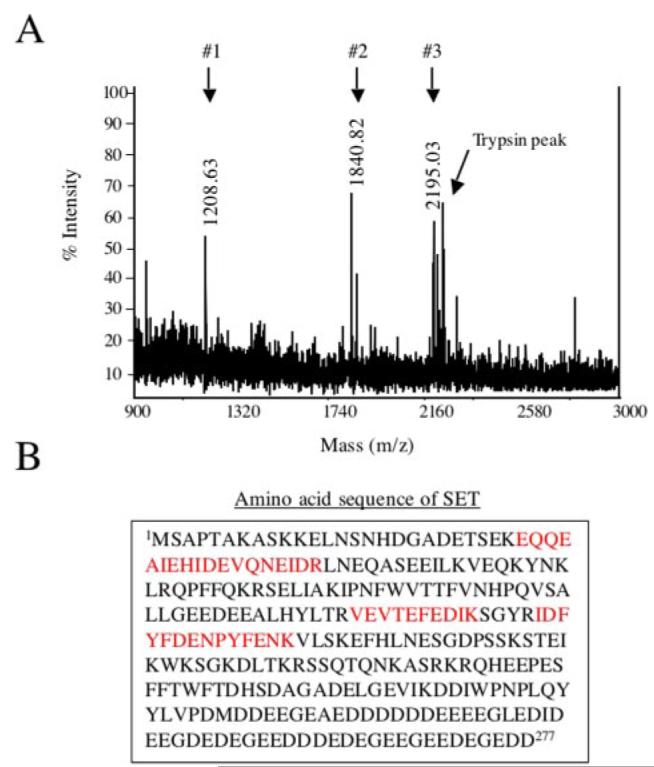
A, mass spectra profile of spot c. The CyDye fluorophore-labeled protein gel was post-stained with Sypro Ruby, and spot c was picked, trypsin-digested, and analyzed by MALDI-TOF mass spectrometry (see “Experimental Procedures”). Three major distinct peaks were obtained (#1–3) corresponding to three peptides with a mass (m/z) of 1208.63, 1840.82, or 2195.03. These peptides were subjected to tandem mass spectrometry analysis, and the sequences obtained were used to interrogate sequences entered in the non-redundant SWISS-PROT and NCBI databases using MASCOT. B, protein identified by mass spectrometry. Spot c was identified as SET. The three peptides in red correspond to the peptides identified by mass spectrometry that matched with the amino acid sequence of rat SET. No protein was identified for spot d.
SET, or template activating factor I, was first identified as a component of the SET-CAN fusion gene, a putative onco-gene associated with an acute undifferentiated leukemia. Unlike spot c, the mass spectrometry analysis of tryptic peptides from spot d did not match with known proteins. The inability to identify spot d may be due to a sensitivity limit of the mass spectrometry analysis (lower abundance of spot d) or to a contamination issue from the numerous spots surrounding spot d on the two-dimensional gel (Fig. 2, left panel). The presence of SET as a component of the M2-MR i3 loop complex was also observed with direct pulldown assays followed by immunoblotting with a specific SET antibody (Fig. 4) (15). These data also indicate that both the M2-and M3-MRs subtypes pull down SET from brain lysates and that a greater amount of SET associated with the M3-MR versus the M2-MR i3 loops. We then further characterized the interaction of SET with the MR-i3 loop biochemically and asked if SET influenced receptor signaling.
FIGURE 4. Rat brain SET interacts with the i3 loop of both the M2- and M3-MR.

GST fusion proteins encompassing the i3 loop of the M2- or M3-MRs (GST-M2-i3 His208—Arg387 and GST-M3-i3 Arg252—Gln490) were expressed in BL21 cells and purified as described under “Experimental Procedures.” The purified GST fusion proteins were electrophoresed on denaturing polyacrylamide gels (10%) and visualized by Coomassie Blue staining. The purified GST fusion proteins were incubated with rat brain cytosol, and the bound proteins were eluted and separated on denaturing polyacrylamide gels (10%), and membrane transfers were immuno-blotted with a polyclonal anti-SET antibody.
SET Interacts Directly with the i3 Loop of Both M2- and M3-muscarinic Receptors: Involvement of the Last 17 Amino Acids of M3-i3 Loop in SET Binding
We first asked if SET interacts directly with the i3 loop of the M2- and M3-MRs or if its interaction requires additional proteins present in brain cytosol. Recombinant His-SET was generated and incubated with M2-i3 and M3-i3 fusion proteins. Both i3 loops interacted directly with His-tagged SET protein (Fig. 5A). At equal concentrations of GST-M2-i3 and GST-M3-i3 fusion proteins, larger amounts of SET were pulled down by the GST-M3-i3, reflecting higher affinity or greater binding capacity of the GST-M3-i3 for SET.
FIGURE 5. Localization of the site of SET interaction with the M3-i3 loop.

A, the purified GST fusion proteins encompassing the i3 loop of the M2- or M3-MRs were incubated with recombinant His-tagged SET, and the bound proteins were eluted, separated on denaturing polyacrylamide gels (10%), and immunoblotted with a polyclonal anti-SET antibody. B, the M3-MR Arg252—Gln490 i3 loop peptide was progressively truncated at the amino and carboxyl termini to generate different M3-i3 loop fragments II–IX. Each construct was expressed in BL21 bacteria, and the purified GST fusion proteins were electrophoresed on denaturing polyacrylamide gels (10%) and visualized by Coomassie Blue staining. C, each of the M3-i3 constructs (B) were evaluated in protein interaction assays with recombinant SET as described in the legend to Fig. 4.
To delineate the binding region of SET within the i3 loop, we progressively truncated the i3 loop of the M3-MR and tested the ability of each truncated fragment to interact with the recombinant SET. We first generated GST fusion proteins containing the amino (Asg252—Gln389, Gly308—Gln389) or carboxyl (Val390—Gln490) regions of the M3-i3 loop (Fig. 5B). SET did not interact with the amino-terminal half of the i3 loop (II, Asg252— Gln389), but it was pulled down by GST-Val390—Gln490 (IV, Fig. 5C). Within this region, the M3-i3 Val369—Thr424 (V) did not bind SET, but the M3-i3 Lys425—Gln490 (VI) construct effectively interacted with SET. The interaction of SET with this region of the M3-i3 loop was primarily ionic in nature as it was disrupted by incubation with buffer containing 500 mM NaCl, but it was not altered in the presence of 1% Nonidet P-40, which would influence hydrophobic interactions.3 Subsequent studies indicated that the carboxyl-terminal 17 amino acids of the i3 loop (474ITKRKRMSLIKEKKAAQ490) were sufficient for binding SET (IX, Fig. 5C). Of interest is that the SET binding domain overlaps with the receptor region (Lys484—Gln490) involved in receptor coupling to Gq (19-21).
Endogenous SET Interacts with the Full-length M3-muscarinic Receptor
As a first step to define the functional role of the postulated SET-M3-MR interaction, we asked if endogenous SET effectively interacted with the full-length receptor in the cell rather than a fragment of the receptor in GST pulldown assays. Utilizing a monoclonal antibody generated against the i3 loop of the M3-MR, we effectively immunoprecipitated the receptor in lysates from the stably transfected CHO-M3 cells used for the functional studies as well as in lysates from COS-7 cells transiently transfected with the M3-MR (Fig. 6). The Mr of the major immunoreactive M3-MR species was ∼100,000 Da, as previously reported (16).
FIGURE 6. Interaction of the intact M3-MR with endogenous SET in CHO and COS-7 cells.

COS-7 cells transiently transfected with empty vector (pcDNA3) or pcDNA3::M3MR (A), CHO cells stably transfected or not with the M3-MR (CHO-M3) (B) were lysed in Nonidet P-40 buffer, and the receptor was immunoprecipitated as described under “Experimental Procedures.” The membrane transfer was first probed with anti-SET antibody followed by stripping and reprobing with a polyclonalM3-MR antibody to confirm effective receptor immunoprecipitation. The input and supernatant (Supt) lanes represent 1/25 of the lysate volume used for each immunoprecipitation (IP). The data are representative of two to three experiments.
Immunoprecipitation of the M3-MR resulted in co-immunoprecipitation of SET in COS-7 cells transiently transfected with the M3-MR and in CHO cells stably transfected with the M3-MR (CHO-M3) (Fig. 6). This interaction was specific for the M3-MR as SET was not observed in immunoprecipitates from COS-7 cells transfected with pcDNA3 alone (Fig. 6A)or from CHO cells lacking the M3-MR (CHO) (Fig. 6B).
Functional Role of SET-M3-i3 Interaction
As a next step to define the role of SET in the regulation of M3-MR signaling events, we examined the ability of muscarinic agonist to increase intracellular calcium with and without a reduction of endogenous SET as achieved by siRNA knockdown.
CHO cells stably expressing the M3-MR were transfected with siRNA oligonucleotides targeted to the SET mRNA sequence. Based upon evaluation using a fluorescent oligonucleotide, ∼95% of CHO-M3 cells were transfected with siRNA (Fig. 7A, left panel). Seventy-two hours after transfection, SET-siRNA reduced SET expression by ∼90%, whereas control siRNA oligonucleotides had no effect on SET expression (Fig. 7A, right panel). Importantly, SET knockdown was not accompanied by any significant change in the expression of Gαq protein or cell surface M3-MR (Fig. 7B).
FIGURE 7. SET knock down in CHO-M3 cells.
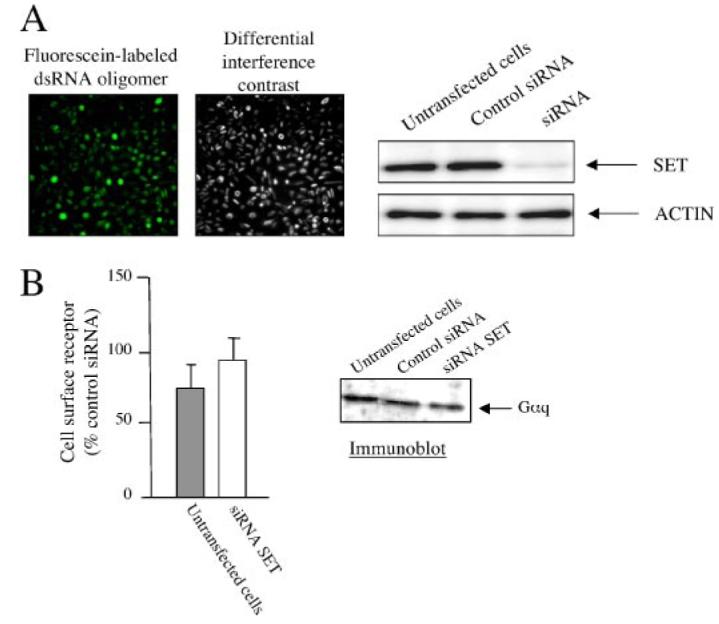
A, left panel, to assess the siRNA transfection efficiency, a fluorescein-labeled double-stranded RNA oligomer (Invitrogen) was transfected in parallel with siRNA in CHO-M3 cells, and cell fluorescence uptake was assessed 72 h after transfection. Magnification,10×. Right panel,12 μg of protein homogenates from CHO-M3 cells transfected or not with control siRNA or siRNA SET were electrophoresed on denaturing polyacrylamide gels (10%),and membrane transfers were probed with anti-SET or anti-actin antibodies. B, effect of SET siRNA knockdown on the expression of M3-MR (left panel) and Gαq (right panel). M3-MR cell surface expression was measured by radioligand binding (n = 3, means ± S.E., control siRNA, 32,159 ± 1,940 disintegrations/min/well). αq protein expression was assessed by immunoblotting CHO-M3 cell homogenates. See “Experimental Procedures.”
Intracellular calcium was measured in CHO-M3 cells loaded with a calcium-sensitive fluorescent probe before and after increasing concentrations of the muscarinic agonist carbachol. Typically, the maximal increase in intra-cellular calcium concentration (peak) was observed 10 s after the addition of carbachol. Carbachol elicited a concentration-dependent increase in intracellular calcium that was dependent upon the M3-MR and was not observed in control CHO cells (Fig. 8A).
FIGURE 8. Effect of SET knockdown on M3-MR signaling.
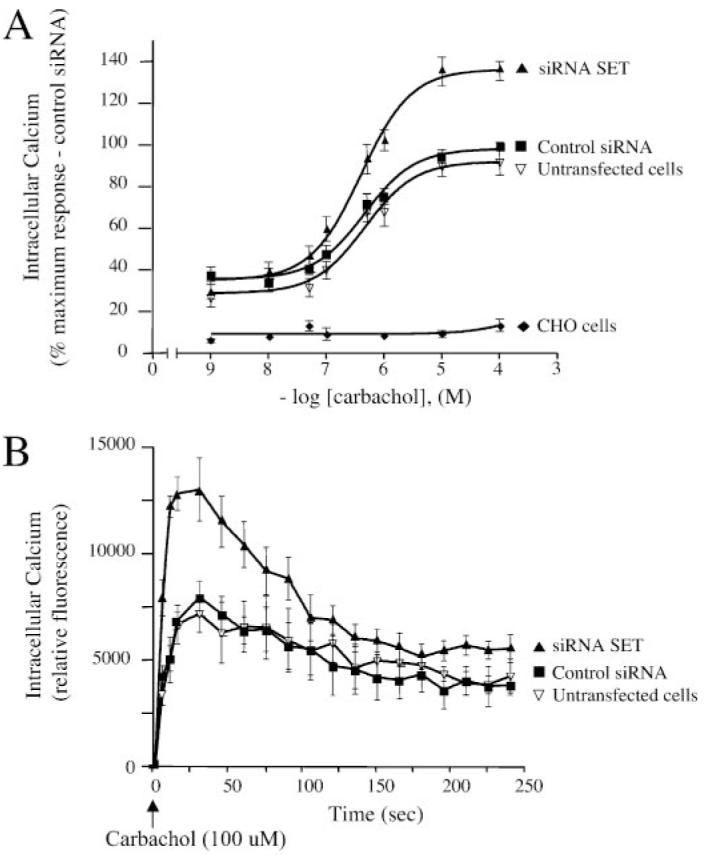
Measurement of the increases in intracellular calcium elicited by carbachol in CHO cells and CHO-M3 cells transfected or not with control siRNA oligonucleotides or SET-siRNA oligonucleotides. Cells were plated in 96-well black plates precoated with poly-D-lysine (see “Experimental Procedures”) and loaded with fluorescent dye. Excitation fluorescence was 485 nm, and emission was detected at 520 nm using a 515 nm emission cutoff filter. Six individual fields on the bottom of each well were selected for fluorescence measurement. Cells were incubated with agonist for 5 min with increasing concentrations (1 nM—100 μM) of the M3-MR agonist carbachol and fluorescence emissions were measured. A, the increases in intracellular calcium were determined by subtracting the base-line to peak values (heights). Results were expressed as the percentage of the maximal response in cells transfected with control siRNA. The data are presented as the mean ± S.E. of seven independent experiments in triplicate. Note that base-line values were not different among control cells and cells transfected with either SET siRNA or control siRNA (n = 7, mean ± S.E., untransfected cells (% control siRNA), 82.7 ± 18.8, siRNA SET (% control siRNA), 93 ± 13.6). B, time course of calcium mobilization in CHO-M3 cells after receptor activation. CHO-M3 cells were stimulated with 100 μM M3-MR agonist carbachol, and fluorescence emissions were measured for 4 min. The increases in intracellular calcium were determined by subtracting the base-line to peak values (heights). Results are expressed as relative fluorescence units. The data are expressed as the mean ± S.E. and are representative of four independent experiments in triplicate.
In cells with reduced levels of SET, the efficacy of carbachol in mobilizing intracellular calcium was increased by ∼35% relative to both control cells and cells transfected with control siRNA (Fig. 8A). Transfection of cells with control siRNA had no discernable effect on carbachol signaling. In contrast to its effect on efficacy, knockdown of SET had no effect on agonist potency (untransfected cells (siRNA), EC50 = 0.46 μM; control siRNA, EC50 = 0.45 μM; siRNA SET, EC50 = 0.39 μM) (Fig. 8A).
The addition of carbachol induced a sharp increase in intracellular calcium within ∼8 s that remained elevated at the maximal level for 10 —20 s followed by a progressive decay toward base line (Fig. 8B). SET knockdown did not alter the kinetics of intracellular calcium mobilization after receptor activation (Fig. 8B))(n = 4, mean ± S.E.)) (t1⁄2 to maximal peak response; untransfected cells, 4.81 ± 0.50 s; control siRNA, 3.66 ± 0.72 s; siRNA SET, 3.27 ± 0.54 s) (t½ for the decline in calcium levels after maximal peak response: untransfected cells, 72.9 ± 12.6 s; control siRNA, 63.5 ± 2.5 s; siRNA SET, 68.7 ± 9.5 s) (post-peak base-line levels (fluorescence units)): untransfected cells, 4406.3 ± 1642.9 s; control siRNA, 2989.7 ± 210.7 s; siRNA SET, 3205.8 ± 657.5 s)).
Importantly, knockdown of SET had no effect on the ability of ionomycin (a calcium ionophore) or the phospholipase C activator m3-M3FBS (22) to mobilize intracellular calcium, indicating that there was no generalized effect of the siRNA transfection on calcium handling per se (Fig. 9A). Furthermore, SET knockdown did not alter the ability of the endogenously expressed, Gq-coupled P2-purinergic receptor to mobilize intracellular calcium in CHO-M3 cells (Fig. 9B, right panel). Mobilization of intracellular calcium by P2 purinergic receptor agonist, UTP, was not different among control cells and cells transfected with either SET siRNA or control siRNA (Fig. 9B). Collectively, these results indicate that the effect of SET knockdown on M3-MR coupling likely occurs at the level of the receptor itself rather than through effects on signal processing downstream from the receptor.
FIGURE 9. Effect of SET knockdown on calcium mobilization by ionomycin, m3-M3FBS and the Gq-coupled P2-purinergic receptor agonist UTP.

Measurements of intracellular calcium were performed as described in the legend of Fig. 8. Cells were stimulated with a calcium ionophore, ionomycin (10 μM), or the phospholipase C activator m3-M3FBS (25 μM)(A) or with increasing concentrations (1 nM to 100 μM) of the P2 purinergic agonist, UTP (B). The increases in intracellular calcium were determined by subtracting the base-line to peak values (heights). Results were expressed as the percentage of the maximal response in cells transfected with control siRNA (control siRNA (relative fluorescence): ionomycin, 76,453 ± 18,361; m3-M3FBS, 17,931 ± 3454; UTP, 67,472 ± 9,351). The data are presented as the mean ± S.E. of seven independent experiments in triplicate.
DISCUSSION
It is becoming increasingly clear that GPCRs do not exist in isolation but rather likely function within a large complex of proteins involving dimers or oligomers of receptor and associated proteins that complex with either the receptor or G protein (1). The actual individual components of such a signal transduction complex are likely receptor and cell type-specific as nature has fine-tuned its signal processing network. The signal transduction complex is likely a fluid entity with components adapting to specific environments. As part of a broad effort to define such a signaling complex, we maximized our sensitivity for biochemical detection of receptor binding partners and identified SET as an unexpected binding partner for the i3 loop of M2- and M3-MRs.
SET, also called template-activating factor I for template activating factor I, was first described as part of the SETCAN fusion gene in a patient with acute undifferentiated leukemia, apparently as a result of a gene translocation (12). Although the cellular role of SET is not clearly defined, many functions have been described for this protein. SET is likely involved in the control of gene transcription through regulation of chromatin remodeling and as a component of the INHAT complex (inhibitor of histone acetyltransferase) (14, 23). SET is also an inhibitor of PP2A, which is involved in many cellular functions including cell cycle progression and GPCR trafficking (13, 24-26). Although most studies indicate that SET is enriched in the nucleus, immunocytochemistry and cell fractionation studies reveal SET in both the cytoplasm (27, 28) and at the plasma membrane of cells (29). Hypotonic lysis of rat brain reveals a significant fraction of SET in the 100,000 × g supernatant, and the M2-i3 loop interacted with both cytosolic SET and the detergent-solubilized pellets from the 100,000 × g pellet.3 The relative distribution of SET within the cell is likely regulated. A short cytoplasmic domain of the amyloid precursor protein, called Jcasp, induces the redistribution of SET between the cytoplasm and the nucleus in primary cortical neurons and may play a role in the induction of apoptosis mediated by Jcasp (28). Ectopic expression of the cell adhesion molecule NF-protocadherin in HeLa cells also results in translocation of SET to the plasma membrane where it colocalized with NF-protocadherin and may be involved in ectoderm differentiation (29). Initial experiments with crude cell fractionation did not indicate a major effect of M3-MR activation on the redistribution of SET.3 Nevertheless, the interaction of SET with the muscarinic receptor provides additional evidence for the existence of a non-nuclear function of SET. Receptor activation may lead to translocation or enhancement of the ability of SET to inhibit cellular PP2A activity, which may influence various aspects of signaling cascades or receptor regulation. An alternative interpretation, based upon the reported nuclear location of selected GPCRs, G proteins, and accessory proteins in the nucleus is that the M3-MR-SET interaction may also occur in the nucleus itself (30, 31), although the observed effects of carbachol are mediated through receptor at the cell surface.
SET interacts directly with the i3 loops of both M2 and M3-MRs, and for the latter receptor subtype binding of SET involves the last 17 amino acids of the M3-i3 loop (Ile474— Gln490). As mentioned in the introduction, proteins (Gβγ subunits, casein kinase 1α, and arrestin) other than SET interact with the M3-i3 loop, and one question arises as to which of the various proteins identified as receptor binding partners interacts with the receptor simultaneously and which of the binding partners has mutually exclusive sites of interaction. The M3-i3 binding sites for Gβγ (Cys289—His330) and casein kinase 1α (His374—Val391) within the i3 loop are located upstream of the SET binding domain (Ile474—Gln490) (5, 11). Thus, within the confines of available conformational space, it is conceivable that the different proteins could simultaneously bind to the i3 loop of the receptor. There appear to be two potential binding domains for arrestin within the M3-i3 loop, one of which may overlap with the SET binding domain (6).
Based upon the ionic characteristics of SET interaction with the M3-i3 loop and the demonstration that the last 17 amino acids of the i3 loop are sufficient to bind SET, two clusters of charged amino acids, 476KRKR479 and 484KEKK487, may interact with SET. These two clusters are also present at the carboxyl-terminal region of the i3 loop of the M2-MR (371QPAKKKPPPSREKKVTR387). Additional studies involving site-directed mutagenesis within this region will be required to determine whether any of the structural properties involved in binding of the M3-i3 loop to SET are conserved within the aminergic receptor subfamily of class I GPCRs. Clearly, the last 17 amino acids of the M3-i3 loop contains a subset of amino acids (Lys484—Gln490) involved in G protein coupling and activation (19-21, 32) as demonstrated for the juxtamembrane regions of the i3 loops of various GPCRs (32). The augmented response to M3-MR activation after knockdown of endogenous SET protein suggest that SET acts to provide a “brake” on M3-MR signaling. The current studies provide a foundation to pursue studies directed to define the mechanism and examine the role that such a regulatory mechanism may play for GPCRs in general. Given that our cell-based studies provide no evidence that SET non-specifically inhibits calcium signaling, three possible mechanisms present themselves as plausible explanations, which are consistent with the biochemical and functional data. First, by interacting with the last 17 amino acids of the M3-i3 loop, SET could impede G protein coupling to the receptor. Second, by virtue of its ability to inhibit PP2A, docking of SET to the receptor may increase the basal level of receptor phosphorylation and/or regulate the “regeneration” of a coupling-capable receptor by influencing the duration or magnitude of agonist-induced receptor phosphorylation. The phosphorylation status of a GPCR may play an important role in the maximal response observed after receptor activation (11, 33). Third, as an inhibitor of PP2A, SET may also play a role in receptor trafficking.
For many GPCRs, phosphorylation of the receptor by second messenger kinases and G protein-coupled receptor kinases after agonist-mediated activation is an important aspect of receptor regulation (11). PP2A is one of the major phosphatases involved in GPCR dephosphorylation (25). It binds directly to intracellular domains of the chemokine receptor CXCR2 (33) and the metabotropic glutamate receptor 5 (34) and co-immunoprecipitates with the β2-adrenergic receptor (35). In HEK293 cells stably expressing the CXCR2 receptor, inhibition of PP2A by okadaic acid increases basal phosphorylation of the CXCR2 receptor and reduces the increase in intracellular calcium concentration after a short-term stimulation with the agonist CXCL8 (33). Concerning the M3-MR, a phosphorylation-deficient receptor mutant elicits a more robust initial inositol phosphate response when compared with the wild type receptor (11). Consistently, siRNA knockdown of the endogenous PP2A inhibitor SET in CHO-M3 cells augmented the increase in intracellular calcium observed after a short-term activation of the M3-MR. By inhibiting PP2A, SET may enhance receptor phosphorylation and increase binding of arrestin, promoting receptor-G protein uncoupling and attenuating the magnitude of the response to receptor activation.
Finally, as an inhibitor of PP2A, SET may also play a role in receptor trafficking. Agonist-mediated activation of many GPCRs leads to receptor internalization resulting in a decreased responsiveness of the signaling system to agonist. Upon removal of agonist, the attenuated responsiveness is reversed in a process known as resensitization. The resensitization involves recycling of receptor to the plasma membrane and receptor dephosphorylation, which is suggested to be mediated by PP2A in endosomes (25, 26, 36). Inhibiting dephosphorylation of the receptor by SET would delay receptor recycling to the plasma membrane and presumably resensitization.
The isolation of SET as a receptor binding partner and the functional characterization of this interaction provides not only an expanded functionality for SET and possibly the SET-CAN oncogene but also presents a totally unappreciated mechanism for regulation of GPCR signaling capacity.
Acknowledgments
We greatly appreciate the mass spectrometry analysis provided by Dr. Chau-Wen Chou (Proteomics Core Facility, Louisiana State University Health Sciences Center) and the helpful support provided by Dr. Natalie R. Lenard (Division of Experimental Obesity, Pennington Biomedical Research Center) in the use of the Flex Station. We thank Dr. Terry D. Copeland (NCI-Frederick, National Institutes of Health), Dr. Robert Z. Qi (Hong Kong University of Science and Technology, China), and Dr. Jurgen Wess (National Institutes of Health, Bethesda) for kind gifts of materials. We are thankful to Maureen Fallon and Shilpa Yelundur for technical assistance. We are grateful to Dr. Ashok K. Pullikuth (Louisiana State University Health Sciences Center) for helpful discussions and to Dr. Anne Robinson for support. S. M. L and V. S. are grateful to Professor Claude Bouchard (Pennington Biomedical Research Center) for providing laboratory and office space after Hurricane Katrina, allowing continuation of the studies.
Footnotes
This work was supported in part by National Institutes of Health Grants MH90531 (to S. M. L.), NS24821 (to S. M. L.), DK074772 (to T. W. G.), and P20 RR021945 (to T. W. G.), the Fondation pour la Recherche Médicale (to V. S.), and the Cell and Molecular Imaging Core Facility in the Department of Pharmacology and Center of Excellence in Cardiovascular Research at Louisiana State University Health Sciences Center supported by National Institutes of Health Grant P20 RR018766 (to S. M. L.). The costs of publication of this article were defrayed in part by the payment of page charges. This article must therefore be hereby marked “advertisement” in accordance with 18 U.S.C. Section 1734 solely to indicate this fact.
- GPCR
- G protein-coupled receptor
- CHO
- Chinese hamster ovary
- i3 loop
- third intracellular loop
- MALDI-TOF
- matrix-assisted laser-desorption ionization time-of-flight
- MR
- muscarinic receptor
- M3-i3
- i3 loop of M3-MR
- PP2A
- protein phosphatase 2A
- siRNA
- small interfering RNA
- CHAPS
- 3-[(3-cholamidopropyl)dimethylammonio]-1-propanesulfonic acid
- GST
- glutathione S-transferase
- FBS
- fetal bovine serum
- NMS
- N-methyl scopolamine.
V. Simon and S. M. Lanier, unpublished observations.
REFERENCES
- 1.Sato M, Blumer JB, Simon V, Lanier SM. Annu. Rev. Pharmacol. Toxicol. 2006;46:151–187. doi: 10.1146/annurev.pharmtox.46.120604.141115. [DOI] [PubMed] [Google Scholar]
- 2.Bockaert J, Fagni L, Dumuis A, Marin P. Pharmacol. Ther. 2004;103:203–221. doi: 10.1016/j.pharmthera.2004.06.004. [DOI] [PubMed] [Google Scholar]
- 3.Bockaert J, Marin P, Dumuis A, Fagni L. FEBS Lett. 2003;546:65–72. doi: 10.1016/s0014-5793(03)00453-8. [DOI] [PubMed] [Google Scholar]
- 4.Wu G, Benovic JL, Hildebrandt JD, Lanier SM. J. Biol. Chem. 1998;273:7197–7200. doi: 10.1074/jbc.273.13.7197. [DOI] [PubMed] [Google Scholar]
- 5.Wu G, Bogatkevich GS, Mukhin YV, Benovic JL, Hildebrandt JD, Lanier SM. J. Biol. Chem. 2000;275:9026–9034. doi: 10.1074/jbc.275.12.9026. [DOI] [PubMed] [Google Scholar]
- 6.Wu G, Krupnick JG, Benovic JL, Lanier SM. J. Biol. Chem. 1997;272:17836–17842. doi: 10.1074/jbc.272.28.17836. [DOI] [PubMed] [Google Scholar]
- 7.DeGraff JL, Gurevich VV, Benovic JL. J. Biol. Chem. 2002;277:43247–43252. doi: 10.1074/jbc.M207495200. [DOI] [PubMed] [Google Scholar]
- 8.Wang Q, Limbird LE. J. Biol. Chem. 2002;277:50589–50596. doi: 10.1074/jbc.M208503200. [DOI] [PubMed] [Google Scholar]
- 9.Bernstein LS, Ramineni S, Hague C, Cladman W, Chidiac P, Levey AI, Hepler JR. J. Biol. Chem. 2004;279:21248–21256. doi: 10.1074/jbc.M312407200. [DOI] [PubMed] [Google Scholar]
- 10.Lucas JL, Wang D, Sadee W. Pharm. Res. (N. Y.) 2006;23:647–653. doi: 10.1007/s11095-006-9784-9. [DOI] [PubMed] [Google Scholar]
- 11.Budd DC, McDonald JE, Tobin AB. J. Biol. Chem. 2000;275:19667–19675. doi: 10.1074/jbc.M000492200. [DOI] [PubMed] [Google Scholar]
- 12.von Lindern M, van Baal S, Wiegant J, Raap A, Hagemeijer A, Grosveld G. Mol. Cell. Biol. 1992;12:3346–3355. doi: 10.1128/mcb.12.8.3346. [DOI] [PMC free article] [PubMed] [Google Scholar]
- 13.Li M, Makkinje A, Damuni Z. J. Biol. Chem. 1996;271:11059–11062. doi: 10.1074/jbc.271.19.11059. [DOI] [PubMed] [Google Scholar]
- 14.Seo SB, McNamara P, Heo S, Turner A, Lane WS, Chakravarti D. Cell. 2001;104:119–130. doi: 10.1016/s0092-8674(01)00196-9. [DOI] [PubMed] [Google Scholar]
- 15.Adachi Y, Pavlakis GN, Copeland TD. J. Biol. Chem. 1994;269:2258–2262. [PubMed] [Google Scholar]
- 16.Zeng FY, Wess J. J. Biol. Chem. 1999;274:19487–19497. doi: 10.1074/jbc.274.27.19487. [DOI] [PubMed] [Google Scholar]
- 17.Tobin AB, Nahorski SR. J. Biol. Chem. 1993;268:9817–9823. [PubMed] [Google Scholar]
- 18.Arthur JM, Collinsworth GP, Gettys TW, Quarles LD, Raymond JR. Am. J. Physiol. 1997;273:F129–F135. doi: 10.1152/ajprenal.1997.273.1.F129. [DOI] [PubMed] [Google Scholar]
- 19.Blin N, Yun J, Wess J. J. Biol. Chem. 1995;270:17741–17748. doi: 10.1074/jbc.270.30.17741. [DOI] [PubMed] [Google Scholar]
- 20.Schmidt C, Li B, Bloodworth L, Erlenbach I, Zeng FY, Wess J. J. Biol. Chem. 2003;278:30248–30260. doi: 10.1074/jbc.M304991200. [DOI] [PubMed] [Google Scholar]
- 21.Zeng FY, Hopp A, Soldner A, Wess J. J. Biol. Chem. 1999;274:16629–16640. doi: 10.1074/jbc.274.23.16629. [DOI] [PubMed] [Google Scholar]
- 22.Bae YS, Lee TG, Park JC, Hur JH, Kim Y, Heo K, Kwak JY, Suh PG, Ryu SH. Mol. Pharmacol. 2003;63:1043–1050. doi: 10.1124/mol.63.5.1043. [DOI] [PubMed] [Google Scholar]
- 23.Matsumoto K, Nagata K, Miyaji-Yamaguchi M, Kikuchi A, Tsujimoto M. Mol. Cell. Biol. 1999;19:6940–6952. doi: 10.1128/mcb.19.10.6940. [DOI] [PMC free article] [PubMed] [Google Scholar]
- 24.Lechward K, Awotunde OS, Swiatek W, Muszynska G. Acta Biochim. Pol. 2001;48:921–933. [PubMed] [Google Scholar]
- 25.Pitcher JA, Payne ES, Csortos C, DePaoli-Roach AA, Lefkowitz RJ. Proc. Natl. Acad. Sci. U. S. A. 1995;92:8343–8347. doi: 10.1073/pnas.92.18.8343. [DOI] [PMC free article] [PubMed] [Google Scholar]
- 26.Krueger KM, Daaka Y, Pitcher JA, Lefkowitz RJ. J. Biol. Chem. 1997;272:5–8. doi: 10.1074/jbc.272.1.5. [DOI] [PubMed] [Google Scholar]
- 27.Qu D, Li Q, Lim HY, Cheung NS, Li R, Wang JH, Qi RZ. J. Biol. Chem. 2002;277:7324–7332. doi: 10.1074/jbc.M107270200. [DOI] [PubMed] [Google Scholar]
- 28.Madeira A, Pommet JM, Prochiantz A, Allinquant B. FASEB J. 2005;19:1905–1907. doi: 10.1096/fj.05-3839fje. [DOI] [PubMed] [Google Scholar]
- 29.Heggem MA, Bradley RS. Dev. Cell. 2003;4:419–429. doi: 10.1016/s1534-5807(03)00036-4. [DOI] [PubMed] [Google Scholar]
- 30.Lee DK, Lanca AJ, Cheng R, Nguyen T, Ji XD, Gobeil F, Jr., Chemtob S, George SR, O’Dowd BF. J. Biol. Chem. 2004;279:7901–7908. doi: 10.1074/jbc.M306377200. [DOI] [PubMed] [Google Scholar]
- 31.O’Malley KL, Jong YJ, Gonchar Y, Burkhalter A, Romano C. J. Biol. Chem. 2003;278:28210–28219. doi: 10.1074/jbc.M300792200. [DOI] [PubMed] [Google Scholar]
- 32.Wess J. Pharmacol. Ther. 1998;80:231–264. doi: 10.1016/s0163-7258(98)00030-8. [DOI] [PubMed] [Google Scholar]
- 33.Fan GH, Yang W, Sai J, Richmond A. J. Biol. Chem. 2001;276:16960–16968. doi: 10.1074/jbc.M009292200. [DOI] [PMC free article] [PubMed] [Google Scholar]
- 34.Mao L, Yang L, Arora A, Choe ES, Zhang G, Liu Z, Fibuch EE, Wang JQ. J. Biol. Chem. 2005;280:12602–12610. doi: 10.1074/jbc.M411709200. [DOI] [PubMed] [Google Scholar]
- 35.Pullar CE, Chen J, Isseroff RR. J. Biol. Chem. 2003;278:22555–22562. doi: 10.1074/jbc.M300205200. [DOI] [PubMed] [Google Scholar]
- 36.Pippig S, Andexinger S, Lohse MJ. Mol. Pharmacol. 1995;47:666–676. [PubMed] [Google Scholar]