Abstract
The terminal fields of nerves carrying gustatory information to the rat brainstem show a remarkable amount of expansion in the nucleus of the solitary tract (NTS) as a result of early dietary sodium restriction. However, the extent to which these axonal changes represent corresponding changes in synapses is not known. To identify the synaptic characteristics that accompany the terminal field expansion, the greater superficial petrosal (GSP), chorda tympani (CT), and glossopharyngeal (IX) nerves were labeled in rats fed a sodium-restricted diet during pre- and postnatal development. The morphology of these nerve terminals within the NTS region where the terminal fields of all three nerves overlap was evaluated by transmission electron microscopy. Compared to data from control rats, CT axons were the most profoundly affected. The density of CT arbors and synapses quadrupled as a result of the near life-long dietary manipulation. In contrast, axon and synapse densities of GSP and IX nerves were not modified in sodium-restricted rats. Furthermore, compared to controls, CT terminals displayed more instances of contacts with postsynaptic dendritic protrusions and IX terminals synapsed more frequently with dendritic shafts. Thus, dietary sodium restriction throughout pre- and postnatal development had differential effects on the synaptic organization of the three nerves in the NTS. These anatomical changes may underlie the impact of sensory restriction during development on the functional processing of taste information and taste-related behaviors.
Indexing terms: chorda tympani, greater superficial petrosal, glossopharyngeal, brainstem nuclei, electron microscopy, salt
Established paradigms of sensory deprivation in mammals involve anatomical changes in the brain (Hubel and Wiesel, 1970; Harris and Woolsey, 1981; Smith et al., 1983; Frazier and Brunjes, 1988; May and Hill, 2006). Mediated by plasticity of synaptic connections, such anatomical restructuring has been widely studied at both the thalamic and cortical levels (Buonomano and Merzenich, 1998; Katz and Crowley, 2002; Shepherd et al., 2003). To a lesser extent, experimentally induced changes have also been demonstrated in the anatomical organization of the gustatory system at the first central synaptic relay, in the nucleus of the solitary tract (NTS) (Bradley, 2007). This medullary structure is especially attractive for studies of neural plasticity because it receives overlapping sensory input from three separate nerves: the chorda tympani (CT) nerve, which innervates taste receptor cells located in the anterior tongue, the greater superficial petrosal (GSP) nerve, which innervates taste receptor cells located in the palate, and the glossopharyngeal (IX) nerve, which innervates taste receptors on the posterior tongue (May and Hill, 2006).
Regionally specific, anatomical alterations confined to the terminal field of the CT in the NTS have been induced during development by limiting taste experience (Lasiter and Diaz, 1992; Lasiter, 1995), damaging taste receptor cells (Lasiter and Kachele, 1990), and implementing diets low (King and Hill, 1991; Krimm and Hill, 1997; Mangold and Hill, 2007) and high (Pittman and Contreras, 2002) in NaCl. For example, May and Hill (2006) reported that rats maintained on a diet low in NaCl (0.03% NaCl) from early gestation showed a 2-fold increase in the volumes of both CT and IX terminal fields compared to rats fed a standard, sodium-replete diet (0.3% NaCl). The most profound effects of this dietary manipulation occurred in the dorsal portion of the rostral NTS. CT and IX fields extended past their normal boundaries, significantly increasing the overlap among all three terminal fields. Furthermore, this increase was selective in that the volume of the GSP terminal field was not affected by the dietary manipulation (Sollars and Hill, 2000; May and Hill, 2006). None of these studies quantified terminal field densities because conclusions were based solely on terminal field volumes, primarily because of inaccuracies inherent in making and interpreting density measurements at the light microscopic level. Therefore, it is not clear if the expanded terminal field volumes are accompanied by a corresponding increase in axonal arbor densities (and synapses) or if the axonal arbor densities and synaptic inputs are unaltered but merely distributed throughout larger terminal field volumes. The examination of afferent axons and synapses by quantitative electron microscopy in the current study addresses these questions directly.
Recently, the fine structural properties defining the GSP, CT, and IX axon terminals and their synapses onto postsynaptic targets in the dorsal NTS were described in normal adult rats (May et al., 2007), providing fundamental fine structural information about this zone. While GSP, CT, and IX terminals all display similar characteristics of primary afferent nerves (i.e., synaptic vesicle-filled terminals engaging in asymmetric synaptic junctions), the terminals are somewhat distinct in their terminal size, and in their targeting, frequency, and density distribution of synapses onto NTS neurons. Most notably, differences in fine structure were present between IX and both CT and GSP afferent nerves in the NTS region where their terminal fields overlap. IX terminals were larger than CT and GSP terminals, they engaged in synaptic contacts more often with dendritic spines (CT and GSP terminals contacted dendritic shafts), and they accounted for the majority of the synaptic input to the zone of the NTS that was identified as changing the most during normal development and identified as being especially susceptible to the dietary manipulation (Sollars and Hill, 2000; May and Hill, 2006).
Since dietary sodium restriction throughout development results in specific increases in terminal field volume and increased overlap among terminal fields, corresponding changes in synaptic arrangements may occur as well. To discover the specificity and extent of synaptic changes in the NTS as a consequence of dietary sodium restriction throughout development, the fine structure of labeled GSP, CT, and IX axon terminals from developmentally sodium-restricted rats were examined with an electron microscope. These data were then compared with corresponding data from rats fed a standard, stock rat chow.
MATERIALS AND METHODS
All animal procedures were done in accordance with National Institutes of Health (NIH) guidelines for humane handling of animals, and all protocols were approved by the Institutional Animal Care Committee at the University of Virginia.
Animals and the sodium-restricted diet
Pregnant rats (Sprague–Dawley supplied by Harlan, Indianapolis, Indiana) were fed a 0.03% NaCl diet (MP Biomedicals, Solon, OH) and distilled water ad libitum from 3 days postconception through weaning at 21 days postnatal. The offspring of these dams were weaned and retained on the same dietary regimen throughout adulthood. Data from nine developmentally sodium restricted rats were used for the present study and were compared with data obtained from nine age-matched (50 – 60 days old) control rats that were used in a previously published study (May et al., 2007). The control animals were maintained on a standard, stock rat chow (Harlan Teklad Rodent Diet, #8604, Madison, WI) consisting of 0.3% NaCl throughout development. All data were collected from sodium-restricted and control rats during the same period and by the same experimenter, and all procedures were identical for both groups.
Anterograde labeling and perfusions
For anterograde labeling of the GSP, CT, or IX nerve, animals were anesthetized with medetomadine hydrochloride (IM; 0.2 mg/kg; Pfizer Animal Health, Exton, PA) followed by ketamine (IM; 20 mg/kg; Fort Dodge Animal Health, Fort Dodge, IA) and placed on a water-circulating heating pad to maintain body temperature at 36°C. Briefly, rats were placed in a nontraumatic head holder (Erickson, 1966), access to the CT and GSP was made through a ventral approach to the right tympanic bulla, and access to the IX was made in the ventral side of the neck medial to the tympanic bulla (May and Hill, 2006). Each nerve was cut peripheral to the ganglia, crystals of 3 kD biotinylated dextran amine (BDA) (Invitrogen, Carlsbad, CA) were carefully placed on the proximal cut ends of the nerves, and petroleum jelly was applied over the proximal stump to hold dye crystals in place. The incision was then sutured and animals were injected with atipamezole (IM; 1 mg/kg; Pfizer Animal Health) to reverse the effects of medetomadine HCl. Rats were allowed to recover from the anesthetic on a heating pad and then transferred to their home cage. After ≈24 hours survival, which has been optimal for BDA transport to the NTS (Sollars and Hill, 2000; May and Hill, 2006; Sollars et al., 2006; Mangold and Hill, 2007), animals were injected with a lethal dose of urethane (2 g/kg body weight) and perfused transcardially for 3 – 4 minutes with a Krebs solution that contained 1% heparin followed by a mixture of 4% paraformaldehyde and 1% glutaraldehyde in 0.1 M phosphate buffer (PB, pH 7.4).
Tissue preparation
After postfixing in 4% paraformaldehyde overnight, the medulla was blocked and sectioned on a vibratome horizontally at 50 μm through the entire NTS. Tissue sections were then reacted in a 1:100 avidin-biotinylated peroxidase complex in PBS overnight at 4°C, followed by 1% diaminobenzidine (DAB) and 0.0003% H2O2 for 5– 8 minutes.
SENSORY NERVE SYNAPSE MODIFICATIONS
The tissue was embedded in plastic resin following standard procedures (Hayat, 2000; Erisir and Dreusicke, 2005). Tissue was fixed with 1% osmium tetroxide for 1 hour, sections were counterstained en bloc with 4% uranyl acetate in 70% ethanol for 1 hour, and dehydrated sequentially in increasing concentrations of ethanol. Next, sections were infused with resin (EMbed-812; Electron Microscopy Sciences, Fort Washington, PA), flat-embedded between two acetate sheets (Aclar, Electron Microscopy Sciences), and placed in a 60°C oven overnight.
Tissue sampling
We chose to focus our electron microscopic characterization of the NTS on only the dorsal zone of the composite fields (Fig. 1), as described in horizontal sections by May and Hill (2006). This zone likely corresponds predominantly to the rostral central subdivision defined previously in coronal sections (Whitehead, 1988; Halsell et al., 1996). Since the NTS is inclined ventrally as it extends rostrally, our term “dorsal” also refers to a dorsal/caudal location within the rostral half of the NTS (Fig. 1C, D).
Fig. 1.
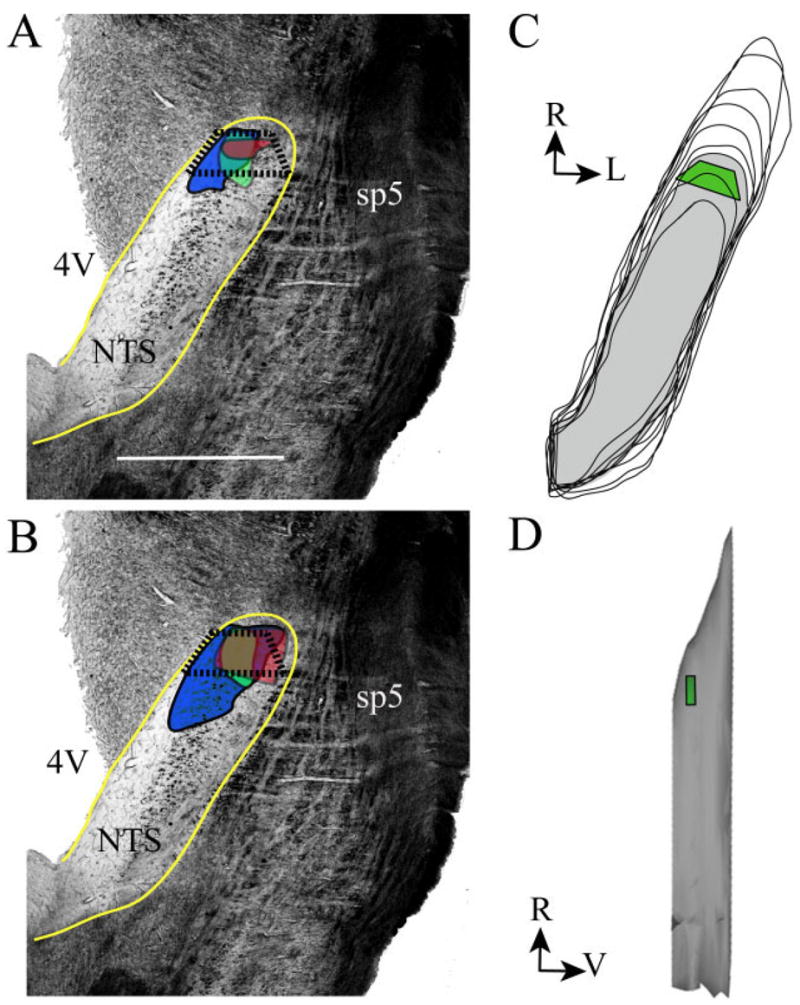
Photomicrographs and diagrams of the approximate area in which samples for electron microscopy were collected are shown. They are the same as the area sampled in controls. A: Photomicrograph of a representative horizontal section through the right NTS (outlined in yellow) in a control rat. The GSP (green), CT (red), and IX (blue) terminal fields are shown in their approximate location and configuration in the rostral NTS. The fields of overlap are depicted by the overlapping colored areas. The trapezoid (outlined in black, dotted lines) depicts the approximate area sampled for electron microscopic analyses. B: Photomicrograph depicting the expanded CT and IX terminal fields and resultant areas of terminal field overlap in a developmentally sodium-restricted rat. The colors denote the same fields as in A. C: 3D reconstruction of the right NTS viewed from the dorsal aspect. The gray layer represents the approximate single horizontal plane (i.e., third plane from the most dorsal aspect shown) from which samples were obtained. The green trapezoid in the rostral, dorsal portion of the NTS is the approximate area sampled for EM analyses. D: 3D reconstruction of the right NTS viewed from the lateral aspect. The green polygon in the rostral, dorsal portion of the NTS denotes the approximate area studied through EM. The orientation guide shown in C also applies to A, B. The orientation guide shown in D applies only to that panel. R, rostral; L, lateral; V, ventral; 4V, fourth ventricle; sp5, spinal trigeminal tract. Scale bar = 1 mm.
To locate tissue sections that contained this zone, the outlines of the NTS, DAB-stained terminal fields, and landmarks, such as the fourth ventricle, the shape of the solitary tract, and the position of the spinal trigeminal tract were drawn with a camera lucida. A trapezoid-shaped portion of tissue, containing only the rostral part of the densely labeled terminal field, was cut from thick (50 μm) tissue sections (Fig. 1). The excised portion of the tissue sections was repolymerized on the bottom of BEEM capsules. The features of capsule-embedded sections were again drawn in detail with the aid of a camera lucida in order to confirm the location of the region of interest relative to the borders of the trapezoid. Ultrathin sections were cut at 80 nm, collected on 200 mesh copper grids, and viewed with a JEOL 1010 electron microscope. Photographs were taken using either an analog film camera or a 16 Mpixel SIA-12C digital camera (Scientific Instruments and Applications, Duluth, GA), using MaxIm DL CCD software (Diffraction Limited, Ottawa, Ontario, Canada). Photographic film was developed, digitized at 600 dpi with an Epson Perfection 1200 Photo Scanner, and all images were examined at a final 30,000×–50,000× magnification on a computer monitor.
Quantitative analysis
Ultrathin sections contained the densely labeled region of the dorsal NTS (trapezoid in Fig. 1). The copper grids, upon which these sections were placed, provided a means to arbitrarily divide the sections into small squares of tissue. From each ultrathin section one tissue square was selected for examination. The tissue square corresponded to the region of interest in the NTS and contained the tissue-resin interface, resulting in near-parallel sections to the surface of the thick section. Within each grid-square a series of adjacent pictures were taken at low magnification (1500×); a montage of the tissue in the grid-square was constructed using Photoshop 7.0 (Adobe Systems, San Jose, CA). The area of the sample was measured using quantification software (Image Pro Plus, v. 4.5; Media Cybernetics, Silver Springs, MD), excluding any blood vessels, EPON patches, and myelinated axons. Typically, each area constructed in this manner averaged (± SEM) 4×10³ ± 7 μm2.
Density dataset
Within each selected grid square every DAB-labeled profile, regardless of whether it contained a synapse, was photographed again at 10,000× magnification. For each nerve (GSP, CT, or IX) a total of nine grid squares (three sections from each of three animals) were examined. Grid squares that were selected from the same animal did not overlap. Data collected in this manner were used for all density analyses (see “Derived measures” below). For terminal area measurements only the DAB labeled profiles that displayed a synapse were used (see below).
Identification criteria for profiles
Both labeled and unlabeled profiles were evaluated. When a profile contained DAB chromagen it was identified as a labeled axon representing the particular nerve. Therefore, we use the term “labeled axon” to denote axonal fibers regardless of whether they contained vesicles, formed boutons, or contained synaptic specializations. Both unlabeled and labeled profiles that contained vesicles were classified as an axon terminal, or, briefly, a terminal. Terminals displaying synapses were termed “synaptic terminals.” Synapses were defined by the existence of 1) a parallel alignment of a segment of the presynaptic membrane to the postsynaptic membrane; 2) at least three vesicles in a profile; and 3) at least one vesicle in the presynaptic profile in contact with the presynaptic membrane (Colonnier, 1968). Postsynaptic profiles were classified as a spine, a dendritic shaft, an axon terminal, or a cell soma. Cell somas were identified by the presence of an endoplasmic reticulum, subsynaptic cisterna, a Golgi apparatus, or a nucleus. Postsynaptic axon terminals were identified by the presence of vesicles, regardless of the presence of a synapse. The direction of an axo-axonic synapse was determined such that the presynaptic element contained vesicles accumulated by the synapse and the postsynaptic element displayed a prominent postsynaptic density. Dendritic profiles displaying microtubules or mitochondria were classified as shafts; those displaying neither were counted as dendritic spines (Peters et al., 1970). While there were cases in which dendritic spines had a spine apparatus, or they may have been observed as emerging from a dendritic shaft, meeting these two criteria was not necessary to include the structure as a “spine.”
Measurements
Several measurements were taken using Image ProPlus. 1) Synapse length: The length of the postsynaptic density along the parallel pre- and postsynaptic membranes of the profiles. 2) Area of synaptic terminals: The perimeter of each labeled terminal that contained a synapse was outlined and the area inside the outline was calculated. 3) Axon diameters: The feret minimum and feret maximum features of Image ProPlus were used to measure maximum length and width of the outlined axon. These measurements represented the largest and the smallest caliber of the labeled profile, respectively. 4) Postsynaptic profile diameter: The perimeters of the profiles that were postsynaptic to the labeled synaptic terminals were outlined and the largest caliber was computed.
Derived measures of axon and synapse density
In order to provide an estimate of frequency of axons and synapses provided by each nerve, we performed three calculations. First, we estimated the density of labeled fibers (Areal Axon Density) by using a calculation for length of axon segment that each labeled profile represented (see below). Second, the frequency of synapses along each axon (Synapsing Frequency) is an estimate of the number of synapses formed by a unit length of axon. Third, we calculated the Volumetric Density of labeled synapses; this is a measure of how many synapses a nerve provides into a unit volume of tissue. These three derived measures were obtained as follows.
Areal axon density
In order to estimate the density of labeled axons, we first calculated the length of axon segment represented by each labeled profile, using a previously published approach (Erisir and Dreusicke, 2005; May et al., 2007). Briefly, the smallest caliber (Cs) and largest caliber (Cl) of a profile as well as the section thickness (t), was applied in the formula below to estimate the length of the axon segment that each labeled profile represented.
Total length of axon was calculated by summing the estimated length of each labeled profile in each sample grid square of tissue. An estimate of the axon density within a unit area was derived by dividing the total estimated axon length by the measured area of the grid square. Note that this is an estimate of how densely axons occupy a given area in the brain, which is comparable to estimating the axon density that can be calculated at the light microscope level using single thick sections. The advantage of using electron microscopy (EM) for this analysis is the added precision of area measurements that excludes the areas of capillaries and cell bodies.
Synapsing frequency
To estimate the frequency of synapses along labeled axons, we divided the number of synapses observed by the total estimated length of all labeled axons for each grid. The outcome is reported as number of synapses per mm of axon. Note that this quantification is comparable to bouton counts along axon lengths measured at the light microscope level, with the added precision of confirmed synapses.
Volumetric density of synapses
The volumetric density (NV) of labeled synapses was calculated by applying a previously published quantification approach (Colonnier and Beaulieu, 1985; DeFelipe et al., 1999), using the formula NV = NA/d (d is the average synapse length and NA is the number of labeled synapses per unit area). The term for synapse length provides a normalization factor for the sampling bias introduced by the thickness of the tissue, which is smaller than the size of the counting unit (i.e., the length of the synaptic zone).
The volumetric density method was extensively described previously; the validity of this quantification approach is comparable to stereological approaches and it can be used reliably in estimating the number of synapses contained within a unit volume (Colonnier and Beaulieu, 1985; DeFelipe et al., 1999; Erisir and Harris, 2003). We believe this method is best suited for the tissue of study and for the requisite level of reliability (Guillery, 2002; Guillery and August, 2002). Counts using single ultrathin sections (i.e., Size-Frequency/Volumetric Density Method) were chosen over the dissector approach because, while both methods produce similar estimates of synapse density, the former is a simpler approach, thereby allowing efficient quantification of sparsely distributed labeled elements in wider brain areas in a repeated brain sample design (Colonnier and Beaulieu, 1985; DeFelipe et al., 1999). Moreover, using histochemically stained sections for EM quantification provides an additional reason for using single ultrathin section quantification approaches. Namely, the limited penetration of reagents into the thick tissue sections results in a strip of tissue (usually 10 –15 microns wide) that lines the tissue/EPON interface where the labeled synapses can be sampled. The tissue quality of the strips at the edge of the interface can be compromised from one ultrathin section to the adjacent or near adjacent ultrathin sections (i.e., the section used as the “look-up” section in the dissector method). In contrast, the statistical power is increased when using a single ultrathin section design on large tissue areas, in which the experimenter confirms the suitability because it allows sampling of a relatively large number of synapses. On the other hand, sampling probability in 2D section analyses can be biased if a large variability exists in the size of the sampled unit because, for example, large terminals would be cut into a higher number of ultrathin sections. Thus, they would have a higher probability to be included in the sample. This possible sampling bias was minimized in the present analysis by counting the terminals only when they displayed a synapse. In addition, since the volumetric density analysis uses average synapse length as the depth of section that is analyzed, any variability in synapse length across different cases is reflected and compensated for in this analysis.
Photomicrograph production
Electron photomicrographs were produced by digitizing negative films at a resolution of 1600 dpi to yield enlargements at 400 – 600 dpi without resampling. For figures, images captured using a 16 Mbyte digital camera were resampled to reduce the size to match the same magnification obtained with digitized negatives. Photoshop 7.0 (Adobe Systems) was used to compose and label the plates. Minimal brightness and contrast adjustments were performed.
Statistical analysis
Statistical comparisons between control and sodium-restricted rats for the GSP, CT, and IX afferent terminals were done with independent samples t-tests. The alpha level of 0.05 was divided by the number of comparisons for each measure (0.05/3 comparisons = 0.017; 3 comparisons – control vs. sodium-restricted rats for GSP, CT, or IX). Comparisons among the three nerves for sodium-restricted rats were done with analysis of variance (ANOVA). Post-hoc comparisons among GSP, CT, and IX means were accomplished with Bonferroni posttests unless variances were not homogeneous (i.e., determined by Levene statistic). The variances were not homogeneous for tests of terminal area, percentage of synapses on dendrites, dendritic calibers as the postsynaptic target, and volumetric synaptic density. For these four tests, post-hoc comparisons were done with Dunnett’s T3 test (SPSS, Chicago, IL). The alpha level of 0.05 was used to determine statistical significance. The t-test and post-hoc probabilities are reported in the text. Data from control rats were previously reported in May et al. (2007).
RESULTS
Qualitative properties of sodium-restricted terminals
At the light microscopic level, DAB-labeled fibers from each nerve densely terminated in the dorsal portion of the rostral NTS (Fig. 1). The features of DAB-labeled terminal fields of each nerve were comparable to fluorescently labeled terminal fields described in May and Hill (2006) (data not shown). Furthermore, the appearance and orientation of individual axon arbors for each nerve in sodium-restricted rats were similar to axon arbors in control rats. Axon arbors coursed in all directions, and swellings along the axons were detectable.
General appearance of sodium-restricted, afferent axon terminals
At the EM level, immunostaining for the anterograde tracer led to visualization of GSP, CT, or IX terminals (Figs. 2– 4) with DAB. Moderate intensity of the DAB label within anterogradely filled terminals did not obstruct qualitative and quantitative assessment of cellular membranes, postsynaptic densities, vesicles, or organelles. Similar to controls, labeled afferent terminals of sodium-restricted rats were medium to large in size (0.1 μm2 to 12.2 μm2) and contained round clear vesicles and dark mitochondria (Figs. 2– 4). These terminals formed synapses with dendrites, spines, and other unlabeled axons. Our sample did not contain instances of axo-somatic synapses. Afferent terminals were observed engaging in both simple synaptic junctions where one terminal formed a synapse with one postsynaptic element, and they were observed engaging with complex glomeruli (Peters et al., 1970), which consisted of glia surrounding an axon terminal that formed synapses with more than one postsynaptic target (Figs. 2, 3). Glomeruli also contained triadic arrangements, where a labeled terminal formed a synapse with a target, which in turn made a synapse with another profile that was also postsynaptic to the first labeled terminal (Fig. 3). Typical of all excitatory afferent axons (Peters et al., 1970), synapses associated with labeled terminals were asymmetric. Unlabeled axon terminals, with structural features similar to labeled axon terminals, were also observed forming asymmetric synapses in the vicinity of labeled axon terminals (Figs. 2, 3). In some cases these unlabeled, excitatory terminals were postsynaptic to labeled terminals (Fig. 2). Occasionally, both labeled and unlabeled axon terminals contained dense-cored vesicles (Fig. 5). Protrusions emerging from surrounding dendrites and axons were often encased within identified GSP, CT, and IX terminals of sodium-restricted rats resulting in a hole-punched appearance of the profile (Figs. 3, 5). Labeled terminals from all three nerves in sodium-restricted rats also occasionally displayed perforated postsynaptic densities (Peters and Kaiserman-Abramof, 1969), similar to control rats.
Fig. 2.
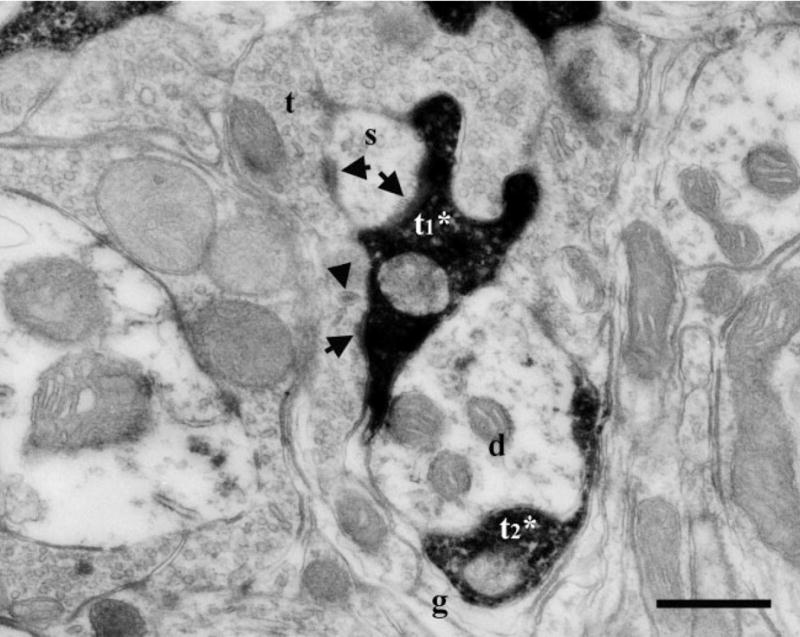
Electron micrographs of DAB-labeled terminals in the dorsal zone of the NTS of a sodium-restricted rat. A labeled GSP terminal (t1*) engaged in a synaptic triad and formed asymmetric synapses (arrows) on both a spine (s) and an unlabeled terminal (t). The unlabeled terminal (t) contained a dense-cored vesicle (arrowhead) and formed a synapse (arrow) on the same spine (s) as the labeled terminal (t1*). Glia (g) surrounded the entire arrangement including an additional labeled terminal (t2*) and a dendrite (d). Scale bar = 0.5 μm.
Fig. 4.
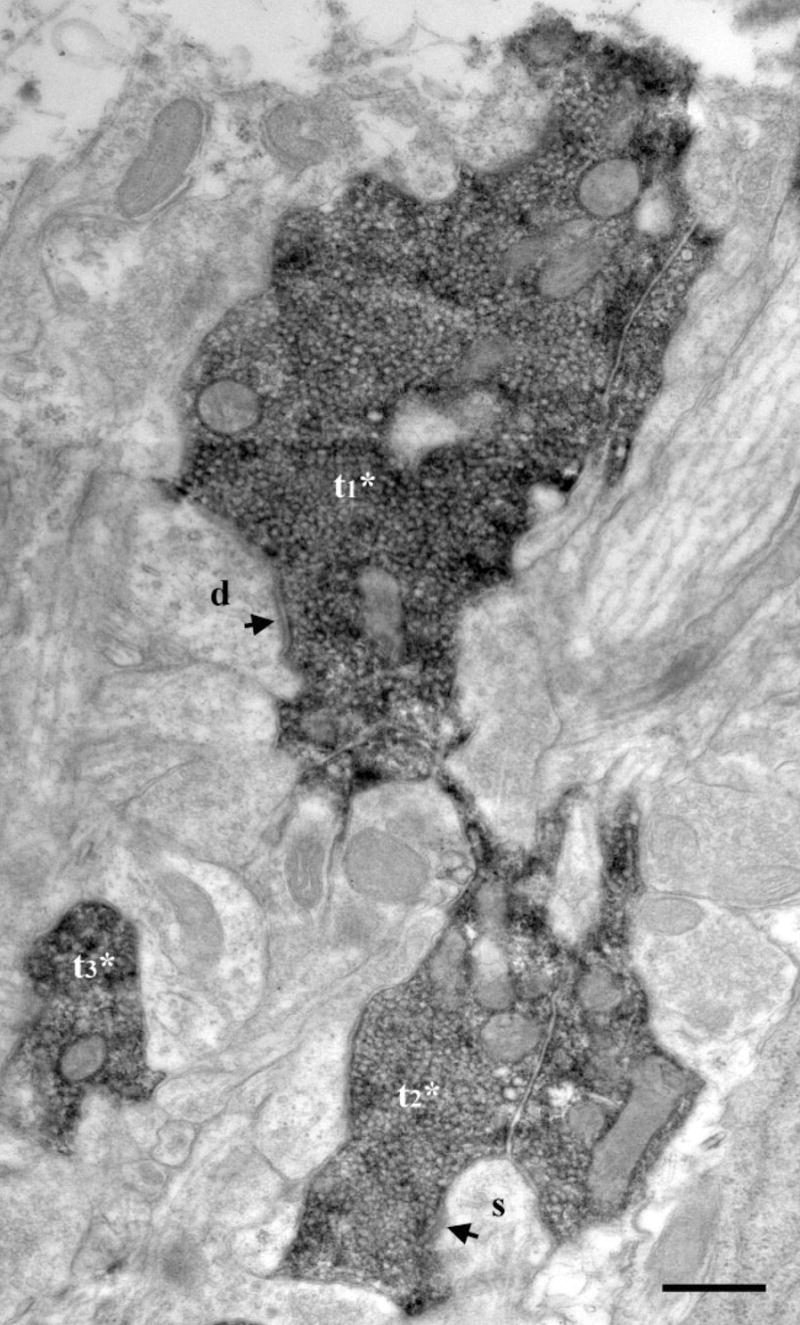
Electron micrograph of DAB-labeled IX terminals in the dorsal zone of the NTS of a sodium-restricted rat. Three closely apposed, labeled terminals (t1*, t2*, t3*) were densely filled with synaptic vesicles. One terminal (t1*) formed a synapse (arrow) on a dendrite (d). Another terminal (t2*) formed a synapse on spine (s). Scale bar = 0.5 μm.
Fig. 3.
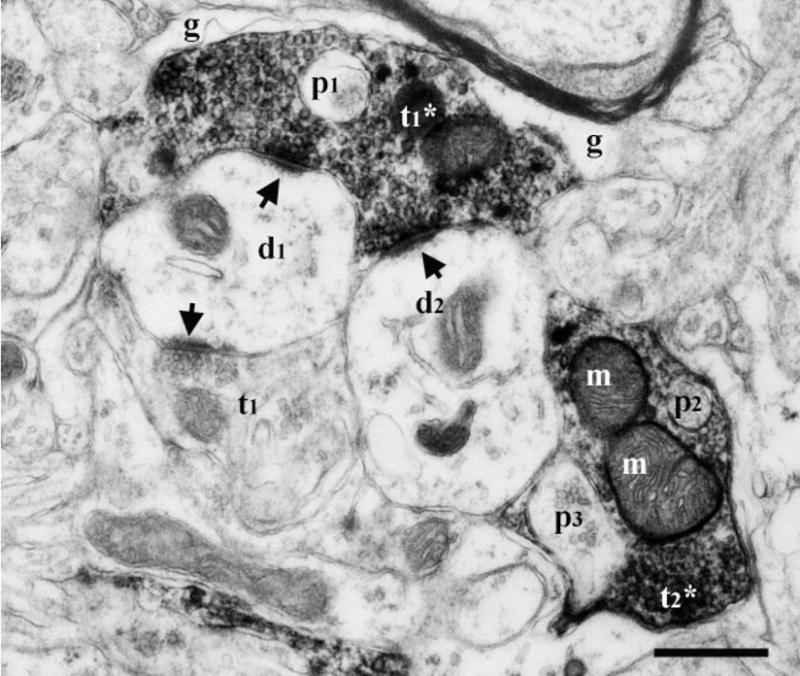
Electron micrograph of two labeled CT terminals (t1*, t2*) in the dorsal zone of the NTS of a sodium-restricted rat containing unlabeled inclusions (p), which are identified as finger-like protrusions from other neuropil. Lack of microtubules and vesicles suggest p1 and p2 may be emerging from postsynaptic spines. A third protrusion (p3) is identified as a segment from a terminal, based on the presence of vesicles within. One of the labeled terminals (t1*) formed synapses (arrows) with two separate dendrites (d1, d2). An unlabeled terminal (t1) also formed a synapse (arrow) with one of these dendrites (d1). Surrounding glia (g) suggests a glomerular structure. m; mitochondria. Scale bar = 0.5 μm.
Fig. 5.
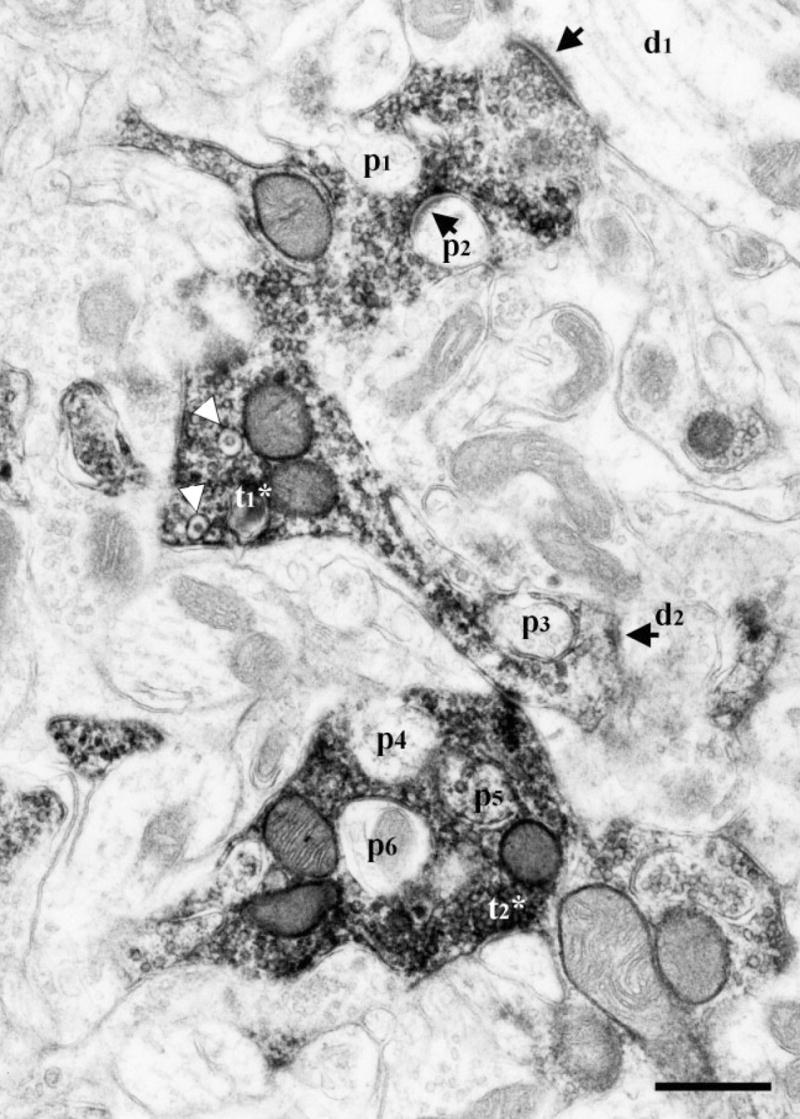
Electron micrograph of DAB-labeled CT terminals in the dorsal zone of the NTS of a sodium-restricted rat. Two labeled terminals (t1*, t2*) encased many protrusions (p1–p6) emerging from surrounding neuropil. The protrusion p6 is identified as a dendrite shaft, based on presence of mitochondria. One of the labeled terminals (t1*) contained dense-cored vesicles (white arrowheads) and formed synapses (arrows) with two separate dendrites (d1, d2) and with an encased protrusion (p2). Scale bar = 0.5 μm.
Quantitative analysis of sodium-restricted, afferent axon terminals
In order to document synaptic arrangements of labeled primary afferent axons after developmental sodium restriction, several morphometric parameters were quantified.
Terminal area
In order to determine if dietary sodium restriction affected afferent terminal size, the cross-sectional area of each labeled synaptic profile was measured and compared between control and sodium-restricted rats. The means and the distributions of GSP, CT, and IX terminal cross-section areas in sodium-restricted rats were not different than in controls (Fig. 6). Similar to control brains, the IX terminals in sodium-restricted rats were significantly larger than both GSP (P = 0.0001) and CT terminals (P = 0.0001), but the area of the GSP and CT terminals in sodium-restricted rats did not differ significantly from each other (Fig. 6).
Fig. 6.
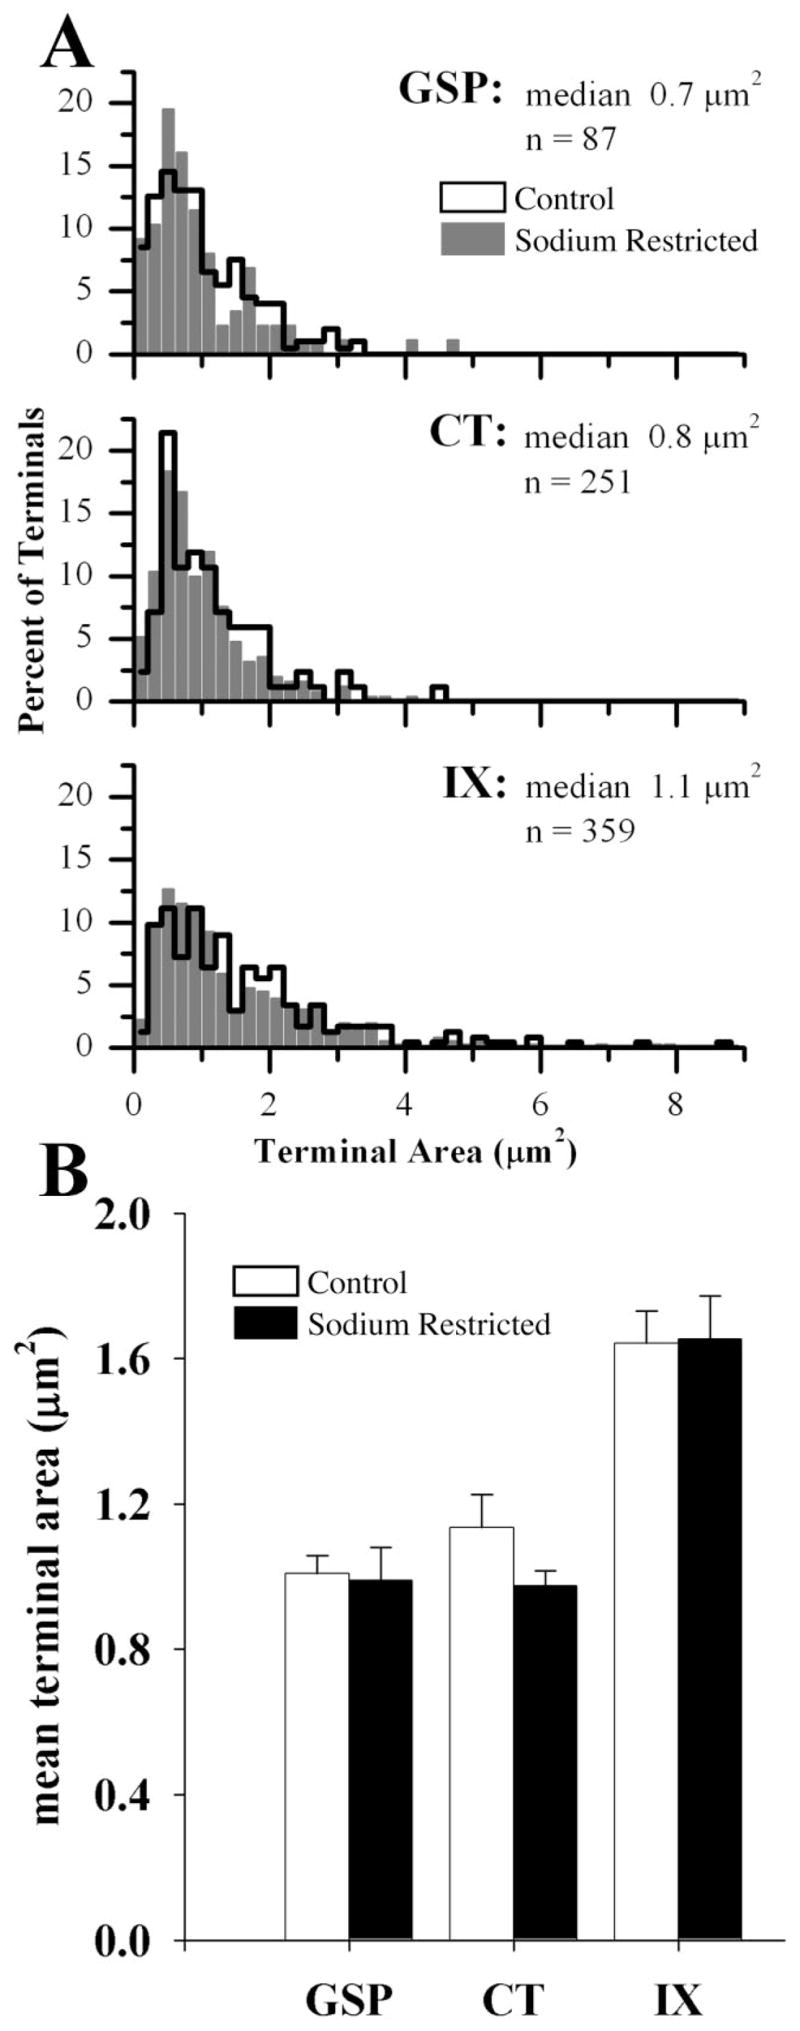
A: Frequency distribution histogram of the terminal areas of GSP, CT, and IX axon terminals in control (outline) and sodium-restricted (solid gray bars) rats. Frequencies for each nerve are displayed as a percentage of the total to allow visual comparison between groups. Median and population size (n) are indicated for each nerve in sodium-restricted rats. B: Mean terminal area (μm2) of GSP, CT, and IX axon terminals in control (open bars) and sodium-restricted (solid bars) rats. In comparing sodium-restricted rats to controls, terminal areas associated with GSP, CT, and IX axon terminals were similar. In comparing the three gustatory afferent nerves within sodium-restricted rats, terminal areas found on IX axon terminals were significantly larger than terminals on GSP and CT terminals (significance not shown on graph). The IX axon terminals were also larger than terminals on GSP and CT terminals for controls (significance not shown on graph). Error bars indicate standard error.
Synapse length
The efficacy of the synaptic contacts associated with axon terminals can be predicted by the extent of the active zone (Pierce and Lewin, 1994). Thus, in order to determine the effects of dietary sodium manipulation on the efficacy of synapses associated with labeled afferent axons, synapse length was also compared between control and sodium-restricted rats among GSP, CT, and IX axons. Synapses associated with CT terminals in sodium-restricted rats were significantly shorter than synapses on CT terminals in control rats (P = 0.002; Fig. 7). Conversely, synapses associated with GSP and IX terminals in sodium-restricted rats were significantly longer than synapses with GSP and IX terminals in control rats (GSP: P = 0.008; IX: P = 0.0001; Fig. 7).
Fig. 7.
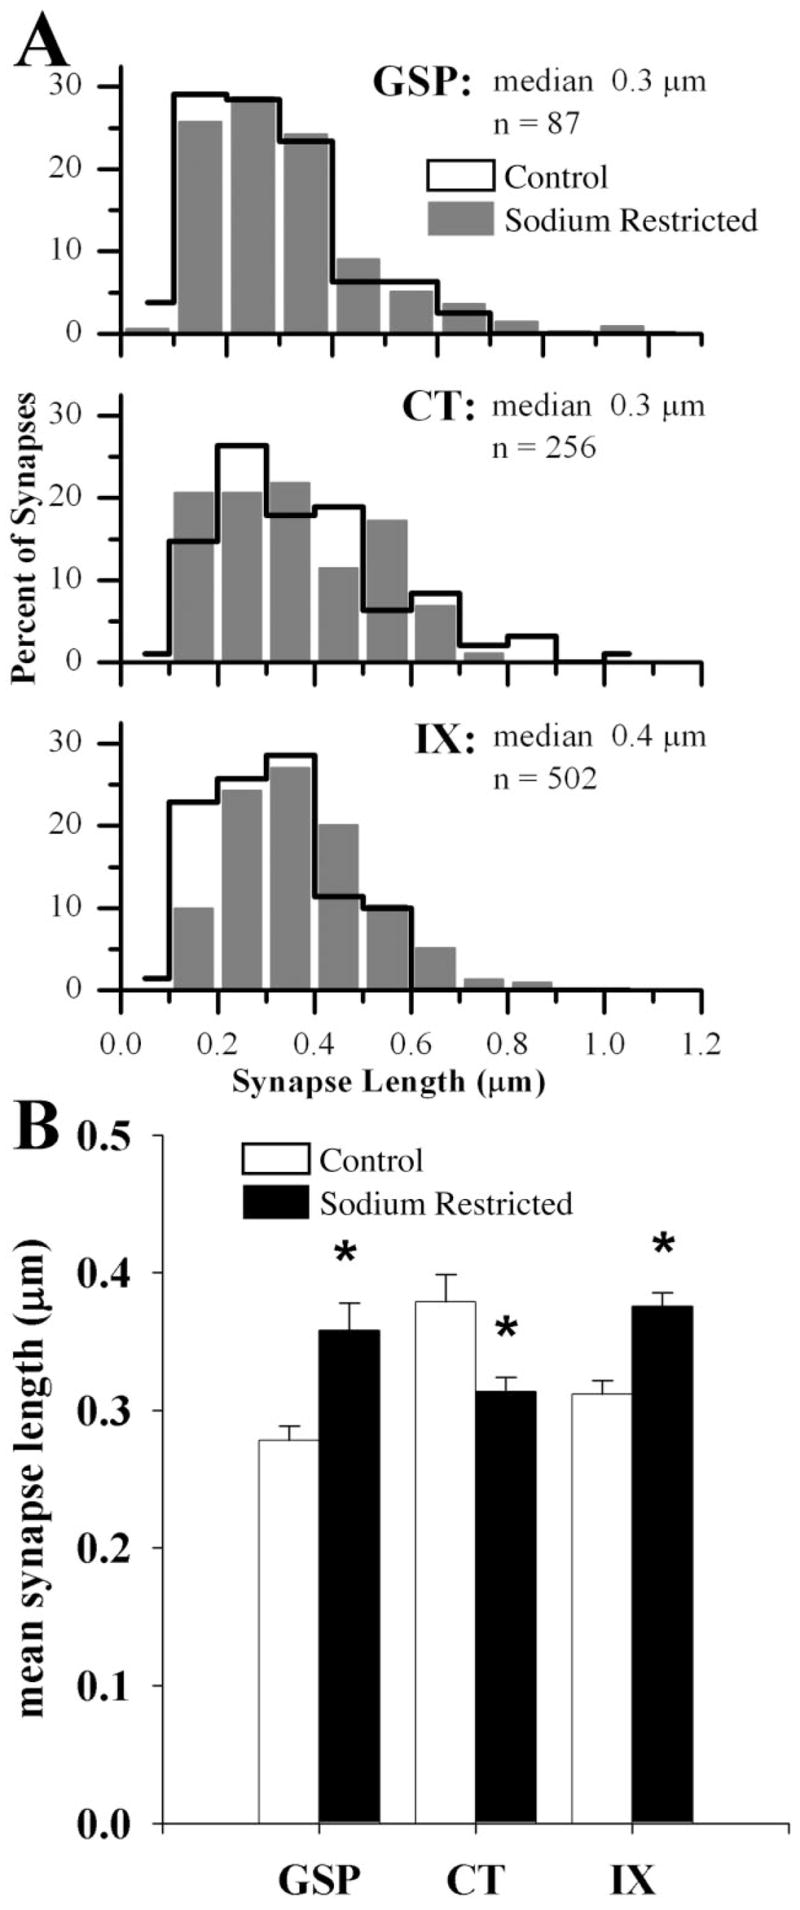
A: Frequency distribution histogram of the synapse lengths of GSP, CT, and IX axon terminals in control (outline) and sodium-restricted (solid gray bars) rats. Frequencies for each nerve are displayed as a percentage of the total to allow visual comparison between groups. Median and population size (n) are indicated for each nerve in sodium-restricted rats. B: Mean synapse length of GSP, CT, and IX axon terminals in control (open bars) and sodium-restricted (solid bars) rats. In comparing sodium-restricted rats to controls, synapses associated with GSP and IX axon terminals were longer, while synapses associated with CT axon terminals were shorter (asterisks indicate an alpha value less than 0.05). In comparing the three gustatory afferent nerves within sodium-restricted rats, synapses found on CT axon terminals were significantly shorter than synapses on GSP and IX terminals (significance not shown on graph). In control rats there were no significant differences among means (P > 0.2). Error bars indicate standard error.
Postsynaptic target preference
If axon proliferation is accompanied by new synapse formation, it is important to know if the target preferences in control brains are maintained. Differences in the postsynaptic target preference of afferent terminals were assessed by determining the percentage of the total number of synapses that occurred on dendrites, spines, and axons. There were no significant diet-related differences in the target preferences for GSP and CT terminals (Fig. 8). In contrast, there were significant differences between sodium-restricted and control rats in the distribution of synapses associated with IX terminals (dendrites: P = 0.001; spines: P = 0.001; Fig. 8). Therefore, a significant diet-related shift in synaptic contacts from spines to dendrites occurred with IX terminals.
Fig. 8.
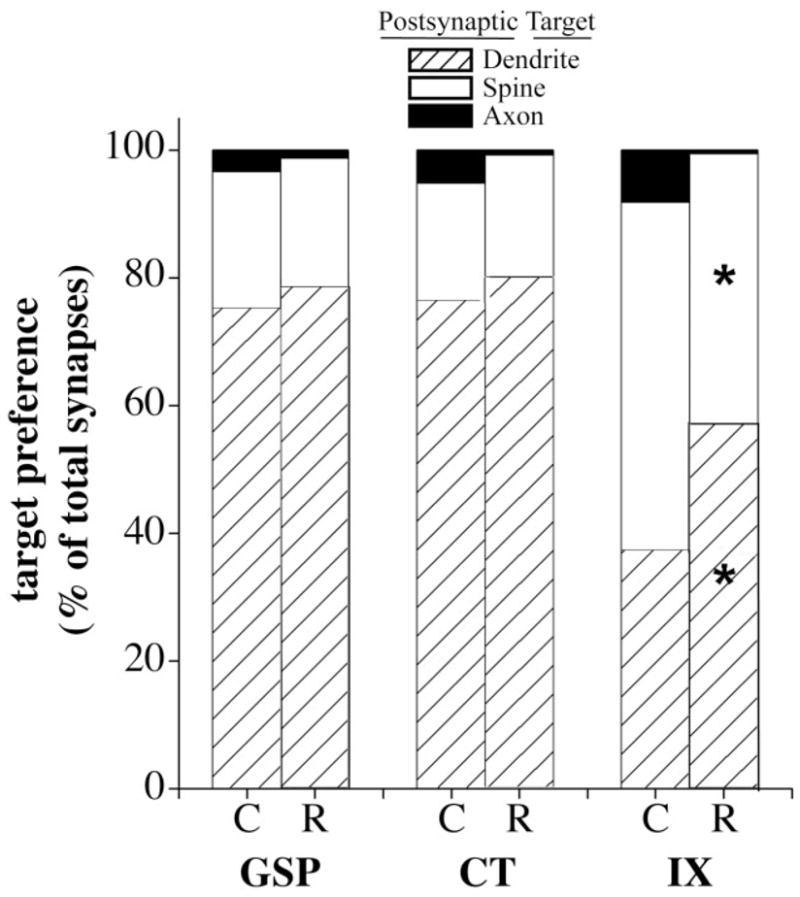
Preference for the postsynaptic targets of GSP, CT, and IX axons in control (C) and sodium-restricted (R) rats. Preference is indicated by the percentage of total synapses terminating on dendrites (hatched bars), spines (open bars), and axons (solid bars). In sodium-restricted rats the majority of synapses of GSP and CT axon terminals occurred on dendrites while the majority of synapses of IX terminals occurred on spines (significance not shown on graph). Compared to controls, a significant shift from the targeting of spines to the targeting of dendrites occurred in IX terminals of sodium-restricted rats (asterisks indicate a statistical significance of P < 0.02 between controls and sodium-restricted rats). Among controls, IX terminals formed synapses more often with spines than with dendrites compared with that of GSP (P = 0.0001) and CT (P = 0.0001) terminals (significance not shown on graph).
Postsynaptic dendrite caliber
In order to derive an estimate of the proximity of the synapse from the postsynaptic soma, the caliber of the postsynaptic dendrites where synapses were made with GSP, CT, and IX terminals were measured. This analysis is based on the assumption that dendritic shafts are conical in shape, tapering away from the soma. We assumed that the closer a dendrite was to the soma, the larger in diameter it would appear. In comparing sodium-restricted rats to controls, there were no measurable differences in the caliber of the postsynaptic dendrites of GSP, CT, and IX terminals. On average, all afferent terminals formed synapses on relatively medium-sized dendrites.
Unlabeled terminal inclusions
An unexpected observation from the brains from sodium-restricted rats was a change in the incidence of unlabeled patches of neuropil encased within labeled terminals (Applegate and Landfield, 1988; Calverley and Jones, 1990; Schuster et al., 1990; Buchs and Muller, 1996). Similar to controls, labeled afferent terminals in sodium-restricted rats contained unlabeled inclusions, which were finger-like protrusions that emerged from postsynaptic profiles or other surrounding neuropil. These protrusions were either dendrites, vesicle-filled profiles, or spines (e.g., Figs. 3, 5). Protrusions were often observed emerging from the perforations of a synapse formed between a labeled terminal and a spine. In control animals, IX terminals had significantly more protrusions than either GSP or CT terminals (May et al., 2007). In sodium-restricted rats the incidences of protrusions in both GSP and IX terminals were not significantly different from their respective controls. In contrast, there was a significant, 5-fold increase in the incidence of these inclusions in CT terminals in sodium-restricted rats compared to controls (P = 0.001; Fig. 9). This increase eliminated the normal difference that was found between CT and IX terminals in control animals. As a result, CT terminals appeared more like IX terminals with respect to number of inclusions.
Fig. 9.
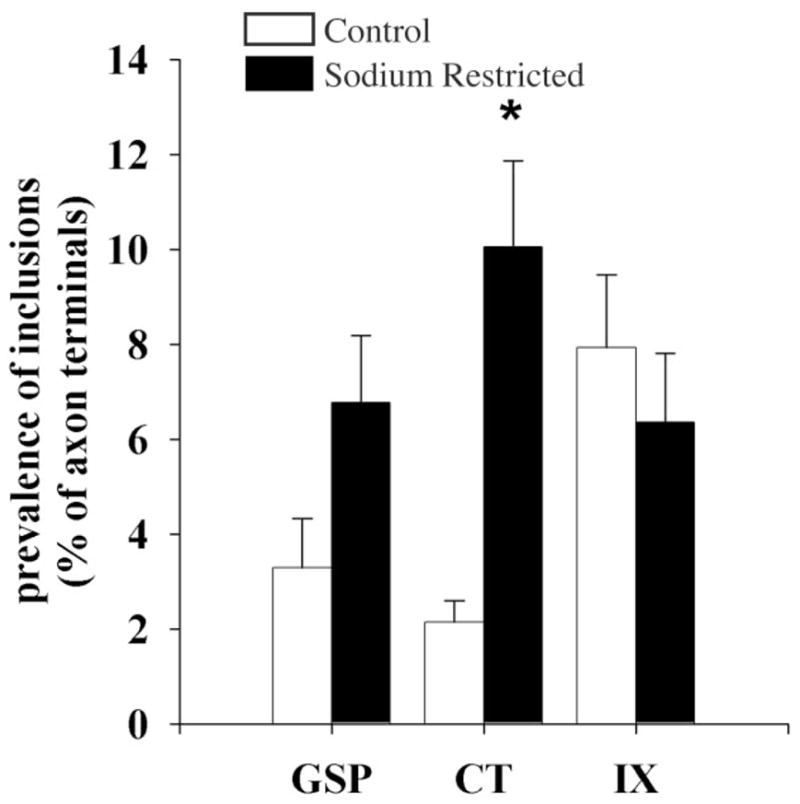
Mean percentage of GSP, CT, and IX axon terminals in control (open bars) and sodium-restricted (solid bars) rats that contained unlabeled inclusions. In sodium-restricted rats CT terminals contained significantly more of these inclusions than controls (asterisk indicates a statistical significance of P < 0.02). Error bars indicate standard error.
Areal axon density
Total axon length was estimated and expressed relative to the area of the region of tissue that was examined in order to provide an estimate of the density of axon segments. Compared to controls, there was an approximate 2- and 4-fold increase in the average total density observed for CT and GSP axons in sodium-restricted rats, respectively (Fig. 10A). The increase in axon density after sodium restriction was 96% for GSP (P = 0.01), 289% for CT (P = 0.0001), and 72% for IX (P = 0.05) nerves. This suggested that the enlargement of the projection fields after sodium restriction for all three afferent nerves were accompanied by axonal branching or proliferation, with increases in the number of axons most evident in CT terminals
Fig. 10.
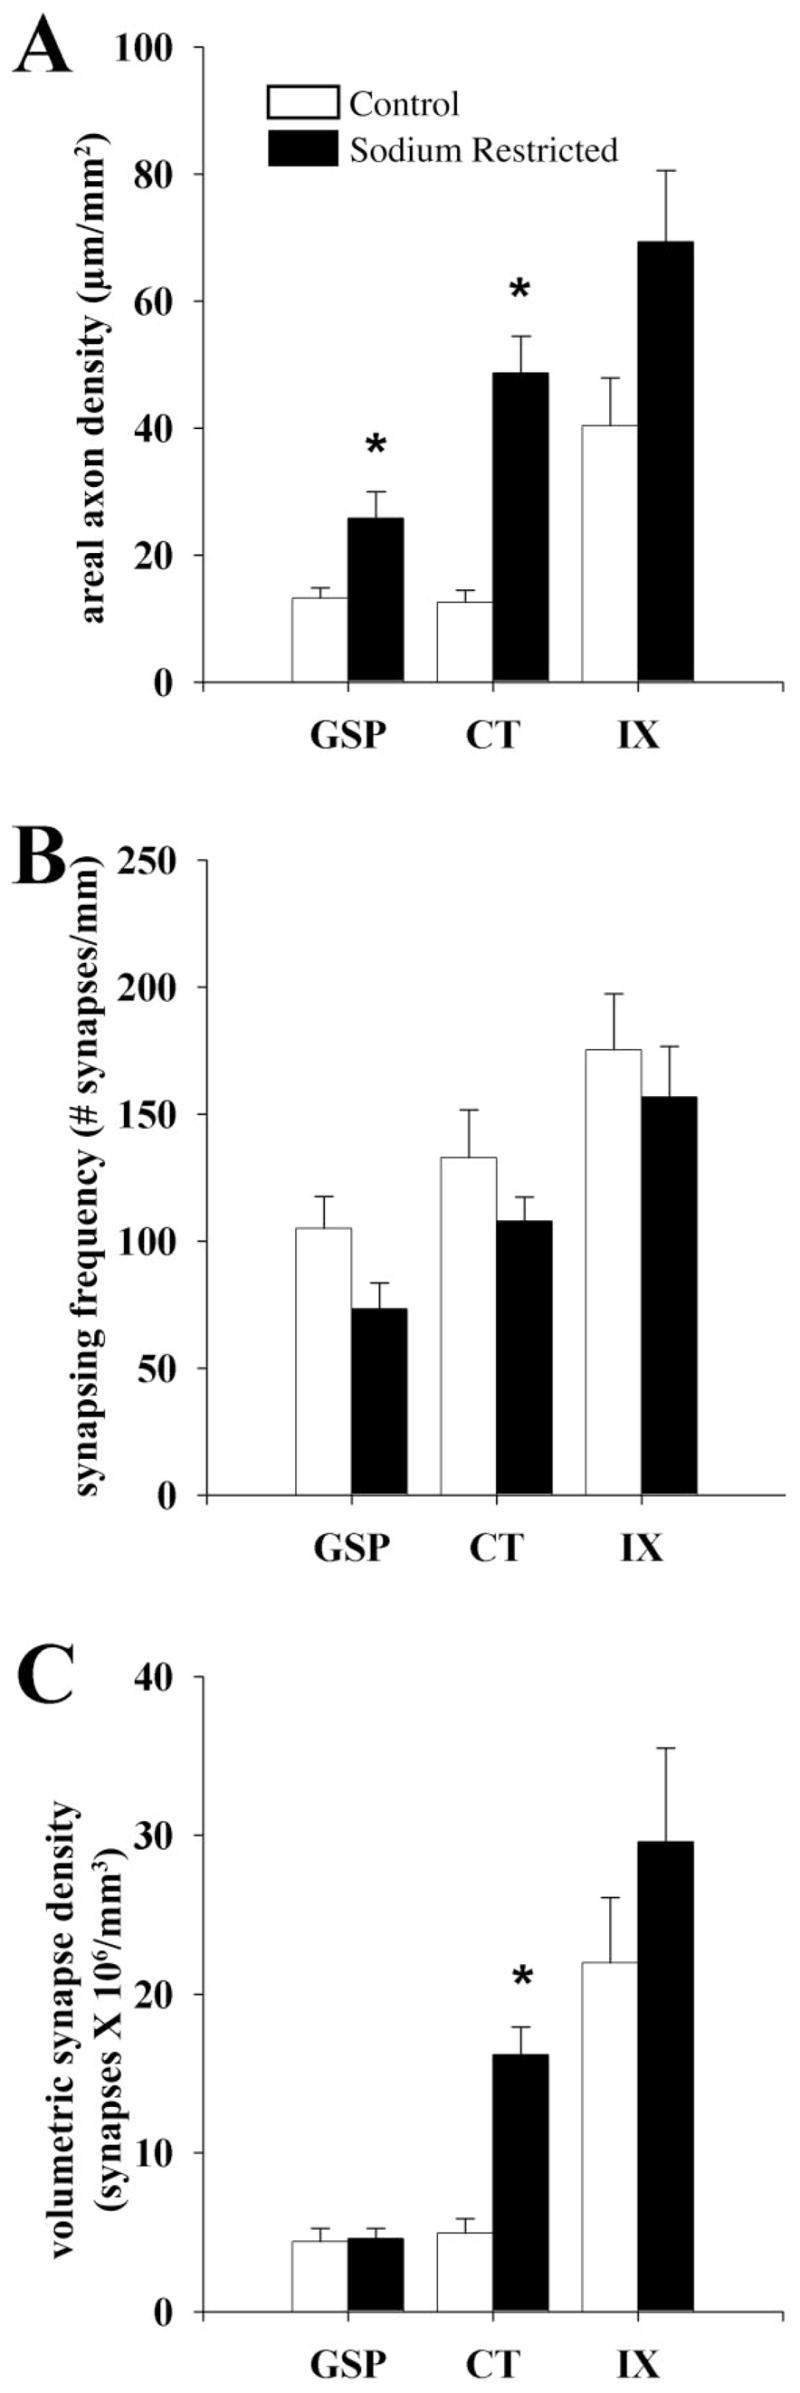
A: Areal axon density of GSP, CT, and IX axons in control (open bars) and sodium-restricted (solid bars) rats per mm2 of the dorsal NTS. Compared to controls the total axon densities of GSP and CT axons were significantly denser upon dietary manipulation (asterisks indicate a statistical significance of P < 0.02). However, the CT and IX axons of sodium-restricted rats were denser than GSP axons located in the same region (significance not shown; P < 0.02). B: Synapsing frequency of DAB-labeled GSP, CT, and IX axon in control (open bars) and sodium-restricted (solid bars) rats. (See Results for interpretation.) Synapses occurred with similar frequency on GSP, CT, and IX axons in sodium-restricted rats compared to controls. However, in comparing the synapse frequency between gustatory axons in sodium-restricted rats, IX axons formed synapses at a significantly higher frequency than GSP and CT axons (significance not shown; P < 0.02). C: Volumetric density of synapses associated with GSP, CT, and IX axons in control (open bars) and sodium-restricted (closed bars) rats. Dietary sodium manipulation resulted in a significant 4-fold increase in the number of synapses present on CT axons compared to controls (asterisk indicates a statistical significance of P < 0.02). In the NTS of sodium-restricted rats, significantly more synapses were associated with CT and IX axons compared to GSP axons (significance not shown; P < 0.02). See Materials and Methods for calculations. Error bars indicate standard error.
Synapsing frequency of axons
The increase in axon density does not automatically imply an increase in synapse density. For example, axons may extend passively as a result of an increase in the components of the underlying neuropil, thereby resulting in sparser synapses along the axon length. To address this question, the frequency at which the axons of GSP, CT, and IX terminals formed synapses was determined by calculating the frequency of a synapse that appeared on an axon segment in sodium-restricted rats and then compared with corresponding frequencies in controls.
There were no diet-related differences in synapsing frequency of GSP, CT, and IX axons compared to controls (Fig. 10B). It should be noted that the trend for synapse density of each afferent axon was to decrease, indicating that passive elongation of axons (i.e., extension without new synapse formation) occurred. No differences in relative pattern of three afferent nerves were present between restricted and control animals (Fig. 10B).
Volumetric density of synapses
In order to detect whether the balance of synaptic inputs from the three nerves were affected within the areas of expansion, the relative density of synapses of labeled axons contained within the measured volume of tissue was compared between GSP, CT, and IX afferent nerves in sodium-restricted and control rats. Compared to controls, there was a significant 4-fold increase in the volumetric density of synapses of CT axons in sodium-restricted rats (P = 0.00001; Fig. 10C). In contrast, compared to their respective controls, there were no significant differences in the volumetric density of synapses from GSP axons and IX axons in sodium-restricted rats (Fig. 10C). In control rats (May et al., 2007), IX axons accounted for the bulk of synapses made by afferent axons in the dorsal NTS. However, in sodium-restricted rats the volumetric density of synapses made by IX axons was not significantly different from the volumetric density of synapses made by CT axons (Fig. 10C). This suggests that the relative synaptic input of CT axons into the region of the NTS that receives information from all three nerves is much greater in sodium-restricted rats.
DISCUSSION
The results of this study reveal for the first time that early environmental manipulations have significant effects on the structural organization of primary afferent axons as they synapse with targets in the gustatory region of the NTS. Sodium restriction instituted during early prenatal ages and continuing throughout development resulted in a significant difference in the organization of neuropil in the zone receiving overlapping inputs from the CT, GSP, and IX compared to rats fed a standard, stock lab chow throughout development (May et al., 2007).
Using EM to reveal alterations in synaptic arrangements, we hypothesized that diet-related alterations in terminal fields would be accompanied by formation of new synapses along the expanded axons. The quantitative analyses revealed that dietary sodium restriction had a dramatic effect on the synaptic connections of CT and relatively minimal effects on the IX and GSP.
Diet-induced changes in axonal and synaptic densities
Under normal dietary conditions the portion of the NTS receiving overlapping input from three afferent nerves contains four times as many IX axon segments than GSP or CT axons (May et al., 2007). Sodium restriction throughout development altered this balance so that CT axons became as dense as IX axons in this zone. Since the frequency of synapse formation along each axon type did not change, the increase in CT axon density led to a 3–4-fold increase in the synapse density of CT terminals per unit area compared to that in controls.
Dietary sodium restriction throughout development led to alterations in synaptic arrangements occurring uniquely for the three nerves concomitantly with the unique changes in terminal fields. The model shown in Figure 11 illustrates the synaptic endings of each nerve in the dorsal NTS resulting from density and frequency measurements of axons and synapses.
Fig. 11.
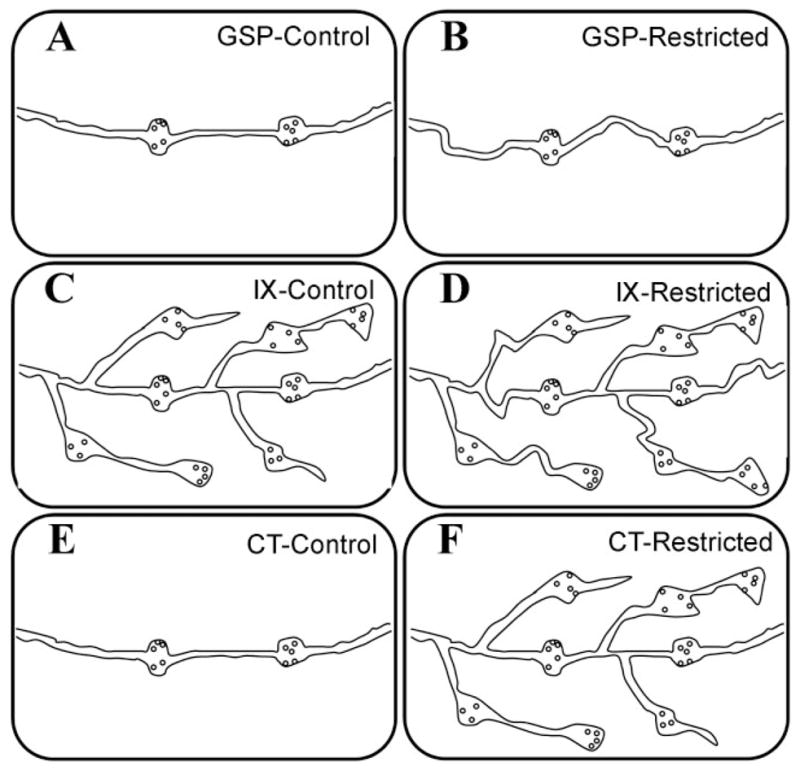
Model of synapse modifications of gustatory primary afferent fibers in the dorsal NTS. GSP, IX, and CT axons of control and sodium-restricted rats form synapses (swellings containing synaptic vesicles) on postsynaptic targets (not illustrated). A, B: GSP: As a result of sodium restriction, axons elongated, yet no changes in synapse formation were evident compared to controls. C, D: IX: Minimal changes occurred for IX axons of sodium-restricted rats compared to controls. In the areas we examined, axonal branching did not significantly increase and the density of synaptic input from this nerve was not altered. Interestingly, however, a larger percentage of IX axon terminals in sodium-restricted rats formed synapses on dendrites compared to controls. E, F: CT: Compared to controls, synapses associated with CT axons in sodium-restricted rats quadrupled in density, and the density of axons in the dorsal zone of the NTS dramatically increased as well. Therefore, compared to controls, CT axon terminals in sodium-restricted rats engaged in more synaptic contacts by increased axonal input. Thus, the fine structure of CT axons may be most profoundly affected by altered afferent nerve activity.
GSP
For GSP axons, sodium restriction throughout development resulted in minimal changes: increased axon density is evident, yet this is not accompanied by changes in synapse formation (Fig. 11A, B), suggesting that existing GSP axon shafts were elongated, or stretched out without new branching or synapse formation. We propose that the elongation of GSP axons is a secondary consequence of neuropil changes in the NTS, and the lack of synaptogenesis in the presence of axon elongation and increased numbers of axons represent a resistance of GSP axons to the dietary manipulation.
IX
Even though dietary sodium restriction leads to an enlargement of the IX terminal field (May and Hill, 2006), excessive axonal branching did not occur within the terminal field area (Fig. 11C, D). Axons did not form more synapses than controls within the area we examined here. Thus, developmental sodium restriction yields minimal change in the IX input to the area of the gustatory NTS receiving overlapping inputs from all three nerves.
While our data do not provide evidence for formation of new IX synapses, there is a degree of diet-related changes for the IX in sodium-restricted rats. Unlike controls, where the majority of large IX terminals form synapses with spines, half of the synapses made by IX terminals were made with dendrites in sodium-restricted rats. This finding suggests that there is a diet-related redistribution of synapses onto their targets and/or a reduction in the spine formation capacity of the cells postsynaptic to IX axons. The functional significance of this diet-related difference is not clear, but the proportional change of synapses made onto dendritic shafts instead of spines may impact how afferent information functionally interacts with other afferent and/or descending inputs onto the same NTS neuron.
CT
In contrast to the GSP and IXth nerves, the synaptic changes of CT axons after dietary restriction are robust (Fig. 11E, F). Sodium restriction uniquely affected the density of both the axons and the synapses associated with CT terminals in the dorsal zone of the gustatory NTS. Specifically, the density of CT synapses in sodium-restricted rats quadrupled compared to control rats. Hence, as a result of sodium restriction, many more CT synapses were added in this region. The net result of the change in the CT was that dietary sodium manipulation resulted in a dramatic disruption of normal synaptic balance among CT, GSP, and IXth nerves. While these added synaptic contacts and increased axonal density are presumably increasingly interspersed with GSP and IX contacts, they do not appear to be displacing GSP and IX synapses of respective postsynaptic targets (i.e., no decrease in synapse frequency or density for GSP or IX). Additionally, the number of spinules associated with CT axons in restricted rats more than quadrupled compared with controls, which may be a result of neuropil rearrangement and/or increased density of postsynaptic targets.
Potential mechanisms involved in wiring of the circuitry
Hypotheses linking the dietary manipulation to the anatomical alterations have focused on activity-dependent effects (King and Hill, 1991; Krimm and Hill, 1997; May and Hill, 2006). Specifically, the development of taste-elicited responses may shape and refine the circuitry in the gustatory NTS. This hypothesis is attractive because the large functional changes to sodium salt taste stimuli in the CT as a result of developmental sodium restriction (Hill, 1987; Hill and Przekop, 1988) are accompanied by changes in the terminations of the CT nerve in the NTS. By comparison, the GSP also responds well to sodium salt taste stimuli (Sollars and Hill, 1998), but the function is unchanged and the terminal fields are unaffected in developmentally sodium-restricted rats (Sollars and Hill, 2000). Therefore, the nerve that changes the most functionally following sodium restriction (CT) shows the largest changes in terminal field and fine structure. Conversely, the nerve that does not change functionally following developmental sodium restriction (GSP) shows little to no change in terminal field and fine structure. We propose that the enlargement of all terminal fields early in development seen in controls (Mangold and Hill, 2005) are “pruned” (Kantor and Kolodkin, 2003) to their mature size and shape by way of taste-evoked activity. “Freezing” afferent nerve activity at an immature state, as is the CT in sodium-restricted rats (Hill, 1987; Hill and Przekop, 1988), results in a lack of pruning (Sollars et al., 2006).
While an activity-dependent hypothesis is consistent with findings from the CT and GSP, it may not fully account for the reorganization of the IX. The IX is not particularly sensitive to sodium taste stimuli (Formaker and Hill, 1991; Kitada et al., 1998), yet there are widespread changes in its terminal field in sodium-restricted rats. Furthermore, the dietary manipulation is implemented and terminal fields mature before taste receptors are fully developed functionally (Mistretta, 1972; Lasiter et al., 1989; Lasiter, 1992). We must stress here, however, that taste responses from the IX have not been recorded during normal development or in developmentally sodium-restricted rats. Thus, further work may show that indeed the diet-related changes in IX may also be activity dependent.
Implications for function and behavior
As a result of the modification of the axonal input from each gustatory afferent nerve by developmental sodium restriction, corresponding functional alterations are also likely to occur. Indeed, changes in synaptic morphology can alter synaptic function and affect postsynaptic cell targeting (Calverley and Jones, 1990). Furthermore, spine motility and dendritic restructuring, as noted by the observation of increased postsynaptic protrusions for the CT in sodium-restricted rats, can modulate the availability of postsynaptic targets (Dunaevsky et al., 2001; Deng and Dunaevsky, 2005) and lead to functional changes. Therefore, the normal inputs of individual gustatory afferent axons onto NTS cells may be grossly altered as a result of dietary sodium restriction.
Presumably, such changes in the connectivity of gustatory afferent nerves would be reflected in the functional output of NTS cells. Interestingly, a selective decrease in taste responses to sodium salt stimuli occurs in NTS neurons driven by stimulation of taste receptors of the CT nerve in sodium-restricted rats (Vogt and Hill, 1993). This appears to be inconsistent with current results because the higher density of synapses in sodium-restricted rats should produce greater responses in the NTS. However, the CT in sodium-restricted rats is poorly sensitive to salt stimulation because of a lack of functional transduction elements in the taste receptor cells (Hill and Bour, 1985; Hill, 1987; Ye et al., 1993). Following dietary sodium repletion, the function of peripheral and central taste neurons change dramatically. NTS neurons become supersensitive to sodium salt taste stimulation upon repletion of dietary sodium at adulthood (Vogt and Hill, 1993). We propose that CT processes and synapses in the NTS of sodium-restricted rats adapt to the deprivation by proliferation. Then, upon repletion of dietary sodium at adulthood, taste receptor cell and CT nerve function “recovers” to normal (Hill, 1987). The normal peripheral function combined with increased synaptic input leads to signal amplification onto NTS cells (Vogt and Hill, 1993). These functional alterations in the NTS circuitry, in turn, likely affect taste-mediated behaviors (Thaw et al., 2000) and could influence other taste-related homeostatic systems.
In conclusion, dietary sodium restriction uniquely and specifically affects the wiring of the NTS, suggesting the importance of proper activity in establishing and maintaining appropriate function of central gustatory circuitry. These results further illustrate the significant amount of susceptibility of the gustatory brainstem to experimental manipulations and can be used as a model for examining the synaptic interactions of three overlapping nerves as they project to their central target.
Acknowledgments
Grant sponsor: National Institutes of Health (NIH); Grant numbers: DC00407 and DC06332.
LITERATURE CITED
- Applegate MD, Landfield PW. Synaptic vesicle redistribution during hippocampal frequency potentiation and depression in young and aged rats. J Neurosci. 1988;8:1096 –1111. doi: 10.1523/JNEUROSCI.08-04-01096.1988. [DOI] [PMC free article] [PubMed] [Google Scholar]
- Bradley RM, editor. The role of the nucleus of the solitary tract in gustatory processing. New York: CRC, Taylor and Francis; 2007. [PubMed] [Google Scholar]
- Buchs PA, Muller D. Induction of long-term potentiation is associated with major ultrastructural changes of activated synapses. Proc Natl Acad Sci U S A. 1996;93:8040 – 8045. doi: 10.1073/pnas.93.15.8040. [DOI] [PMC free article] [PubMed] [Google Scholar]
- Buonomano DV, Merzenich MM. Cortical plasticity: from synapses to maps. Annu Rev Neurosci. 1998;21:149 –186. doi: 10.1146/annurev.neuro.21.1.149. [DOI] [PubMed] [Google Scholar]
- Calverley RK, Jones DG. Contributions of dendritic spines and perforated synapses to synaptic plasticity. Brain Res Brain Res Rev. 1990;15:215–249. doi: 10.1016/0165-0173(90)90002-6. [DOI] [PubMed] [Google Scholar]
- Colonnier M. Synaptic patterns on different cell types in the different laminae of the cat visual cortex. An electron microscope study. Brain Res. 1968;9:268 –287. doi: 10.1016/0006-8993(68)90234-5. [DOI] [PubMed] [Google Scholar]
- Colonnier M, Beaulieu C. An empirical assessment of stereological formulae applied to the counting of synaptic disks in the cerebral cortex. J Comp Neurol. 1985;231:175–179. doi: 10.1002/cne.902310205. [DOI] [PubMed] [Google Scholar]
- DeFelipe J, Marco P, Busturia I, Merchan-Perez A. Estimation of the number of synapses in the cerebral cortex: methodological considerations. Cereb Cortex. 1999;9:722–732. doi: 10.1093/cercor/9.7.722. [DOI] [PubMed] [Google Scholar]
- Deng J, Dunaevsky A. Dynamics of dendritic spines and their afferent terminals: spines are more motile than presynaptic boutons. Dev Biol. 2005;277:366 –377. doi: 10.1016/j.ydbio.2004.09.028. [DOI] [PubMed] [Google Scholar]
- Dunaevsky A, Blazeski R, Yuste R, Mason C. Spine motility with synaptic contact. Nat Neurosci. 2001;4:685– 686. doi: 10.1038/89460. [DOI] [PubMed] [Google Scholar]
- Erickson RP. Nontraumatic headholder for rats. Physiol Behav. 1966;1:97–98. [Google Scholar]
- Erisir A, Dreusicke M. Quantitative morphology and postsynaptic targets of thalamocortical axons in critical period and adult ferret visual cortex. J Comp Neurol. 2005;485:11–31. doi: 10.1002/cne.20507. [DOI] [PubMed] [Google Scholar]
- Erisir A, Harris JL. Decline of the critical period of visual plasticity is concurrent with the reduction of NR2B subunit of the synaptic NMDA receptor in layer 4. J Neurosci. 2003;23:5208 –5218. doi: 10.1523/JNEUROSCI.23-12-05208.2003. [DOI] [PMC free article] [PubMed] [Google Scholar]
- Formaker BK, Hill DL. Lack of amiloride sensitivity in SHR and WKY glossopharyngeal taste responses to NaCl. Physiol Behav. 1991;50:765–769. doi: 10.1016/0031-9384(91)90015-g. [DOI] [PubMed] [Google Scholar]
- Frazier LL, Brunjes PC. Unilateral odor deprivation: early postnatal changes in olfactory bulb cell density and number. J Comp Neurol. 1988;269:355–370. doi: 10.1002/cne.902690304. [DOI] [PubMed] [Google Scholar]
- Guillery RW. On counting and counting errors. J Comp Neurol. 2002;447:1–7. doi: 10.1002/cne.10221. [DOI] [PubMed] [Google Scholar]
- Guillery RW, August BK. Doubt and certainty in counting. Prog Brain Res. 2002;135:25– 42. doi: 10.1016/S0079-6123(02)35005-2. [DOI] [PubMed] [Google Scholar]
- Halsell CB, Travers SP, Travers JB. Ascending and descending projections from the rostral nucleus of the solitary tract originate from separate neuronal populations. Neuroscience. 1996;72:185–197. doi: 10.1016/0306-4522(95)00528-5. [DOI] [PubMed] [Google Scholar]
- Harris RM, Woolsey TA. Dendritic plasticity in mouse barrel cortex following postnatal vibrissa follicle damage. J Comp Neurol. 1981;196:357–376. doi: 10.1002/cne.901960302. [DOI] [PubMed] [Google Scholar]
- Hayat MA. Biological applications. New York: Cambridge University Press; 2000. Principles and techniques of electron microscopy. [Google Scholar]
- Hill DL. Susceptibility of the developing rat gustatory system to the physiological effects of dietary sodium deprivation. J Physiol (Lond) 1987;393:413– 424. doi: 10.1113/jphysiol.1987.sp016830. [DOI] [PMC free article] [PubMed] [Google Scholar]
- Hill DL, Bour TC. Addition of functional amiloride-sensitive components to the receptor membrane: a possible mechanism for altered taste responses during development. Brain Res. 1985;352:310 –313. doi: 10.1016/0165-3806(85)90121-x. [DOI] [PubMed] [Google Scholar]
- Hill DL, Przekop PR., Jr Influences of dietary sodium on functional taste receptor development: a sensitive period. Science. 1988;241:1826 –1828. doi: 10.1126/science.3175625. [DOI] [PubMed] [Google Scholar]
- Hubel DH, Wiesel TN. The period of susceptibility to the physiological effects of unilateral eye closure in kittens. J Physiol. 1970;206:419 – 436. doi: 10.1113/jphysiol.1970.sp009022. [DOI] [PMC free article] [PubMed] [Google Scholar]
- Kantor DB, Kolodkin AL. Curbing the excesses of youth: molecular insights into axonal pruning. Neuron. 2003;38:849 – 852. doi: 10.1016/s0896-6273(03)00364-7. [DOI] [PubMed] [Google Scholar]
- Katz LC, Crowley JC. Development of cortical circuits: lessons from ocular dominance columns. Nat Rev Neurosci. 2002;3:34 – 42. doi: 10.1038/nrn703. [DOI] [PubMed] [Google Scholar]
- King CT, Hill DL. Dietary sodium chloride deprivation throughout development selectively influences the terminal field organization of gustatory afferent fibers projecting to the rat nucleus of the solitary tract. J Comp Neurol. 1991;303:159 –169. doi: 10.1002/cne.903030114. [DOI] [PubMed] [Google Scholar]
- Kitada Y, Mitoh Y, Hill DL. Salt taste responses of the IXth nerve in Sprague-Dawley rats: lack of sensitivity to amiloride. Physiol Behav. 1998;63:945–949. doi: 10.1016/s0031-9384(98)00009-2. [DOI] [PubMed] [Google Scholar]
- Krimm RF, Hill DL. Early prenatal critical period for chorda tympani nerve terminal field development. J Comp Neurol. 1997;378:254 –264. [PubMed] [Google Scholar]
- Lasiter PS. Postnatal development of gustatory recipient zones within the nucleus of the solitary tract. Brain Res Bull. 1992;28:667– 677. doi: 10.1016/0361-9230(92)90245-s. [DOI] [PubMed] [Google Scholar]
- Lasiter PS. Effects of orochemical stimulation on postnatal development of gustatory recipient zones within the nucleus of the solitary tract. Brain Res Bull. 1995;38:1–9. doi: 10.1016/0361-9230(95)00063-k. [DOI] [PubMed] [Google Scholar]
- Lasiter PS, Diaz J. Artificial rearing alters development of the nucleus of the solitary tract. Brain Res Bull. 1992;29:407– 410. doi: 10.1016/0361-9230(92)90076-a. [DOI] [PubMed] [Google Scholar]
- Lasiter PS, Kachele DL. Effects of early postnatal receptor damage on development of gustatory recipient zones within the nucleus of the solitary tract. Brain Res Dev Brain Res. 1990;55:57–71. doi: 10.1016/0165-3806(90)90106-9. [DOI] [PubMed] [Google Scholar]
- Lasiter PS, Wong DM, Kachele DL. Postnatal development of the rostral solitary nucleus in rat: dendritic morphology and mitochondrial enzyme activity. Brain Res Bull. 1989;22:313–321. doi: 10.1016/0361-9230(89)90059-2. [DOI] [PubMed] [Google Scholar]
- Mangold JE, Hill DL. Postnatal development of gustatory nerve terminal fields in control rats. Chem Senses. 2005;30:A126. [Google Scholar]
- Mangold JE, Hill DL. Extensive reorganization of primary afferent projections into the gustatory brainstem induced by feeding a sodium-restricted diet during development: less is more. J Neurosci. 2007;27:4650 –4662. doi: 10.1523/JNEUROSCI.4518-06.2007. [DOI] [PMC free article] [PubMed] [Google Scholar]
- May OL, Hill DL. Gustatory terminal field organization and developmental plasticity in the nucleus of the solitary tract revealed through triple-fluorescence labeling. J Comp Neurol. 2006;497:658 – 669. doi: 10.1002/cne.21023. [DOI] [PMC free article] [PubMed] [Google Scholar]
- May OL, Erisir A, Hill DL. Ultrastructure of primary afferent terminals and synapses in the rat nucleus of the solitary tract: comparison among the greater superficial petrosal, chorda tympani, and glossopharyngeal nerves. J Comp Neurol. 2007;502:1066 –1078. doi: 10.1002/cne.21371. [DOI] [PMC free article] [PubMed] [Google Scholar]
- Mistretta CM. Topographical and histological study of the developing rat tongue, palate and taste buds. In: Bosma JF, editor. Third symposium on oral sensation and perception. Springfield, IL: Thomas; 1972. pp. 163–187. [Google Scholar]
- Peters A, Kaiserman-Abramof IR. The small pyramidal neuron of the rat cerebral cortex. The synapses upon dendritic spines. Z Zellforsch Mikrosk Anat. 1969;100:487–506. doi: 10.1007/BF00344370. [DOI] [PubMed] [Google Scholar]
- Peters A, Palay SL, Webster Hd. Fine structure of the nervous system. New York: Harper and Row; 1970. [Google Scholar]
- Pierce JP, Lewin GR. An ultrastructural size principle. Neuroscience. 1994;58:441– 446. doi: 10.1016/0306-4522(94)90071-x. [DOI] [PubMed] [Google Scholar]
- Pittman DW, Contreras R. Dietary NaCl influences the organization of chorda tympani neurons projecting to the nucleus of the solitary tract in rats. Chem Senses. 2002;27:333–341. doi: 10.1093/chemse/27.4.333. [DOI] [PubMed] [Google Scholar]
- Schuster T, Krug M, Wenzel J. Spinules in axospinous synapses of the rat dentate gyrus: changes in density following long-term potentiation. Brain Res. 1990;523:171–174. doi: 10.1016/0006-8993(90)91654-y. [DOI] [PubMed] [Google Scholar]
- Shepherd GM, Pologruto TA, Svoboda K. Circuit analysis of experience-dependent plasticity in the developing rat barrel cortex. Neuron. 2003;38:277–289. doi: 10.1016/s0896-6273(03)00152-1. [DOI] [PubMed] [Google Scholar]
- Smith ZD, Gray L, Rubel EW. Afferent influences on brainstem auditory nuclei of the chicken: n. laminaris dendritic length following monaural conductive hearing loss. J Comp Neurol. 1983;220:199–205. doi: 10.1002/cne.902200207. [DOI] [PubMed] [Google Scholar]
- Sollars SI, Hill DL. Taste responses in the greater superficial petrosal nerve: substantial sodium salt and amiloride sensitivities demonstrated in two rat strains. Behav Neurosci. 1998;112:991–1000. doi: 10.1037//0735-7044.112.4.991. [DOI] [PubMed] [Google Scholar]
- Sollars SI, Hill DL. Lack of functional and morphological susceptibility of the greater superficial petrosal nerve to developmental dietary sodium restriction. Chem Senses. 2000;25:719 –727. doi: 10.1093/chemse/25.6.719. [DOI] [PubMed] [Google Scholar]
- Sollars SI, Walker BR, Thaw AK, Hill DL. Age-related decrease of the chorda tympani nerve terminal field in the nucleus of the solitary tract is prevented by dietary sodium restriction during development. Neuroscience. 2006;137:1229 –1236. doi: 10.1016/j.neuroscience.2005.09.040. [DOI] [PMC free article] [PubMed] [Google Scholar]
- Thaw AK, Frankmann S, Hill DL. Behavioral taste responses of developmentally NaCl-restricted rats to various concentrations of NaCl. Behav Neurosci. 2000;114:437– 441. [PubMed] [Google Scholar]
- Vogt MB, Hill DL. Enduring alterations in neurophysiological taste responses after early dietary sodium deprivation. J Neurophysiol. 1993;69:832– 841. doi: 10.1152/jn.1993.69.3.832. [DOI] [PubMed] [Google Scholar]
- Whitehead MC. Neuronal architecture of the nucleus of the solitary tract in the hamster. J Comp Neurol. 1988;276:547–572. doi: 10.1002/cne.902760409. [DOI] [PubMed] [Google Scholar]
- Ye Q, Stewart RE, Heck GL, Hill DL, DeSimone JA. Dietary Na(+)-restriction prevents development of functional Na+ channels in taste cell apical membranes: proof by in vivo membrane voltage perturbation. J Neurophysiol. 1993;70:1713–1716. doi: 10.1152/jn.1993.70.4.1713. [DOI] [PubMed] [Google Scholar]


