Abstract
Knowing of the spatial extent of neural activation around extracellular stimulating electrodes is necessary to ensure that only the desired neurons are activated or to determine which neurons are responsible for an observed response. Various approaches have been used to estimate the current-distance relationship and thereby the spatial extent of activation resulting from extracellular stimulation. However, these approaches all require underlying assumptions and simplifications, and since the actual extent of activation cannot be directly measured, the impact of deviations from these assumptions cannot be determined. We implemented a computer-based model of excitation of a population of nerve fibers and used the model to evaluate a range of approaches proposed for measuring the spatial extent of neural activation. The estimates with each method were compared with measurements of the true spatial extent of activation that were accessible in the simulations to quantify the accuracy of the estimates and to determine the dependence of accuracy on measurement parameters (interelectrode distance, stimulation amplitude, noise). A newly proposed method, based on the refractory interaction technique, provided the most accurate and most robust estimates of the spatial extent of neural activation.
Keywords: electrical stimulation, current distance relationship, spatial selectivity, nerve model
1. INTRODUCTION
Electrical stimulation of neural tissue is used to restore motor and sensory function (Grill and Kirsch, 2000) and as a tool to understand neural circuitry and determine causal links between structure, function, and behavior (Tehovnik, 1996). In many applications, it is important to determine which neurons are excited when an electrical stimulus is applied. Knowledge of the spatial extent of activation around the electrode(s) is necessary to ensure that only the desired groups of neurons are activated, or to determine which neurons are responsible for an observed response. In addition, new generations of neural prostheses use microelectrode arrays intended to provide independent channels of stimulation, and the overlap of activated regions between electrodes should be minimized for effective use of each electrode in the array. Determining the spatial selectivity of stimulation requires determination of the distance from each electrode to the furthest activated neurons (Rutten et al., 1991; Yoshida and Horch, 1993; Branner et al., 2001; Abbas et al., 2004; Snow et al., 2006). In the present study computer simulation was used to evaluate the effectiveness of several different experimental methods to determine the spatial extent of neural activation by extracellular electrical stimulation.
Several approaches have been developed to provide an analytic expression for the spatial extent of activation based on biophysical principles (Stoney et al., 1968; Bean, 1974; Hentall, 1987; Rubinstein, 1991; Nowak and Bullier, 1996). However, analytical expressions are possible only with extensive simplifications, and therefore the results may not be generalizable. The spatial extent of activation depends not only on the stimulation parameters and waveform, but also on the size, shape and orientation of the electrode, the electrical properties of the volume conductor, the size, shape and electrical properties of the neuronal elements around the electrode, and the degree and pattern of neural survival (Hentall et al., 1984; Abbas et al., 2004). Therefore, it is desirable to measure the extent of activation separately for each electrode placement, but it is often difficult to determine directly the activated region, since neither the neural responses nor the position of individual neurons may be accessible. Therefore, a number of empirical methods have been developed to measure the spatial extent of activation during extracellular stimulation.
The general approach to describe the spatial extent of activation is to establish a current threshold - distance relationship (CDR) by moving an electrode past a neuron (Tehovnik, 1996). By recording the response of that neuron, the thresholds to activate the neuron are obtained for different positions of the stimulating electrode. This CDR is then used to predict the spatial extent of activation for different stimulus amplitudes. Using this method, CDRs have been measured in many different parts of the nervous system (Ranck, 1975). Although there is evidence that the current distance relationship may be linear or cubic for certain ranges of electrode to neuron distances (Bean, 1974; Marcus et al., 1979; Hentall et al., 1984), the CDR can best be approximated by a quadratic equation (Tehovnik, 1996),
| (1) |
where I0 is the absolute threshold and k is the current distance constant. To predict the spatial extent of activation using the CDR, one must assume that the behavior of the studied neuron is representative of the behavior of all the neurons around the electrode, regardless of the differences in orientation or excitability, and that activation spreads symmetrically in space regardless of inhomogeneity or anisotropy of the tissue electrical properties. Further, measurement of the CDR generally requires direct recording of the response of the targeted neuron, but in many instances, only behavioral or end organ responses to stimulation can be determined.
These challenges motivated the development of alternatives to direct measurement of the CDR to determine the spatial extent of activation during extracellular stimulation (see Section 2.1). However these methods all require simplifying assumptions that may introduce errors, and it is difficult to determine the magnitude of these errors, because the actual spatial extent of activation cannot be measured directly – otherwise these methods would be superfluous. On the other hand, computer simulation enables systematic and direct evaluation of methods to estimate the spatial extent of activation under highly controlled conditions that would be difficult to achieve experimentally. We used computer simulation to implement and evaluate different methods for measuring the spatial extent of neural activation. In contrast to experimental implementation of any of the methods, in the simulations we had access to the exact position of individual neurons and their responses to stimulation. This provided a measure of the actual spatial extent of activation and enabled systematic and quantitative comparisons of the different methods. We also propose and evaluate a new method to measure the spatial extent of activation based on the refractory interaction technique, which enables determination of the two parameters of the CDR.
2. METHODS
2.1 Theory of Methods to Measure the Spatial Extent of Activation
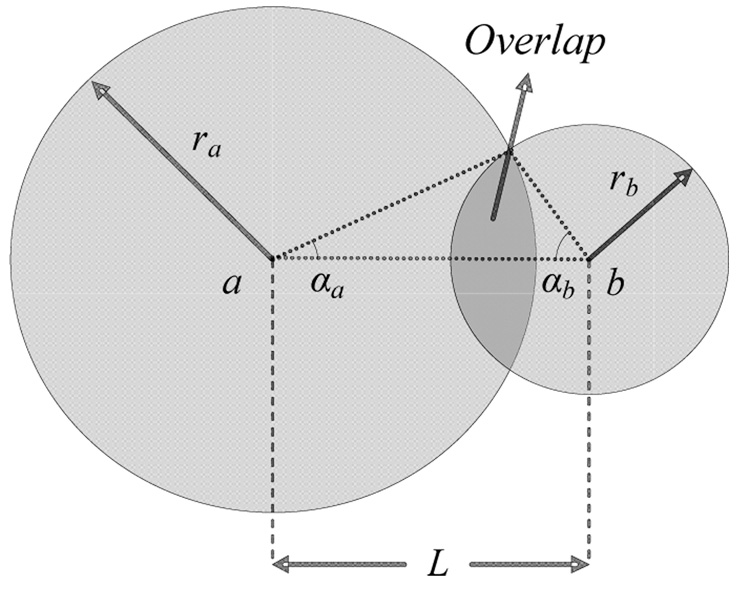
In this section the general method used to measure the spatial extent of neural activation is described mathematically using a geometric model, and then different specific methods are derived from this general model. Several methods make use of the refractory interaction technique (RIT). The RIT is based on the interactions between the regions activated by two electrodes at a specified distance L from each other (Fig. 1) when stimuli are delivered within the refractory period of the activated neurons. When stimulus Ia is applied by electrode A, it activates Na neurons in a region around the electrode, Aa, which produces response Ra. Similarly, applying Ib to electrode B, activates Nb neurons in a region Ab, which produces response Rb. If Ib is applied following a delay, when the neurons Na are in their refractory period and therefore cannot respond to stimulus Ib, the total response to both pulses, Rab, will depend on the spatial overlap between the activated regions, Aa and Ab, and will be less than the arithmetic sum of responses to the two stimuli delivered separately, Ra+Rb.
Fig. 1.
Geometric model of the region of overlapping activation between two electrodes separated by interelectrode distance L.
The overlap between the two regions of activation can be defined based on the responses, as
| (2) |
Assuming that the response is proportional to the number of activated neurons, one can write:
| (3) |
Considering a uniform distribution of neurons in the medium, this ratio can be related to the geometry of the activated regions (Fig. 1)
| (4) |
and from the geometry:
| (5) |
| (6) |
| (7) |
In addition, the current-distance equations can be written for each electrode
| (8) |
| (9) |
By measuring the responses Ra, Rb and Rab, one can solve these equations numerically to obtain current distance constant, k.
The method proposed by Yeomans et al. (1986) is the approach described above, with equal values for Ia and Ib, and related the increase in the stimulation frequency threshold due to overlap to the spatial extent of the activated regions, so that it was possible to estimate the current distance constant for any stimulus amplitude that resulted in some overlap.
Similarly, Snow et al. (2006) used the same approach but considered 3-dimensional geometric models of spherical activated regions to study stimulation of cell bodies in the spinal cord, and related the degree of overlap to evoked force responses. In addition, they considered a different definition of overlap as follows:
| (10) |
and
| (11) |
In a special case of the general model described above, when Aa and Ab have just touched, the overlap is zero and the above equations reduce to:
| (12) |
and k can be calculated from the following simple equation:
| (13) |
This special case was proposed by Fouriezos and Wise (1984) considering equal values for Ia and Ib, and while it was possible to obtain the current distance constant, k, from each experiment, they combined the data from five separate experiments to estimate both parameters of the quadratic CDR, I0 and k.
Liang et al. (1991) used refractory interaction between responses evoked by different electrodes on an electrode array to obtain the CDR directly. They considered another special case, when Ib produces the minimum detectable response Rb, and Ia was found such that it prevented neurons in Ab from responding to Ib. This happens when the activation region of Ia, Aa, covers the activation region of Ib, Ab. Since Ib is very small, Ab would be very small and close to electrode B. Therefore radius of Aa, ra, should be close to interelectrode distance, L:
| (14) |
and
| (15) |
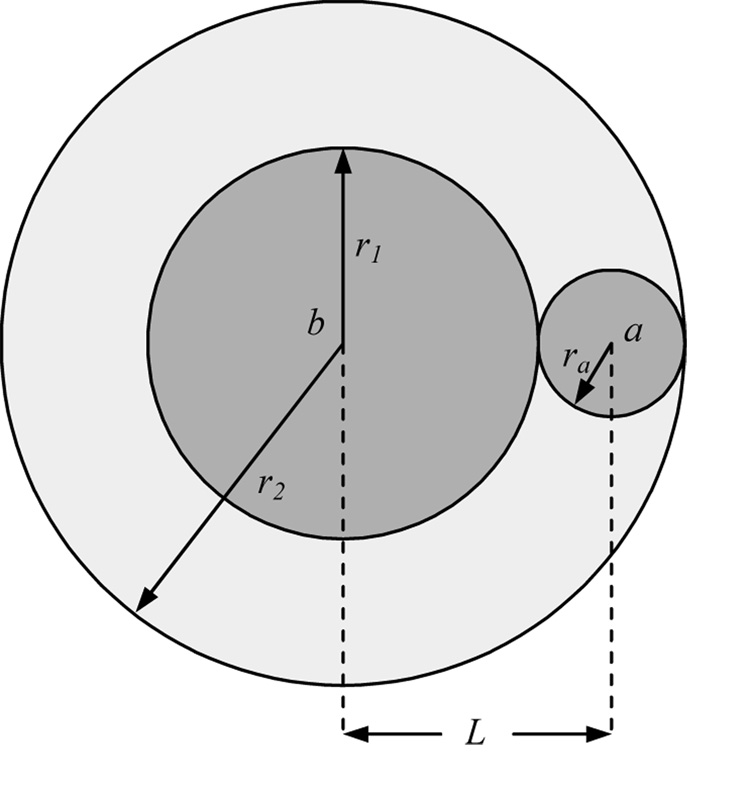
We propose a new method that combines two special cases of the general model of the RIT to calculate the CDR. An arbitrary amplitude stimulus, Ia, is applied to electrode A and the amplitudes to electrode B are obtained for minimum and full overlap, named I1 and I2 respectively (Fig. 2). The equations for these two special cases may be combined to compute both parameters of the quadratic CDR:
| (16) |
| (17) |
| (18) |
By solving these equations, I0 and k can be obtained based on the expressions:
| (19) |
| (20) |
Fig. 2.
Geometric model of the region of overlapping activation between two electrodes illustrating minimum and full overlap.
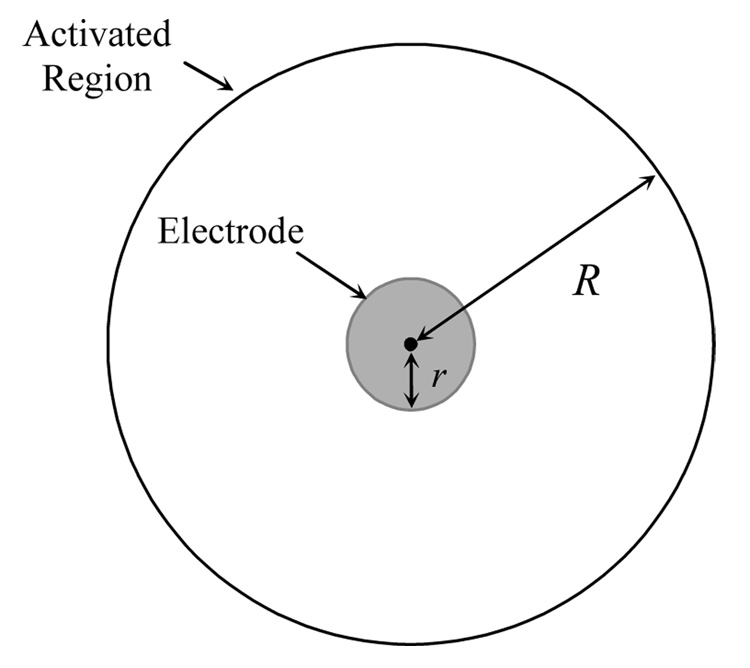
As an alternative to the RIT, Milner and Laferriere (1986) proposed a method to measure the extent of activation using differently sized stimulating electrodes. The current amplitudes that generate an equivalent response are obtained for two electrodes with different sizes, and geometric models of the activation zones are used to calculate the spatial extent of activation for each electrode. Consider a spherical electrode with diameter of r that is placed in the middle of a population of nerve fibers. If stimulation with amplitude I is applied to the electrode, fibers up to distance R from the center of the electrode will be activated (Fig. 3). It is assumed that the response to stimulation I is proportional to the number of activated fibers. Considering a homogeneous distribution of fibers, this would be proportional to the area of the activated region.
| (21) |
Further, it is assumed that a fiber responds to a stimulus if the extracellular current density is higher than a threshold. Therefore the current density threshold is equal to the current density at the boundary of activated region. The surface area of the sphere within which the fibers are activated is equal to:
| (22) |
Therefore, the threshold current density is equal to
| (23) |
JTh is considered constant for different electrodes. By obtaining the stimulus amplitudes Ir for differently sized electrodes that produce the same responses (i.e., equal A), simultaneous equations are formed that can be solved to determine JTh and A. The area of the activated region, A, can then be used to determine the spatial extent of activation from Eq. (21)
Fig. 3.
A spherical electrode with radius r, and the activated region with radius R.
2.2 Model of neural population
The methods for measuring the spatial extent of activation during extracellular stimulation were evaluated by simulating electrical stimulation of a population of nerve fibers. The geometric characteristics of the model were based on anatomical data for the branch of sciatic nerve innervating the medial gastrocnemius. Four hundred alpha motoneuron nerve fibers were uniformly distributed within a cylindrical nerve trunk, 400 µm in diameter (Eccles and Sherrington 1930). Stimulation was applied monopolarly through point electrodes and the return electrode was considered at infinity. The volume conductor was assumed infinite and homogeneous but anisotropic with longitudinal resistivity ρl =200Ωcm and transverse resistivity ρt =1250Ωcm (Deurloo et al., 1998). The potential was calculated analytically as (Nicholson, 1967; Wait, 1990):
| (24) |
A previously developed and validated cable model of a mammalian nerve fiber (McIntyre et al., 2002) was implemented in NEURON V6.0 (Hines and Carnevale, 1997) and solved using a variable-step DASPK integrator with an absolute tolerance of 0.001. The original model reproduces the temporal dynamics of excitability, strength-duration properties, and current distance properties of mammalian nerve fibers, and the current implementation was validated by repeating the simulations reported in McIntyre et al. (2002). Fiber diameters were selected randomly from a normal distribution with mean 13.6 µm and variance 1.55 µm2 based on the measurements of Eccles and Sherrington (1930). Subsequently the diameters of different sections of the model fibers were calculated by interpolation of the data presented in Table 1 of McIntyre et al. (2002). Each fiber had 20 nodes of Ranvier and the electrodes were placed near the 10th node. The longitudinal position of the nearest node to the electrode was selected randomly from a uniform distribution. Three separate populations were generated with different randomly selected nerve fiber diameters and positions. Cathodic, monophasic 100 µs duration pulses were used for stimulation. Action potentials were detected at the end of each nerve fiber as an increase of the transmembrane potential to 0 mV. The percentage of activated fibers was measured as the response of the population to stimulation.
Table I.
Parameters of the current-distance relationship estimated from direct measurements from single nerve fibers.
| Fiber No. | 1 | 2 | 3 | Mean±SD | ||||
|---|---|---|---|---|---|---|---|---|
| Distribution | I0 | k | I0 | k | I0 | k | I0(µA) | K (µA/mm2) |
| 1 | 9.8 | 194.4 | 22.2 | 163.3 | 4.5 | 224.5 | 10.0±2.7 | 200±5.0 |
| 2 | 9.7 | 208.1 | 16.4 | 185.2 | 6.5 | 218.2 | ||
| 3 | 7.9 | 182.7 | 4.2 | 227.1 | 9.0 | 193.2 | ||
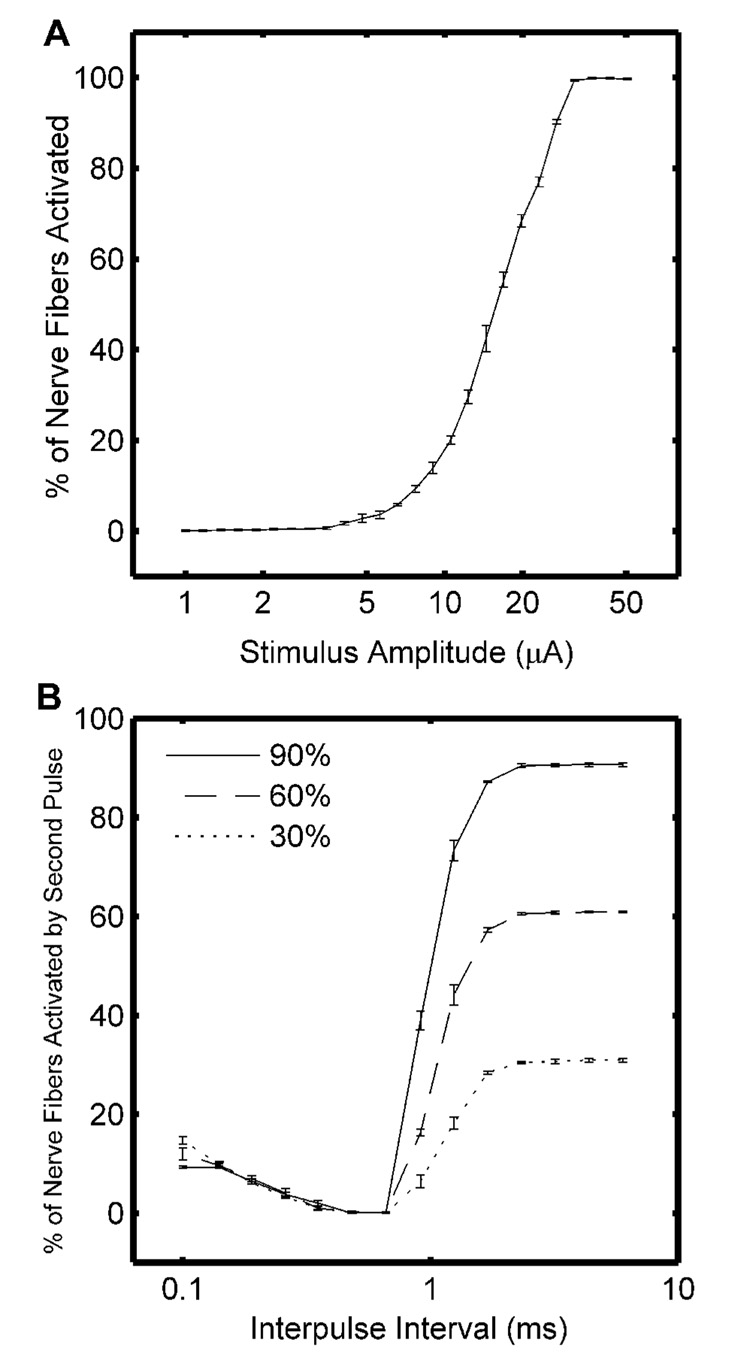
Recruitment curves of the percentage of activated fibers as a function of the stimulation intensity were obtained for each population by applying different pulse amplitudes through an electrode at the middle of the nerve (Fig. 4A). Refractory curves of the percentage of activated fibers as a function of the IPI were obtained by applying two equal amplitude pulses through the same electrode at amplitudes that, when applied as single pulses, activated 30%, 60%, or 90% of the fibers (Fig. 4B).
Fig. 4.
Excitation properties of the model of a nerve bundle which included a population of 400 motor nerve fibers. A. Average input-output (recruitment) curve for three different random fiber distributions. B. Average refractory curves for three different random fiber distributions. The amplitude of each pulse in the pair was selected to activate 30%, 60% or 90% of the nerve fibers when delivered as a single pulse, and the interval between the paired pulses was varied.
2.3. Implementation of approaches to estimate the spatial extent of activation
The traditional approach of measuring the spread of activation by determining the excitation threshold of a single neuron at different positions of the electrode was evaluated for three randomly selected fibers in each of the three nerve bundle models. Excitation thresholds for each fiber were obtained as the electrode was moved through the nerve bundle in steps of 20 µm. The resulting data, thresholds as a function of the electrode position, were fit with the quadratic CDR to obtain estimates of I0 and k.
To study the “differently-sized electrodes” approach proposed by Milner and Laferriere (1986), three spherical electrodes 50, 80, and 125 µm in diameter were positioned in the middle of the nerve bundle, and the fibers that went through the electrodes were eliminated, consistent with Milner and Laferriere’s assumption of constant fiber density. Stimulus currents necessary to recruit 10%, 20% and 30% of fibers were obtained for each electrode and were used to compute the spatial extent of activation. Larger percentages of activation were not considered to ensure that the region of activation did not extent beyond the simulated nerve bundle.
To study the use of the RIT as developed by Fouriezos and Wise (1984), two electrodes with interelectrode distances of 100, 200, 300 or 400 µm were positioned within the nerve bundle along a line perpendicular to the long axis of the nerve and passing through its center. Equal amplitude pulses with IPIs equal to 0.66 ms or 5 ms (i.e., within and beyond the refractory period) were applied to the electrodes, and the minimum stimulus amplitude that resulted in overlap between the regions of activation was determined. The criterion for the overlap was a 5% decrease in the response to paired stimulation with IPI=0.66 ms, relative to the response to paired stimulation with IPI=5 ms. The appropriate stimulus amplitudes were obtained at each interelectrode distance with an accuracy of 1% and used to estimate the parameters of the CDR.
To use the RIT as proposed by Liang et al. (1991), the same electrode configurations described above were used, but with interelectrode distances of 100, 200 or 300 µm. The first electrode (A) was positioned inside the nerve bundle, as the current amplitude necessary to activate fibers with an electrode on the edge of the nerve was significantly larger than required with an electrode inside the nerve. The threshold for electrode A to excite 1% of the total fibers, and the threshold for each electrode B to mask the response evoked by electrode A were obtained for each interelectrode distance with accuracy of 1%, and then used to compute the parameters of the CDR.
The same electrode configuration was used to study the RIT as developed by Yeomans et al. (1986) and Snow et al. (2006). The overlap defined by Yeomans et al. was calculated for interelectrode distances equal to 60, 80 and 100 µm and stimulus amplitudes from 5 to 10 µA. The same was repeated using the overlap defined by Snow et al. Larger interelectrode distances and stimulus amplitudes were avoided to prevent the region of activation from extending beyond the simulated distribution of fibers.
Our proposed method was evaluated by considering one electrode at the center of the nerve and a second electrode 200 µm from the center. Stimulus amplitudes equal to 4, 5 and 6 µA were applied to the first electrode, and the stimulus amplitudes that caused 5% and 95% overlap between the activated regions when applied to the second electrode were determined. Eq. (19)–Eq. (20) were used to estimate the CDR for each of the three stimulus amplitudes delivered to electrode A.
We conducted an analysis of the sensitivity of the CDR parameters to measurement noise or error with each of the methods. One hundred measurements were repeated for each approach by adding random fluctuations (normal distribution with zero mean and standard deviation equal to 0.1 of the corresponding measured data) and the mean and standard deviation of the estimated parameters of the CDR were obtained.
3. RESULTS
Computer simulation of electrical stimulation of a population of nerve fibers was used to compare several methods proposed for measuring the spatial extent of neural activation produced by extracellular stimulation. The average input-output (recruitment) curve for the three simulated populations of nerve fibers is shown in Fig. 4A. The curves were consistent across the three model nerve bundles, and the curve for each population was used to select stimulus amplitudes to activate different proportions of the modeled nerve fibers for the simulations of refractory interaction. The average refractory curves for activation of 30%, 60% and 90% of the nerve fibers are shown in Fig. 4B. The curves show the percentage of fibers activated by the second of two equal amplitude paired pulses with amplitudes selected to activate 30%, 60% or 90% of the nerve fibers when delivered as the single pulse. Temporal summation between the responses evoked by each pulse occurred at short IPIs and increased the number of fibers activated over the number activated by a single pulse. At intermediate IPIs, the fibers activated by the first pulse were refractory, and the second pulse resulted in no additional activation. At longer IPIs, the fibers emerged from refractoriness and were activated a second time by the second pulse. An IPI of 0.66 ms, which lay within the refractory period, was used in subsequent simulations to avoid temporal summation and re-excitation following recovery from refractoriness.
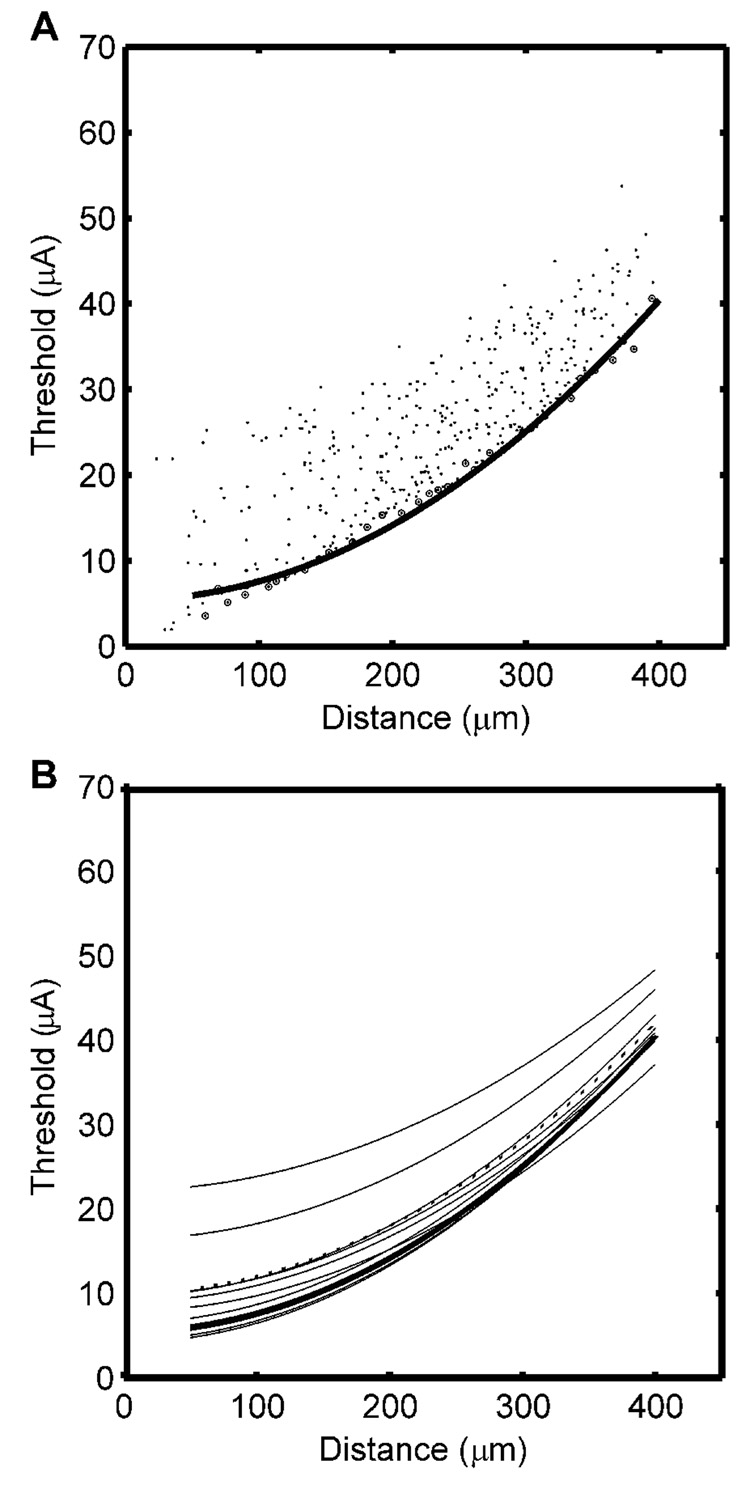
Current thresholds of all fibers in each bundle were obtained with the stimulating electrode positioned 200 µm from the center of the nerve bundle. Due to the variations in fiber diameter and the random positioning of the nearest node relative to the electrode, the thresholds at each electrode to nerve fiber distance were not unique, and the data formed a band (Fig. 5A). The lower boundary of this band represents the most excitable fibers at each distance from the electrode and defines the boundary of the spatial extent of activation. Therefore the results of the different methods were compared with this lower boundary. The threshold-distance points representing the lower boundary were obtained by dividing the distance range into 10 µm divisions and finding the minimum threshold point in each division. The two-parameter quadratic CDR (Eq. 1) was fit to these points and used as the standard to which the results of the other methods were compared. A quadratic relationship was used, since previous theoretical (e.g., BeMent and Ranck 1969b, Bean 1974), computational (e.g., Grill and Mortimer, 1996), and experimental studies (e.g., Bement and Ranck 1969a, Rank 1975, Bagshaw and Evans, 1976, Yeomans et al. 1986) on activation of myelinated axons support the use of the quadratic form of the current-distance curve, and the lower boundary of model threshold distance data was better fit by a quadratic relationship than either a linear or cubic relationship. The absolute threshold, I0, for this CDR was 5.4 µA and the current distance constant, k, was 219 µA/mm2. Similar results were obtained for electrode positions at the center of the bundle and at 50, 100, and 150 µm from the center of the nerve bundle.
Fig. 5.
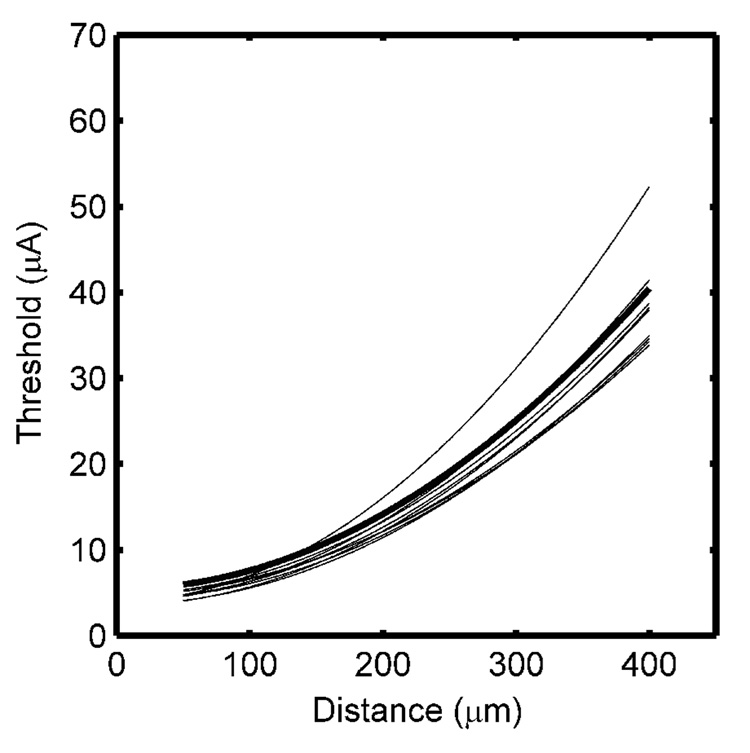
Current distance relationships (CDRs) obtained from the population model and from single nerve fibers. A. Current-distance relationships obtained by measuring individually the threshold for each fiber in the population. The circled points were used as the lower boundary of the threshold band, and the curve is the fit of the quadratic CDR to the lower boundary. B. Nine CDRs obtained by direct measurement from single nerve fibers, the average CDR across the nine fibers (dotted line), and the optimal CDR obtained from the lower boundary (bold line).
3.1. Direct measurement from single neurons
Current distance curves were measured directly for three randomly selected fibers in each of the three modeled nerve bundles. The current distance parameters were obtained by fitting the two-parameter CDR (Eq. 1) to the data, and the results are presented in Table I. The current distance constant was inversely correlated with the absolute threshold, I0, such that shallower current distance constants were obtained for fibers with larger I0 (correlation coefficient = −0.89). The individual and average CDRs obtained from these data and the optimal CDR obtained from the lower boundary of the current-distance data (Fig. 5A) are shown in Fig. 5B. While the estimated current distance constants were close to the optimal value, there were substantial differences in the absolute thresholds obtained by direct measurement of the CDR. The absolute threshold, I0, was strongly dependent on the distance of the electrode track to the fiber’s nearest node of Ranvier, and the correct value would be obtained only if the electrode track touched the nearest node of the fiber under study. Therefore the single cell recording approach consistently overestimated I0.
3.2. Use of differently sized stimulating electrodes
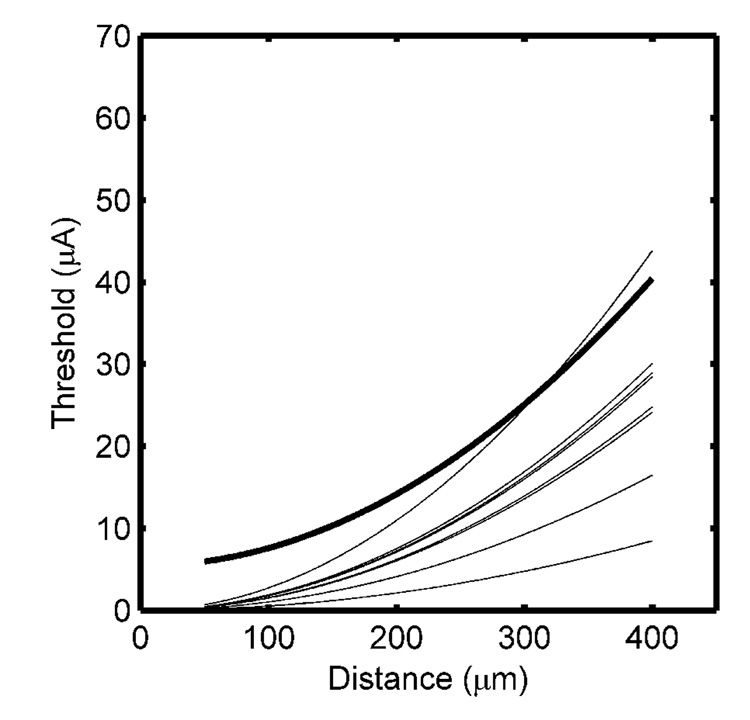
The approach proposed by Milner and Laferriere (1986) was evaluated using three electrodes 50, 80, and 125 µm in diameter. For each electrode, the current thresholds for 10%, 20%, and 30% recruitment were determined and used to calculate the current distance constant (Table II). The current distance constant was consistently underestimated using this approach (Fig. 6) and the large error between the average CDR and the optimal CDR was due to the assumption that I0=0. Both I0 and k could be obtained by using the extent of activation determined at the three different recruitment levels. However, the resulting current distance constants (53 ± 39 µA/mm2) were substantially smaller than the optimal value, and absolute threshold (7.0 ± 1.43 µA) was overestimated.
Table II.
Current distance constants estimated from measurements using differently sized electrodes. Each row is from a different random population of nerve fibers (i.e., nerve bundle).
| Activation (%) | 10 | 20 | 30 |
|---|---|---|---|
| k (µA/mm2) | 151 | 151 | 53 |
| 155 | 188 | 103 | |
| 274 | 181 | 178 | |
| Mean ± SD | 193 ± 70 | 173 ± 20 | 111 ± 63 |
Fig. 6.
Current distance relationships obtained by stimulation with differently-sized electrodes. The nine individual CDRs were obtained at three different levels of recruitment in each of three different random fiber distributions, and the optimal CDR obtained from the lower boundary is shown by the bold line.
3.3. Refractory interaction with equal stimulation intensities
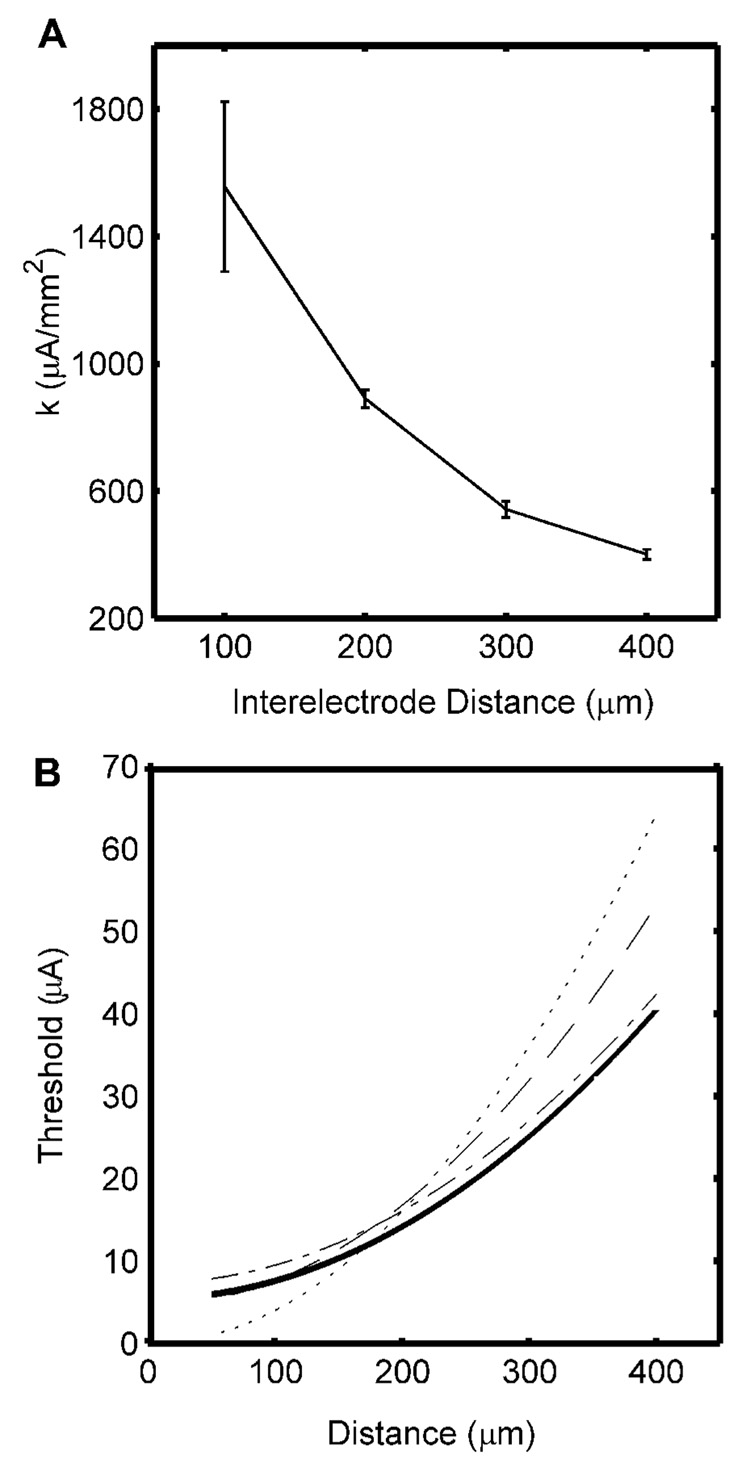
The method developed by Fouriezos and Wise (1984) was applied with interelectrode distances of 100, 200, 300, and 400 µm and the results at each interelectrode distance were used to calculate the current distance constant (Fig. 7A). The estimated CDR was too steep for small interelectrode distances, but converged toward the optimal CDR as the interelectrode distance increased. Fouriezos and Wise (1984) combined results from different experiments conducted with different interelectrode distances to estimate both I0 and k, and we also fitted the two-parameter CDR to the data from different interelectrode distances. The resulting current distance constants (Table III) were smaller than those obtained for each interelectrode distance separately, and when only the data for the 300 and 400 µm interelectrode distances were used the current distance constant was equal to the optimal value (Fig. 7B).
Fig. 7.
Current distance relationships estimated using the refractory interaction technique with equal stimulation intensities applied to both electrodes. A. Current distance constants estimated using different interelectrode distances (mean ± s.d. across three randomized populations). B. Current-distance curves estimated using only data from the 400 µm interelectrode distance to estimate k (dot), using data from 100, 200, 300 and 400 µm interelectrode distances to estimate both I0 and k (dash), or using data from only the 300 and 400 µm interelectrode distances to estimate both I0 and k (dash-dot), and the optimal CDR obtained from the lower boundary (bold).
Table III.
Parameters of current-distance curves estimated using the refractory interaction technique with equal stimulation intensity applied to both electrodes. The left column includes estimates made using data from all interelectrode distances, while the right column includes estimates made using data from only 300 and 400 µm interelectrode distances. The rows are individual estimates and mean ± s.d. from three different random fiber distributions.
| Interelectrode distances: 100, 200, 300, 400 µm | Interelectrode distances: 300, 400 µm | ||
|---|---|---|---|
| I0(µA) | k (µA/mm2) | I0(µA) | k (µA/mm2) |
| 4.4 | 325 | 7.6 | 225 |
| 5 | 269 | 6.8 | 214 |
| 4.3 | 319 | 7.5 | 218 |
| 4.6 ± 0.42 | 304 ± 31 | 7.3 ± 0.45 | 219 ± 5.3 |
3.4. Refractory interaction with threshold stimulation intensity
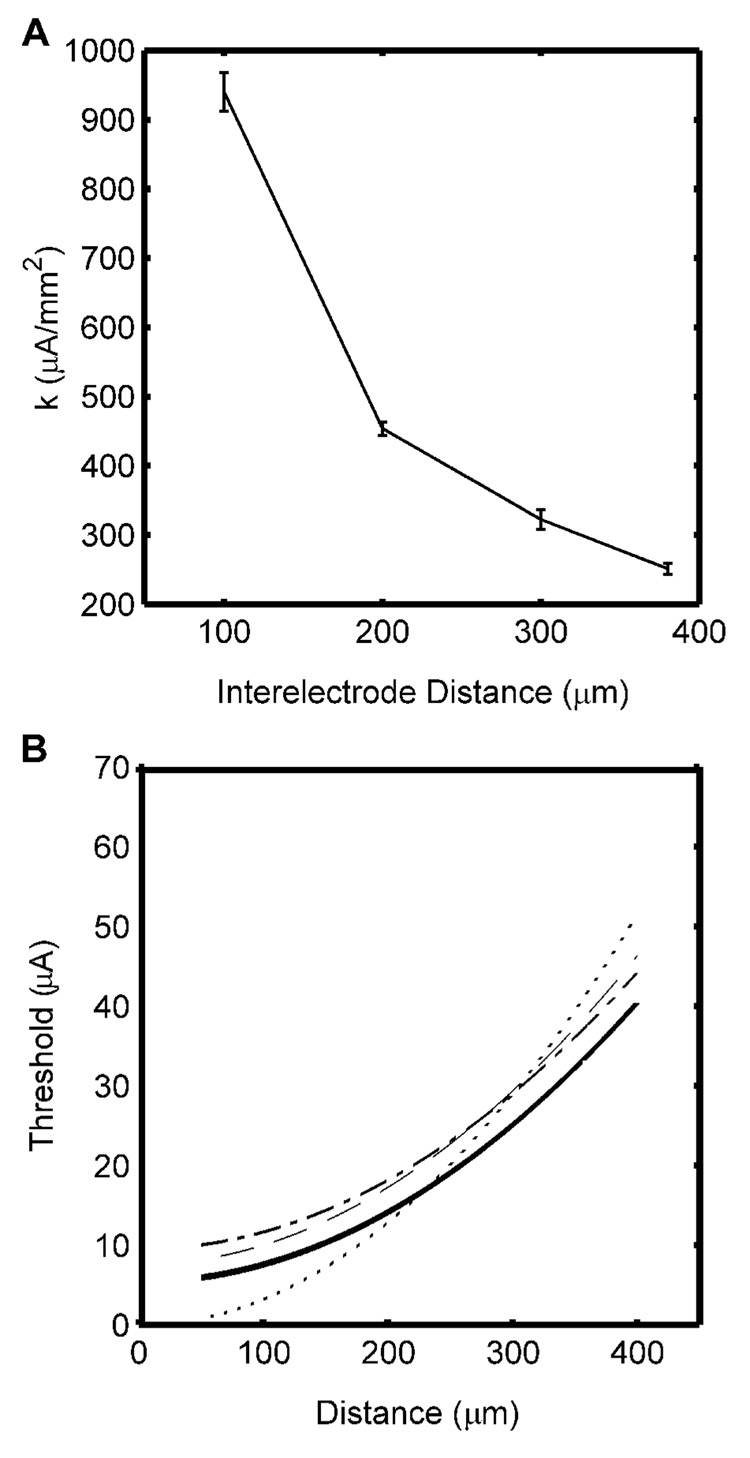
The method developed by Liang et al. (1991) was evaluated with interelectrode distances of 100, 200 and 300 µm, and the thresholds were used to estimate the current distance constant (Fig. 8A). The estimated CDRs were too steep at small interelectrode distances, but converged toward the optimal CDR as the interelectrode distance increased. Combining measurements for different interelectrode distances, we estimated both I0 and k (Table IV). The resulting current distance constants were smaller than those estimated from single interelectrode distances and closer to the optimal value (Fig. 8B).
Fig. 8.
Current distance relationships estimated using the refractory interaction technique with threshold stimulation intensities. A. Current distance constants estimated using different interelectrode distances (mean ± s.d. across three randomized populations). B. Current-distance curves estimated using only data from the 300 µm interelectrode distance to estimate k (dot), using data from 100, 200, and 300 µm interelectrode distances to estimate both I0 and k (dash), or using data from only the 200 and 300 µm interelectrode distances to estimate both I0 and k (dash-dot), and the optimal CDR obtained from the lower boundary (bold).
Table IV.
Parameters of the current-distance relationship estimated using the refractory interaction technique with threshold stimulation intensity. The left column includes estimates made using data from all interelectrode distances, while the right column includes estimates made using data from only 200 and 300 µm interelectrode distances. The rows are individual estimates and mean ± s.d. from three different random fiber distributions.
| Interelectrode distances: 100, 200, 300 µm | Interelectrode distances: 200, 300 µm | ||
| I0(µA) | k (µA/mm2) | I0(µA) | k (µA/mm2) |
| 7.5 | 258 | 8.8 | 240 |
| 7.4 | 234 | 9.4 | 208 |
| 7.7 | 235 | 10.1 | 204 |
| 7.6±0.18 | 242±13 | 9.5±0.65 | 217±20 |
3.5. Refractory interaction methods with geometric models of the overlap
A range of stimulus amplitudes (5 to 10 µA) was applied with interelectrode distances of 60, 80 and 100 µm, and the overlaps as defined by Yeomans et al. (1986) and as defined by Snow et al. (2006) were calculated. When the overlap was larger than zero, the current distance constant was calculated by solving the corresponding equations numerically (Table V). The current distance constant was substantially overestimated, and the results varied widely across the different degrees of overlap (or equivalently the stimulus amplitudes) and interelectrode distances.
Table V.
Current distance constants estimated using the refractory interaction technique combined with geometric models of the overlap. Each result in the upper table is the average of to 6 measurements at different stimulus amplitudes. Each result in the lower table is the average of 8 to 9 measurement at different interelectrode distances. Each row is from a different randomized population of nerve fibers.
| Interelectrode Distance (µm) | Yeomans et al. method | Snow et al. method | ||||
|---|---|---|---|---|---|---|
| 60 | 80 | 100 | 60 | 80 | 100 | |
| k (µA/mm2) | 972 ± 809 | 916 ± 599 | 916 ± 332 | 1182 ± 559 | 1083 ± 453 | 1038 ± 244 |
| 654 ± 373 | 538 ± 496 | 464 ± 242 | 1085 ± 748 | 881 ± 561 | 645 ± 375 | |
| 787 ± 211 | 871 ± 135 | 855 ± 106 | 759 ± 255 | 806 ± 161 | 826 ± 78 | |
| Stimulus Amplitude (µA) | k (µA/mm2) (increasing overlap →) | |||||
| 5 | 6 | 7 | 8 | 9 | 10 | |
| Yeomans et al.method | 1252 ± 285 | 957 ± 637 | 786 ± 379 | 577 ± 189 | 620 ± 227 | 595 ± 260 |
| Snow et al.method | 1439 ± 552 | 1127 ± 543 | 878 ± 283 | 773 ± 162 | 767 ± 140 | 713 ± 200 |
3.6. A novel application of the refractory interaction technique
To evaluate our proposed method, stimulus amplitudes of 4, 5 or 6 µA were applied to electrode A in three different random fiber distributions. The stimulus amplitudes for electrode B that generated 5% and 95% overlap at an interelectrode distance of 200 µm were determined with an accuracy of 1% and used to calculate the parameters of the CDR (Table VI). The resulting CDRs were consistent and closely approximated the optimal CDR obtained from the lower boundary of the current-distance band (Fig. 9).
Table VI.
Parameters of the current-distance relationship estimated using the newly proposed method. Each row is from a different randomized population of nerve fibers.
| Ia 4 µA | Ia 5 µA | Ia 6 µA | |||
|---|---|---|---|---|---|
| I0(µA) | k (µA/mm2) | I0(µA) | k (µA/mm2) | I0(µA) | k (µA/mm2) |
| 3.6 | 196 | 4.0 | 234 | 4.8 | 212 |
| 4.0 | 302 | 4.2 | 188 | 4.9 | 181 |
| 3.5 | 217 | 4.2 | 211 | 4.7 | 187 |
| 3.7 ± 0.26 | 238 ± 56 | 4.1 ± 0.11 | 211 ± 23 | 4.8 ± 0.1 | 193 ± 16 |
| Average | 4.2 ± 0.5 | 214 ± 37 | |||
Fig. 9.
Current distance relationships estimated using the refractory interaction technique with the proposed method. The curves show CDRs estimated using three different first-pulse stimulation intensities across three different random fiber distributions (solid) and the optimal CDR obtained from the lower boundary (bold).
3.7. Comparison of methods to estimate the current-distance relationship
To compare the errors across the different approaches to estimate the spatial extent of neural activation, the best average CDR for each method was selected from the measurements with different or combined interelectrode distances and different stimulus amplitudes (i.e., from the data in Table I to Table VI). These CDRs were then used to calculate the predicted spatial extent of activation with stimulus amplitudes from 5 to 40 µA. The average and maximum errors in the spatial extent of activation with each method were computed, relative to the spatial extent of activation determined from the optimal CDR from the lower boundary of the current-distance band (Fig. 5A) for the same stimulus amplitudes (Table VII). The errors in measuring the spatial extent of activation were quite high for the methods proposed by Milner and Laferriere (1986), Yeomans et al. (1986), and Snow et al. (2006), while the method proposed by Liang et al. (1991) and direct measurement of the CDR of single neurons exhibited lower errors. The best estimates of the spatial extent of neural activation were obtained using our proposed method and the method proposed by Fouriezos and Wise (1984), which exhibited mean errors less than twice the diameter of a single fiber.
Table VII.
Errors in estimates of the spatial extent of neural activation using each method. The first two rows show the parameters of the current-distance relationships that were used to estimate the spatial extent of activation. The mean and maximum errors were calculated over the extent of activation for stimulus amplitudes of 5 to 40 µA.
| Approach | Optimal CDR | Direct measurment method | Milner and Laferriere method | Fouriezos and Wise method | Liang et al.method | Yeomans et al. method | Snow et al. method | Proposed method |
|---|---|---|---|---|---|---|---|---|
| I0(µA) | 5.4 | 10 | - | 7.3 | 9.5 | - | - | 4.2 |
| k (µA/mm2) | 219 | 200 | 185 | 219 | 217 | 595 | 713 | 214 |
| mean error (µm) | - | 38 | 71 | 17 | 39 | 88 | 105 | 17 |
| max error (µm) | - | 145 | 88 | 34 | 97 | 138 | 161 | 75 |
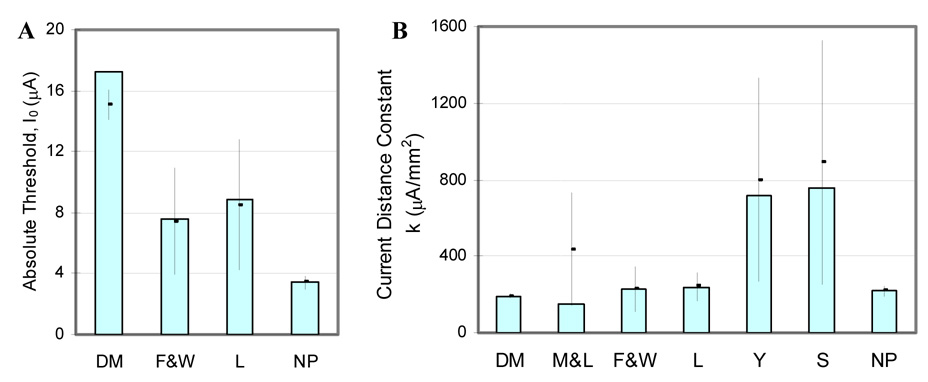
Subsequently we calculated the sensitivity of the parameters of the CDR estimated with each method to measurement noise or error by adding random noise across 100 iterated “experiments” and determining the mean and standard deviation of the estimated parameters of the CDR (Fig. 10). The CDR parameters from direct measurement of the response of single cells exhibited low sensitivity to noise in the measurements. The average error using the Milner and Laferriere (1986) approach was calculated from only 69 repeated measurements, because the solution to the equations did not converge of the remainder, indicating a strong sensitivity to noise. The RIT method proposed by Liang et al. (1991) exhibited lower sensitivity to noise than the RIT proposed by Fouriezos and Wise (1984), and the methods proposed by Yeomans et al. (1986) and Snow et al. (2006) exhibited the greatest sensitivity to measurement noise. Our proposed approach was the most robust method to estimate the spatial extent of neural activation in the presence of measurement noise, with performance comparable to direct measurements from single cells.
Fig. 10.
Sensitivity analysis of the current distance parameters to measurement noise or error with each of the methods. The bars show absolute threshold, I0 (A) and current distance constant, k (B) calculated from noise free measurements, and the points and error bars show the mean and standard deviation of the parameters estimated across 100 repeated measurements with random added noise. (DM: direct measurement from single cells; M&L: Milner and Laferriere (1986) method; F&W: Fouriezos and Wise (1984) method; L:Liang et al. (1991) method; Y:Yeomans et al. (1986) method; S:Snow et al. (2006) method; NP: newly proposed method).
4. DISCUSSION
A computer-based population model of the axons in the branch of the sciatic nerve innervating the medial gastrocnemius muscle was implemented and used to evaluate a range of approaches proposed for measuring the spatial extent of neural activation. The estimates with each method were compared with measurements of the true spatial extent of activation that were accessible in the simulations. The results quantified the accuracy of the estimates with each approach, determined the dependence of accuracy on measurement parameters (interelectrode distance, stimulation amplitude, and noise), and revealed limitations that must be considered in using these methods. A newly proposed method, based on the refractory interaction technique, provided the most accurate and most robust estimates of the spatial extent of neural activation.
4.1. Accuracy and limitations of proposed methods
Direct measurement of the CDR by recording the response of single cells provided accurate estimates of the current distance constant, k, and the variance across different recorded fibers was small. However, the absolute threshold, I0, was overestimated with this approach, and, since it was dependent on the distance of the electrode “track” from the nearest node of the recorded fiber, I0 was highly variable across individual fibers. This resulted in comparatively large errors in the estimated extent of the activated region, especially for small stimulus amplitudes. Using the minimum estimated absolute threshold and the average estimated current distance constant from several measurements reduced the error. This approach does not assume a uniform distribution of fibers, and the results suggest that the error due to studying one (or a few) fiber, as representative of the population of fibers, is small. In addition, the results were very robust to noise in the measurements, in part due to the comparatively large number of measurements that are used to estimate the CDR with this method. The requirements to record the activity of a single neuron and to move precisely the stimulation electrode complicate the application of this approach, and this method may not be feasible in many experimental or clinical situations.
Estimating the spatial extent of stimulation using differently sized electrodes (Milner and Laferriere, 1986) underestimated the current distance constant. Further, there was substantial variation in the estimates of k across the three different randomized populations of fibers, suggesting that this approach was sensitive to the exact distribution of fibers. This approach assumes a fixed threshold current density and uniform anatomical and physiological properties including fiber diameter and fiber density. However, the threshold current density depends on the spatial distribution of the extracellular electric field (Moffitt et al., 2004), there are variations in the diameters and density of nerve fibers, and insertion of differently-sized electrodes may alter the density of surrounding fibers. Since the absolute threshold, I0, cannot be calculated using this method, there was substantial error in the estimated extent of the activated region and the estimates of k were quite sensitive to noise in the measurements.
Milner and Laferriere (1986) applied this approach to measure the current distance relationship of the medial forebrain bundle reward path, and reported steeper CDRs than obtained by Fouriezos and Wise (1984) in the same tissue. This is in contrast to our finding that Milner and Laferriere’s method resulted in shallow CDRs, and may reflect their assumption that only 0.57–0.84 of the applied current contributed to excitation due to leakage through scar tissue. Milner and Laferriere also applied their approach to estimate the CDR for tectospinal circling pathways, and their results were consistent with the large range of current distance constants obtained by Yeomans et al. (1986) for the same tissue.
The refractory interaction techniques proposed by Fouriezos and Wise (1984) and Liang et al. (1991) significantly overestimated the current distance constant for small interelectrode distances. However, the current distance constant approached the optimal value as the interelectrode distance was increased, but due to the geometric size of the model (nerve bundle diameter of 400 µm) we could not estimate the current distance constant for larger interelectrode distances. In addition, the sensitivity of the estimated parameters to measurement noise was relatively small in comparison to other methods. However, these methods require repeated measurements to identify the stimulus amplitude at the threshold of overlap. Further, the Liang et al. method requires that the response to each pulse in the pair be separately detectable (i.e., separate in time from the other response). Since the absolute refractory period is ~ 1 ms, the responses may overlap such that the minimum response cannot be detected, and this may limit the applicability of this method. These methods do not provide a direct estimate of the absolute threshold, but when data from several interelectrode distances were used to estimate both Io and k, the parameters were closer to the optimal values and the error in the estimated spatial extent of activation was small. These findings are consistent with experimental results obtained by Fouriezos and Wise (1984) for rewarding brain stimulation; for small interelectrode distances the current distance constant determined from single measurements was about four times larger than from five measurements with different interelectrode distances and 1.5 to 2 times larger for large interelectrode distances.
The methods proposed by Yeomans et al. (1986) and Snow et al. (2006) consistently overestimated the current distance constant, there were large variations across different interelectrode distances and the three randomized fiber populations, and the estimates of k were very sensitive to measurement noise. The small number of measurements used in this approach to calculate the current distance constant may account for the variance across different stimulus amplitudes and fiber populations. The estimate of k is obtained by measuring only three responses, while in the other RIT methods stimuli are repeated multiple times to identify the appropriate stimulus amplitude for the specified degree of overlap. The error in the estimated k decreased slightly as the interelectrode distance was increased. Similarly, the current distance constants estimated using either method decreased with increasing degree of overlap (or, equivalently, increased stimulus amplitude). Yeomans et al. (1986) used this approach to measure the current distance constant for mediocaudal midbrain stimulation eliciting circling behavior and observed a similar dependence of the current distance constant on interelectrode distance and stimulus amplitude, where the dependence on amplitude was related to the distribution of excitation thresholds of the neurons. These methods assume a uniform distribution of the neurons and are sensitive to violation of this assumption. Further, these methods do not provide an estimate of the absolute threshold, which is another source of error in estimating the extent of the activated region.
Our proposed method used the RIT to identify the currents that produced 5% and 95% overlap, and thus, like the methods of Fouriezos and Wise (1984) and Liang et al. (1991), required repeated stimulus-response measurements. However, in contrast to these other methods, the proposed method did not require more than two electrodes to estimate both k and Io and worked well even for small interelectrode distances. This method provided estimates of k and Io that were close to the optimal CDR, had a small mean error estimating the extent of the activated region, and exhibited low sensitivity to measurement noise.
The proposed method estimates the current distance parameters based on two stimulus amplitudes, I1 and I2, which correspond to radii of activation by electrode B of L−r and L+r, where L is the interelectrode distance and r is the extent of activation by electrode A (Eq. 17–Eq. 18, Fig. 2). If Ia is small, then the extent of activation, r, is small and the two radii of activation for electrode B will be close. Subsequently, the parameters of the CDR will be estimated using two points that are close together, and the estimation will be more vulnerable to errors. However, for other RIT methods, when the data for different interelectrode distances or stimulus amplitudes are not combined, the results are more sensitive to measurement errors, since only a single point is used to estimate the CDR (Fig. 10). In addition, the error associated with representing the activated region by a limited number of nerve fibers increases for small regions of activation, corresponding to small Ia. Indeed, the absolute threshold was consistently underestimated in all cases, but increased as the amplitude of the first pulse, Ia, increased.
4.2. Limitations of the study
The model used in these studies was representative of a peripheral motor nerve and included a distribution of fiber diameters, based on experimental measurements, which were randomly positioned with respect to the electrode(s). In other applications, either in a mixed motor nerve or in the CNS, there may be a broader spectrum of fiber diameters, and therefore a broader distribution of thresholds. A broader distribution of thresholds would result in a shallower slope of the input-output curve (Fig. 4A) and a larger spread of thresholds at each electrode to fiber distance (Fig. 5A). The refractory interaction methods to determine the spatial extent of stimulation are most sensitive to the most excitable neural elements, i.e., the lower boundary of the threshold distance data (bold line in Fig. 5A). As the distribution of thresholds at any distance becomes broader, there will be a larger difference between the estimated current-distance curve (indicative of the most excitable fibers, and thus the spatial extent of stimulation) and current distance curves obtained by averaging across measurements from single neurons (dotted line in Fig. 5B).
Large variability in the excitability of fibers may also affect the accuracy of the methods using refractory interaction, including the newly proposed method. Fibers that are activated by electrode A but not by electrode B, even when there is full (geometric) overlap between the regions activated by A and B (fig. 2), will result is an overestimation of I2. However, when the proposed method was applied to the baseline model nerve fiber bundle, no fibers were identified in the overlap region that were activated by electrode A, but not by electrode B. Further, when the variance of the fiber diameters was increased to 4 µm2 (resulting in increased variance in excitability), across 6 simulated populations there was only one instance of an axon that was activated by electrode A but not by electrode B when there was full geometric overlap, and then only a single fiber (1/72=1.4% of fibers activated by electrode A). As well, I2 is estimated as the Ib that results in 95% overlap, and this provides a safety margin for estimation of I2, even when such fibers exist. Thus, while a theoretical possibility, it appears unlikely that such fibers will influence estimation of Io and k using the proposed method.
The model used to evaluate methods to estimate the spatial extent of extracellular stimulation included only nerve fibers (axons) and included neither the cell bodies nor presynaptic terminals that may be activated by electrodes placed within the CNS (Grill and McIntyre, 2001). The temporal properties of these neural elements will impact the response to paired pulse stimulation (Miocinovic and Grill, 2004), and different inter-pulse intervals may be appropriate for measuring the CDR in a population of CNS neurons using refractory interaction. Further, the interconnections between neurons may result in indirect (synaptic) activation of distant neurons such that the region of activation extends beyond the region influenced by the extracellular potentials (Butovas and Schwarz, 2003), and this may complicate the interpretation of the response and its use to estimate the spatial extent of the region of activation.
While biphasic pulses are generally used to reduce the propensity for electrode or tissue damage, monophasic cathodic pulses were used in this study. The second (anodic) phase of the pulse can impact the excitation threshold and activate, via virtual cathodes, neurons that were not activated by the primary phase. However, the results of limited simulations conducted using biphasic pulses showed no substantial differences from the results obtained with monophasic pulses.
The aim of this study was to evaluate the reliability of several methods for measuring the spatial extent of neural stimulation, and spatial variables and stimulus amplitudes were obtained with very high accuracies (1% error). However, in practical application of these methods, noise in the measurements and restrictions on the number of stimulation-recording trials that can be conducted will reduce the accuracy of the measurements, and this may impact the relative utility of the different techniques. The sensitivity analysis (Fig. 10) provided a quantitative assessment of the impact of measurement noise and identified the most robust methods.
The newly proposed method may be used experimentally to measure the spatial extent of activation of myelinated fibers in response to extracellular stimulation. For example, the CDR of intraneural stimulation of peripheral motor fibers could be determined by recording the electromyogram as a quantitative measure of the response. First, recruitment and refractory measurements are required to determine the appropriate stimulus amplitudes and inter-pulse interval (e.g., Fig. 4). Subsequently, paired pulses applied to two different electrodes are used to determine the stimulus amplitudes for minimum and full overlap, and these currents are combined with Eq. (19)–Eq. (20) to calculate the parameters of the CDR. This technique can also be applied to evaluate the selectivity of stimulation with multi-electrode arrays by determining the interaction between adjacent channels of stimulation or the spatial selectivity of stimulation with each electrode (Rutten et al., 1991; Yoshida and Horch, 1993; Abbas et al., 2004; Snow et al., 2006).
ACKNOWLEDGEMENTS
This study was supported by a grant from the U.S. National Institutes of Health, R01NS040894, and the Ministry of Science, Research and Technology of I.R. Iran.
Footnotes
Publisher's Disclaimer: This is a PDF file of an unedited manuscript that has been accepted for publication. As a service to our customers we are providing this early version of the manuscript. The manuscript will undergo copyediting, typesetting, and review of the resulting proof before it is published in its final citable form. Please note that during the production process errors may be discovered which could affect the content, and all legal disclaimers that apply to the journal pertain.
REFERENCES
- Abbas PJ, Hughes ML, Brown CJ, Miller CA. Channel interaction in cochlear implant users evaluated using the electrically evoked compound action potential. Audiol. Neurootol. 2004;9(4):203–213. doi: 10.1159/000078390. [DOI] [PubMed] [Google Scholar]
- Bagshaw EV, Evans MH. Measurement of current spread from microelectrodes when stimulating within the nervous system Exp. Brain Res. 1976;25(4):391–400. doi: 10.1007/BF00241729. [DOI] [PubMed] [Google Scholar]
- Bean CP. A theory of microstimulation of myelinated fibers. J. Physiol. 1974;243(2):514–522. [Google Scholar]
- BeMent SL, Ranck JB., Jr A quantitative study of electrical stimulation of central myelinated fibers. Exp. Neurol. 1969a;24(2):147–170. doi: 10.1016/0014-4886(69)90012-0. [DOI] [PubMed] [Google Scholar]
- BeMent SL, Ranck JB., Jr A model for electrical stimulation of central myelinated fibers with monopolar electrodes. Exp. Neurol. 1969b;24(2):171–186. doi: 10.1016/0014-4886(69)90013-2. [DOI] [PubMed] [Google Scholar]
- Branner A, Stein RB, Normann RA. Selective stimulation of cat sciatic nerve using an array of varying-length microelectrodes. J. Neurophysiol. 2001;85(4):1585–1594. doi: 10.1152/jn.2001.85.4.1585. [DOI] [PubMed] [Google Scholar]
- Butovas S, Schwarz C. Spatiotemporal effects of microstimulation in rat neocortex: a parametric study using multielectrode recordings. J Neurophysiol. 2003;90(5):3024–3039. doi: 10.1152/jn.00245.2003. [DOI] [PubMed] [Google Scholar]
- Deurloo KE, Holsheimer J, Boom HB. Transverse tripolar stimulation of peripheral nerve: a modelling study of spatial selectivity. Med. Biol. Eng. Comput. 1998;36(1):66–74. doi: 10.1007/BF02522860. [DOI] [PubMed] [Google Scholar]
- Eccles JC, Sherrington CS. Numbers and contraction-values of individual motor-units examined in some muscles of the limb. Proc. Royal. Soc. Lon. Series B. 1930;106(745):326–357. [Google Scholar]
- Fouriezos G, Wise RA. Current-distance relation for rewarding brain stimulation. Behav. Brain. Res. 1984;14(1):85–89. doi: 10.1016/0166-4328(84)90023-8. [DOI] [PubMed] [Google Scholar]
- Grill WM, Mortimer JT. The effect of stimulus pulse duration on selectivity of neural stimulation. IEEE Trans. Biomed. Eng. 1996;43:161–166. doi: 10.1109/10.481985. [DOI] [PubMed] [Google Scholar]
- Grill WM, Kirsch RF. Neuroprosthetic applications of electrical stimulation. Assist. Technol. 2000;12(1):6–20. doi: 10.1080/10400435.2000.10132006. [DOI] [PubMed] [Google Scholar]
- Grill WM, McIntyre CC. Extracellular excitation of central neurons: Implications for the mechanisms of deep brain stimulation. Thal. Rel. Sys. 2001;1(3):269–277. [Google Scholar]
- Hentall ID, Zorman G, Kansky S, Fields HL. Relations among threshold, spike height, electrode distance, and conduction velocity in electrical stimulation of certain medullospinal neurons. J. Neurophysiol. 1984;51(5):968–977. doi: 10.1152/jn.1984.51.5.968. [DOI] [PubMed] [Google Scholar]
- Hentall ID. Practical modelling of monopolar axonal stimulation. J. Neurosci. Methods. 1987;22(1):65–72. doi: 10.1016/0165-0270(87)90091-4. [DOI] [PubMed] [Google Scholar]
- Hines ML, Carnevale NT. The NEURON simulation environment. Neural. Comput. 1997;9(6):1179–1209. doi: 10.1162/neco.1997.9.6.1179. [DOI] [PubMed] [Google Scholar]
- Liang DH, Kovacs GTA, Storment CW, White RL. A method for evaluating the selectivity of electrodes implanted for nerve stimulation. IEEE Trans. Biomed. Eng. 1991;38(5):443–449. doi: 10.1109/10.81563. [DOI] [PubMed] [Google Scholar]
- Marcus S, Zarzecki P, Asanuma H. An estimate of effective current spread of stimulation current. Exp. Brain. Res. 1979;34(1):68–72. [Google Scholar]
- McIntyre CC, Richardson AG, Grill WM. Modeling the excitability of mammalian nerve fibers: influence of afterpotentials on the recovery cycle. J. Neurophysiol. 2002;87(2):995–1006. doi: 10.1152/jn.00353.2001. [DOI] [PubMed] [Google Scholar]
- Milner PM, Laferriere A. Behavioral measurement of axonal thresholds. Behav. Brain Res. 1986;22(3):217–226. doi: 10.1016/0166-4328(86)90066-5. [DOI] [PubMed] [Google Scholar]
- Miocinovic S, Grill WM. Sensitivity of temporal excitation properties to the neuronal element activated by extracellular stimulation. J. Neuro. Meth. 2004;132:91–99. doi: 10.1016/j.jneumeth.2003.09.004. [DOI] [PubMed] [Google Scholar]
- Moffitt MA, McIntyre CC, Grill WM. Prediction of nerve stimulation thresholds: limitations of linear models. IEEE Trans. Biomed. Eng. 2004;51:229–236. doi: 10.1109/TBME.2003.820382. [DOI] [PubMed] [Google Scholar]
- Nicholson PW. Experimental models for current conduction in an anisotropic medium. IEEE Trans. Biomed. Eng. 1967 14;:55–56. [Google Scholar]
- Nowak LG, Bullier J. Spread of stimulating current in the cortical grey matter of rat visual cortex studied on a new in vitro slice preparation. J. Neurosci. Meth. 1996;67(2):237–248. [PubMed] [Google Scholar]
- Ranck JB. Which elements are excited in electrical stimulation of mammalian central nervous system: a review. Brain Res. 1975;98(3):417–440. doi: 10.1016/0006-8993(75)90364-9. [DOI] [PubMed] [Google Scholar]
- Rubinstein JT. Analytical theory for extracellular electrical stimulation of nerve with focal electrodes. II. Passive myelinated axon. Biophys. J. 1991;60(3):538–555. doi: 10.1016/S0006-3495(91)82084-7. [DOI] [PMC free article] [PubMed] [Google Scholar]
- Rutten WLC, van Wier HJ, Put JHM. Sensitivity and selectivity of intraneural stimulation using a silicon electrode array. IEEE Trans. Biomed. Eng. 1991;38(2):192–198. doi: 10.1109/10.76386. [DOI] [PubMed] [Google Scholar]
- Snow S, Horch W, Mushahwar VK. Intraspinal microstimulation using cylindrical multielectrodes. IEEE Trans. Biomed. Eng. 2006;53(2):311–319. doi: 10.1109/TBME.2005.857638. [DOI] [PubMed] [Google Scholar]
- Stoney SD, Thompson WD, Asanuma H. Excitation of pyramidal tract cells by intracortical microstimulation: effective extent of stimulating current. J. Neurophysiol. 1968;31(5):659–669. doi: 10.1152/jn.1968.31.5.659. [DOI] [PubMed] [Google Scholar]
- Tehovnik EJ. Electrical stimulation of neural tissue to evoke behavioral responses. J. Neurosci. Methods. 1996;65(1):1–17. doi: 10.1016/0165-0270(95)00131-x. [DOI] [PubMed] [Google Scholar]
- Wait JR. Current flow into a three-dimensionally anisotropic conductor. Radio Science. 1990;25(5):689–694. [Google Scholar]
- Yeomans J, Prior P, Bateman F. Current-distance relations of axons mediating circling elicited by midbrain stimulation. Brain Res. 1986;372(1):95–106. doi: 10.1016/0006-8993(86)91462-9. [DOI] [PubMed] [Google Scholar]
- Yoshida K, Horch K. Selective stimulation of peripheral nerve fibers using dual intrafascicular electrodes. IEEE Trans. Biomed. Eng. 1993;40(5):492–494. doi: 10.1109/10.243412. [DOI] [PubMed] [Google Scholar]


