

Abstract
Rapid eye movement (REM) sleep has been considered a paradoxical state because, despite the high behavioral threshold to arousing perturbations, gross physiological patterns in the forebrain resemble those of waking states. To understand how intrahippocampal networks interact during REM sleep, we used 96 site silicon probes to record from different hippocampal subregions and compared the patterns of activity during waking exploration and REM sleep. Dentate/CA3 theta and gamma synchrony was significantly higher during REM sleep compared with active waking. In contrast, gamma power in CA1 and CA3–CA1 gamma coherence showed significant decreases in REM sleep. Changes in unit firing rhythmicity and unit-field coherence specified the local generation of these patterns. Although these patterns of hippocampal network coordination characterized the more common tonic periods of REM sleep (∼95% of total REM), we also detected large phasic bursts of local field potential power in the dentate molecular layer that were accompanied by transient increases in the firing of dentate and CA1 neurons. In contrast to tonic REM periods, phasic REM epochs were characterized by higher theta and gamma synchrony among the dentate, CA3, and CA1 regions. These data suggest enhanced dentate processing, but limited CA3–CA1 coordination during tonic REM sleep. In contrast, phasic bursts of activity during REM sleep may provide windows of opportunity to synchronize the hippocampal trisynaptic loop and increase output to cortical targets. We hypothesize that tonic REM sleep may support off-line mnemonic processing, whereas phasic bursts of activity during REM may promote memory consolidation.
Keywords: hippocampus, synchrony, oscillation, paradoxical sleep, consolidation, dreaming, in vivo electrophysiology
Introduction
Sleep is not a homogeneous state, but is composed of various stages of slow-wave sleep and rapid eye movement (REM) sleep (Steriade and Llinas, 1988; Borbely and Tobler, 1989). REM sleep is characterized by muscle atonia, saccadic eye movements, a host of autonomic effects, and, at least in humans, dreaming (Aserinsky and Kleitman, 1953; Dement and Wolpert, 1958; Berger and Oswald, 1962; Llinas and Pare, 1991; Hobson and Pace-Schott, 2002). There is considerable debate on the function of REM sleep (Crick and Mitchison, 1983; Buzsaki, 1989; Siegel, 2001; Vertes, 2004; Walker and Stickgold, 2004; Muzur, 2005), and the only real consensus is that we need a better understanding of the physiological changes accompanying REM sleep to inform our functional theories (Gottesmann, 2001; Walker and Stickgold, 2004). Despite presumed functional differences in brain activity between the waking state and REM sleep, available physiological evidence indicates global electroencephalogram (EEG) similarities in forebrain areas (Llinas and Pare, 1991; Vertes and Kocsis, 1997; Wehrle et al., 2007). Both waking and REM sleep are associated with theta oscillations in the hippocampus and “desynchronized” low-amplitude, high-frequency EEG activity in the neocortex (Grastyan and Karmos, 1961; Lissak et al., 1962; Jouvet, 1999), leading many investigators to lump these states together for analysis. Furthermore, brain reactivity to external stimuli during REM sleep is more similar to waking responsiveness than that observed during slow-wave sleep (Bastuji and Garcia-Larrea, 1999; Wehrle et al., 2007). These similarities are surprising because waking and REM forebrain activity profiles are accompanied by strikingly different firing patterns of serotonergic (McGinty and Harper, 1976), catecholaminergic (Chu and Bloom, 1973), and histaminergic (Sakai et al., 1990) neurons.
Given the specific innervation of hippocampal networks from hindbrain modulator systems (Amaral and Witter, 1995) and the shift in subcortical neuromodulator tone between REM and waking states, we hypothesized that there may be hitherto-undetected state-dependent changes in hippocampal network activity that may inform our functional understanding of the hippocampus during REM sleep. To test this hypothesis, we used high-density silicon probes to record local field potentials (LFPs) and unit activity from the different layers of the dentate gyrus (DG), CA3, and CA1 hippocampal regions across periods of active waking and REM sleep. Recording simultaneously from the different hippocampal subregions permitted us to investigate how hippocampal networks dynamically coordinate with one another in different behavioral states. We found that, whereas the dentate and CA3 became more highly synchronized by theta and gamma oscillations during REM sleep, CA3–CA1 gamma coordination was significantly reduced during REM sleep compared with during active waking. Furthermore, we found phasic bursts of activity during REM sleep in which theta and gamma oscillations in the dentate, CA3, and CA1 were transiently synchronized, and the output firing of CA1 neurons was transiently increased. We hypothesize that our observations may reflect enhanced processing of hippocampus-dependent memories in the dentate and dentate/CA3 interface during REM sleep, with brief windows during which these associations may be transmitted through the trisynaptic loop to downstream cortical targets.
Materials and Methods
Animals and behavior.
LFP and unit activity was recorded from four Long–Evans rats (males; 300–400 g) during active waking behavior and REM sleep. Rats were water-deprived and trained to run on a modified linear track and in a continuous delayed nonmatch to place (“alternation”) task for water reward (Montgomery and Buzsaki, 2007). Immobility periods (<5 cm/s) and consummatory behaviors during which hippocampal networks shift to a sharp-wave state were excluded from analysis. Data were combined across the two tasks to represent “active waking.” REM sleep recordings were performed in the animals' home cages before and after maze running. Once theta activity emerged in the sleeping rat, the experimenter verified that the rat was still in sleeping posture, typically curled up in one of the corners. Occasionally, behavioral signs of phasic REM sleep were present, including limb movements and twitching of whiskers (Vanderwolf, 1969). REM sleep was detected semiautomatically using the ratio of the power within the theta band (4–12 Hz) to the power in nearby bands (1–4, 12–30 Hz) (supplemental Fig. 1, available at www.jneurosci.org as supplemental material) (Csicsvari et al., 1999; Louie and Wilson, 2001). Visual inspection of whitened (using a low-order autoregressive model) (Mitra and Pesaran, 1999) power spectra and raw traces was used to manually include brief fluctuations in the theta/delta ratio nested in long periods of REM sleep (∼10 s to several minutes) and to exclude portions that were interrupted by CA1 pyramidal layer ripple oscillations (120–250 Hz) (Buzsaki et al., 1992) occurring during slow-wave sleep or muscle artifacts (most prominent above 250 Hz) that commonly accompany waking after the termination of REM sleep. REM periods were cross-validated with experimenter notes taken while watching the rat and listening to on-line LFP/unit recordings.
Surgery.
After proficient maze running was established, recording and stimulation electrodes were implanted. A 96 site silicon probe was implanted on a movable drive in the right hemisphere parallel to the transverse axis of the hippocampus (45° parasagittal) with the outer shanks targeted at approximately anteroposterior (AP), −2.8 mm; mediolateral (ML), 2.7 mm; and AP, −3.86 mm; ML, 1.64 mm from bregma. Probes had recording sites spaced regularly over a 1.5 × 1.5 mm area with six shanks spaced at 300 μm, each with 16 recording sites at 100 μm spacing. DiI was applied to the probe before implantation to assist in histological analysis. A bipolar angular bundle (perforant path) stimulating electrode was implanted at AP, 1.0 mm; ML, −1.0 mm from the junction between λ and the right lateral ridge; and dorsoventral, −3.5 mm from the dura. A bipolar commissural stimulating electrode was implanted at AP, −1.2 mm; ML, −1.0 mm from bregma and −3.8 mm from the dura. Ground and reference screws were implanted in opposite hemispheres above the cerebellum.
Electrode localization.
Postmortem electrode location was verified using thionin, fluorescent Nissl (Invitrogen), or DAPI (4′,6′-diamidino-2-phenylindole) (Invitrogen) staining in combination with DiI (Invitrogen)-labeled electrode tracks. Prominent morphological features of the hippocampal anatomy were outlined for subsequent analysis of hippocampal physiological signals (see Fig. 1A). LFP ripple bursts (120–250 Hz) were detected on CA1 pyramidal layer sites and aligned to the depth negativity of the concomitant sharp wave for anatomical localization (see Fig. 1B). Using a combination of the histology, ripple-triggered current source density (CSD), perforant path evoked CSD, ripple power, dentate spike-triggered CSD, and multiunit activity (see Fig. 1) (Bragin et al., 1995b; Csicsvari et al., 2003b; Montgomery and Buzsaki, 2007), the anatomical location of recording sites could be determined to a high degree of accuracy (Bragin et al., 1995a), estimated to about ±30 μm.
Figure 1.
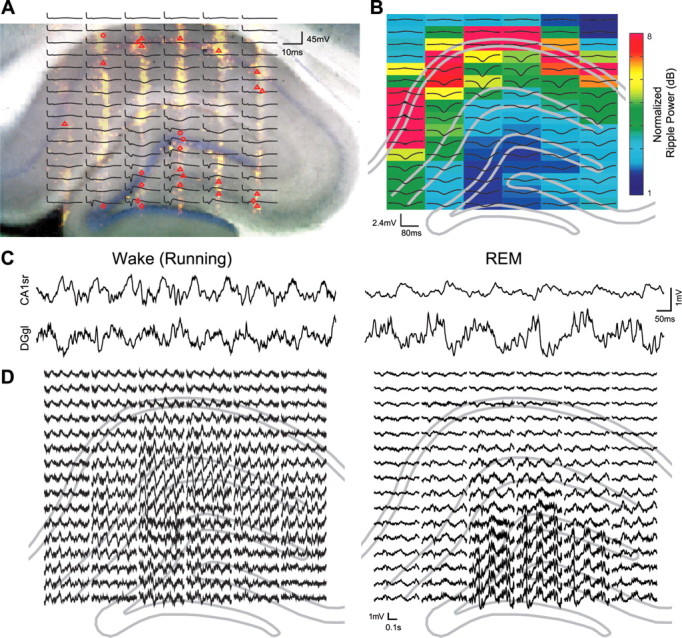
Identification of recording site locations and laminar-specific changes in hippocampal network synchrony during REM sleep versus active waking behavior. A, B, Anatomical positions of recording sites were localized for each recording session by aligning the histology with several spontaneous and evoked activity patterns (see Materials and Methods). A, Histological sections with DiI labeling of electrode tracks (yellow) overlaid with estimated locations of single units (red points; location estimated from waveform amplitudes; putative cell types: triangle, principal cell; circle, interneuron; diamond, unclassified) and average perforant path evoked potentials (black traces; n = 3). Note the EPSP-associated negativity in the dentate molecular layer and monosynaptic and disynaptic population spikes in the dentate and CA3, respectively, resulting from perforant path stimulation. B, Ripple-triggered average LFP responses (black traces; centered on ripple event; n = 179) overlaid on normalized ripple power (color; 120–250 Hz) and outline of histological features (gray lines). C, D, Example of raw local field potential traces recorded during REM sleep and running in a maze. C, One second LFP traces from CA1 stratum radiatum (CA1sr) and the dentate granule layer (DGgl). D, LFP activity (0.5 s overlapping with trace in C) centered on the anatomical location from which the trace was recorded. Note the higher theta and gamma oscillation amplitudes on dentate recording sites during REM sleep but the larger gamma in CA1sr during wake. Signals were spatially interpolated over a priori identified defunct recording sites (see Materials and Methods).
Data acquisition and analysis.
Neurophysiological signals were acquired continuously at 20 kHz on two synchronized 64 channel DataMax systems (16-bit resolution; RC Electronics). Local field potentials were down-sampled to 1.25 kHz for additional analysis. For tracking the position of the animals, two small light-emitting diodes (11 cm separation), mounted above the headstage, were recorded by a digital video camera and sampled at 30 Hz. Stable recording sessions in which the silicon probe shanks spanned the CA1, CA3, and dentate gyrus somatic layers, were analyzed using custom-written Matlab-based software (Mathworks). Recording site irregularities (including cross talk and excessive impedances) were a priori identified and removed from analysis using measures of coherence and normalized power similarity (Diba et al., 2005). The CSD was calculated by standard methods (Mitzdorf, 1985) and spatially smoothed. Typically, a single bad channel was surrounded by good channels and was linearly interpolated before CSD calculation to avoid false-positive detection of current sinks/sources. Two adjacent bad channels in the middle of a silicon probe shank were interpolated in four instances (each in different layers) to use remaining channels on the shank. CSD calculations centered on bad channels were excluded from additional analysis. Occasionally, a group of nearby channels was defective and a portion of the silicon probe, or, in two cases, the entire silicon probe shank, was excluded from analysis. In total, 11–19 LFP measurements and 5–19 CSD measurements were a priori selected from each layer for additional analysis (see below, Statistics) (Montgomery and Buzsaki, 2007). For unit analysis, the wide-band signals were digitally high-pass filtered (0.8–5 kHz) and automatically spike sorted using KlustaKwik (Harris et al., 2000), followed by manual adjustment of the clusters (using the Klusters software package) (Hazan et al., 2006). Pyramidal cells and interneurons were separated on the basis of their autocorrelograms, waveforms, and mean firing rate (Csicsvari et al., 1999; Bartho et al., 2004). Bursting was quantified as the fraction of interspike intervals ≤6 ms (Harris et al., 2001). To reduce noise contamination of bursting analysis, cells with overall firing rates <0.1 Hz were excluded (similar results were obtained with rate thresholds from 0.01 to 0.5 Hz).
Spectral analysis.
To obtain independent spectral estimates, LFP data from waking and REM were divided into nonoverlapping 1 s windows. Theta (4–12 Hz) and gamma band (40–120 Hz) power and coherence analysis was performed using Morlet wavelet analysis (courtesy of Aslak Grinsted Arctic Centre, University of Lapland, Rovaniemi, Finland) and multitaper Fourier analysis (Mitra and Pesaran, 1999). Coherence was calculated on the CSD estimates to avoid contamination from volume conduction and was calculated for all channels with respect to one channel from each specified anatomical layer. The spectral power was converted to decibels (10 × log10) and the coherence was transformed by the hyperbolic arc tangent such that the sample distributions would approximate a Gaussian (Thomson and Chave, 1991). For each cell, 1 s epochs with at least four spikes were detected. From these epochs, cells with at least 5 Hz average firing were included in spectral analysis (similar results were obtained with different rate thresholds). Phasic REM was detected using a 2 SD threshold of the integrated spectral power (0–250 Hz) of the whitened signal (Mitra and Pesaran, 1999), averaged across dentate molecular layer sites. Threshold crossings were subsequently subjected to a local maxima search in a ±1 s window to ensure the peaks of phasic bursts were detected. Theta wavelength variability was investigated in the time domain by detecting peaks of the filtered (4–12 Hz) LFP and quantified using temporal autocorrelations and the second temporal derivative of spike times (i.e., the change in interpeak interval).
Statistics.
To perform group statistics, up to one site per silicon probe shank was a priori chosen to represent each anatomical layer (based on above electrode localization) (Montgomery and Buzsaki, 2007). Choosing one channel ensured greater statistical independence of layer sampling (at least 300 μm between sites) and prevented contamination from sites on the border between two layers. For each site, the difference across behaviors (e.g., REM vs waking) was calculated and the distribution of difference scores was tested against the null hypothesis of zero change. LFP results were tested using Bonferroni-corrected t tests after checking assumptions of normality and homogeneity of variance. Unit results were tested using Bonferroni-corrected nonparametric within-cell Kruskal–Wallis and post hoc tests.
Results
LFPs and unit activity were recorded simultaneously from the dentate gyrus, CA3, and CA1 regions of the dorsal hippocampus using a two-dimensional silicon probe array with 96 monitoring sites. In agreement with previous observations, the in situ recording sites in the various anatomical regions and layers could be determined with high spatial resolution (±30 μm) using a combination of spontaneous LFP patterns, multiple-unit activity, evoked potentials in response to perforant path or commissural stimulation, and post hoc histological identification of the anatomical position of each recording shank (Fig. 1A,B) (Csicsvari et al., 2003b; Montgomery and Buzsaki, 2007). To observe sustained theta/gamma oscillations, rats (n = 4) were tested during active waking on an elevated maze and during REM sleep in the home cage (see Materials and Methods). To confine our analysis to theta-associated behaviors, maze epochs associated with occasional stops and other consummatory behaviors, as reflected by <5 cm/s locomotion speed, were excluded from the analysis. REM sleep was identified by large changes in the LFPs from large amplitude slow oscillations and ripples associated with slow-wave sleep (Isomura et al., 2006) to theta rhythm in the absence of locomotion or overt movements.
Increased dentate–CA3 synchrony and decreased CA3–CA1 synchrony during REM sleep
Although theta/gamma oscillations were continuously present during both waking and REM sleep states, striking differences in their regional distributions were obvious, even by visual inspection of the raw LFP traces (Fig. 1C,D). During REM sleep, 6–8 Hz theta waves and high-frequency gamma oscillations dominated in the dentate, whereas waking activity was accompanied by smaller amplitude 8–10 Hz theta waves and gamma activity in this region. To quantify these effects, the power of LFP theta (4–12 Hz) and gamma (40–120 Hz) oscillations were calculated separately for each recording site in both states (Fig. 2A) and the power differences between the states displayed on a pseudocolor scale (Fig. 2B). To exclude potential contamination of LFP by volume-conducted fields, an identical analysis was also performed on the calculated current source density traces (see Materials and Methods). Group comparisons of both LFP and CSD confirmed that theta and gamma power was significantly enhanced during REM sleep in the dentate gyrus. Despite similar CA1 theta power in REM and wake, the second and third harmonics of theta oscillations, reflecting theta wave shape asymmetry, were typically higher during running segments (Figs. 1C,D, 2A) (Buzsaki et al., 1986; Terrazas et al., 2005). However, CA1 showed significantly decreased gamma power during REM sleep (Fig. 2C,D). Coherence analysis supported and extended the conclusions drawn from the power analyses. In general, during REM sleep, theta coherence significantly increased among layers of the dentate gyrus and between dentate layers and the CA3 pyramidal layer (Fig. 3). The CA3 pyramidal layer also showed significantly increased theta coherence with CA1 stratum (str.) radiatum, whereas theta coherence between CA1 str. radiatum and the neighboring CA1 str. pyramidale and str. lacunosum-moleculare decreased significantly. Similarly, gamma coherence during REM sleep significantly increased between the dentate molecular layer and both the hilar region and the CA3c pyramidal layer. Gamma coherence in the CA3–CA1 axis, however, diminished during REM sleep, with highly significant decreases among CA1 layers and between the CA3 pyramidal layer and CA1 str. pyramidale and radiatum.
Figure 2.
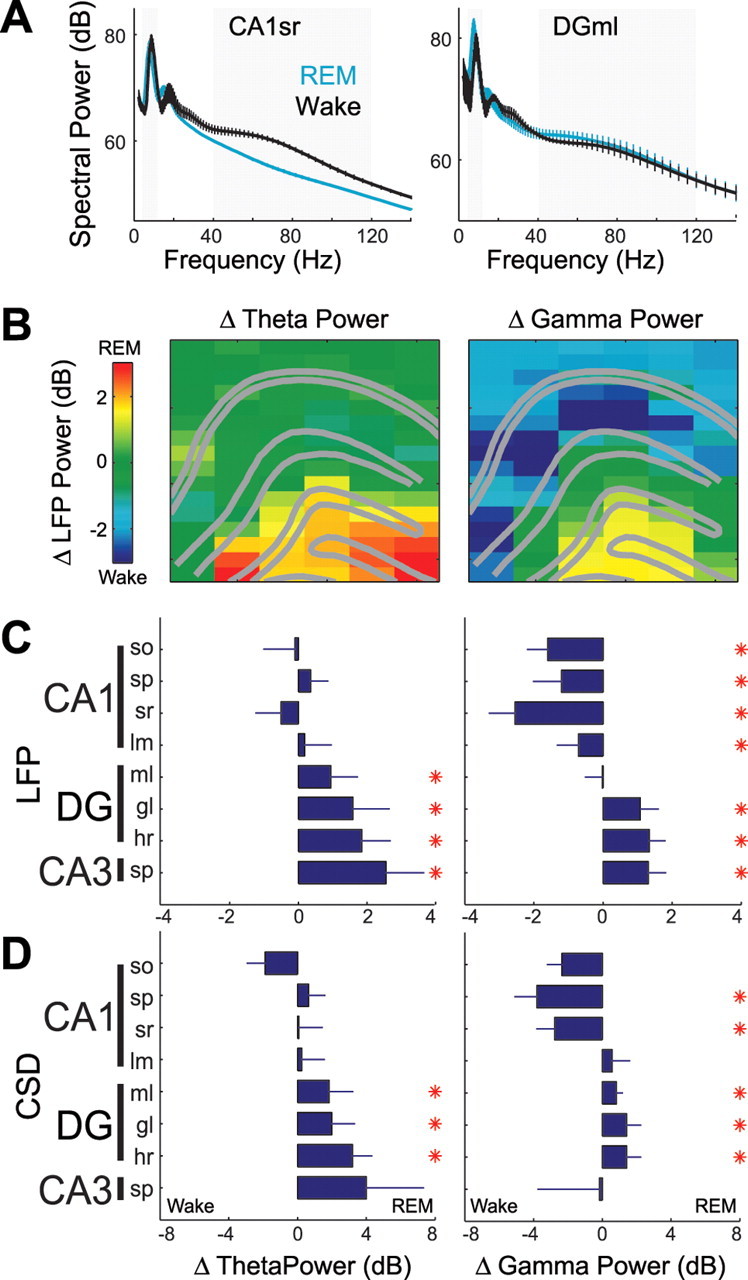
Region-specific changes in hippocampal theta and gamma power during REM sleep versus active waking behavior. A, Example power spectra from one animal (decibels; ±SEM across recording sites) of local currents recorded from CA1 stratum radiatum (CA1sr) (n = 6 sites) and dentate molecular layer (DGml) (n = 4 sites) sites during a single recording session including REM and waking. Theta (4–12 Hz) and gamma (40–120 Hz) frequency ranges are highlighted in gray. B–D, Changes in the power (amplitude) of theta (left column) and gamma (right column) oscillations across REM and waking states (REM − wake). Positive values indicate increases during REM sleep compared with active waking behavior. B, Anatomical profile showing state-dependent changes in LFP power for each recording site from one recording session. C, D, Group statistics showing changes in LFP (C) and current source density (CSD) (D) power across different layers of hippocampal subregions (decibels; ±SEM; *p < 0.01, Bonferroni-corrected t tests). Calculating dB = 10 × log10(voltage2), a 1–4 dB change is equivalent to a 12–58% change in the voltage amplitude of the raw LFP oscillation. Abbreviations: CA, Cornu ammonis; so, stratum oriens; sp, stratum pyramidale; sr, stratum radiatum; lm, stratum lacunosum moleculare; ml, molecular layer; gl, granule layer; hr, hilar region.
The frequency of theta oscillations was significantly higher during running in the maze than during REM sleep (Fig. 4G) (p < 0.001). Differences in waking and REM theta frequency have been reported previously (Louie and Wilson, 2001), although other findings (Leung, 1984) suggest the effect may depend on the specific waking behavior. However, the power and coherence observations summarized above cannot be simply explained by the specific motor behaviors in the waking rat, because similar results were obtained when running speeds and differences in theta frequency were also considered (supplemental Figs. 2, 3, available at www.jneurosci.org as supplemental material). The frequency and layer specificity of these effects, in addition to the CSD results (Figs. 2, 3), further subdue any potentially confounding effects of volume conduction. Overall, the findings reflect a fundamental difference in network operation between REM sleep and waking states. During REM sleep, there is a high degree of synchronous processing in the dentate/CA3 regions, especially at theta frequencies, whereas during waking there is a shift to greater gamma-mediated coordination between CA3 and CA1.
Figure 4.

Identification of phasic activity bursts in the dentate gyrus. A, Whitened spectrogram of an LFP recorded from the dentate molecular layer showing a typical period from REM sleep. Note the transient increases in the power and peak frequency of both theta and gamma oscillations. The gamma power increase in the whitened spectrum typically peaked at ∼100 Hz, but the elevated power in these bursts often extended up to ∼250 Hz. B, Phasic bursts of activity in REM sleep were detected using a threshold of 2 SDs from the average molecular layer integrated whitened power (0–250 Hz). C, Typical example of the dentate molecular layer LFP during a detected burst of activity. D, LFP power spectra in the dentate molecular layer compared across different behavioral states (decibels; mean ± SEM across 18 DGml recording sites). E, Granule layer multiple-unit firing rates increased during detected phasic bursts (n = 13; ±SEM). F–H, Lower theta frequency and greater wave-by-wave variability during low-power “tonic” periods than during detected phasic periods or active waking behavior. F, Example autocorrelogram of theta peaks. G, Group data histogram of peak theta frequencies calculated from 1 s spectral estimates. H, Wave-by-wave change in theta wavelength (second temporal derivative of theta peak times) with bootstrapped 95% confidence bars.
Figure 3.
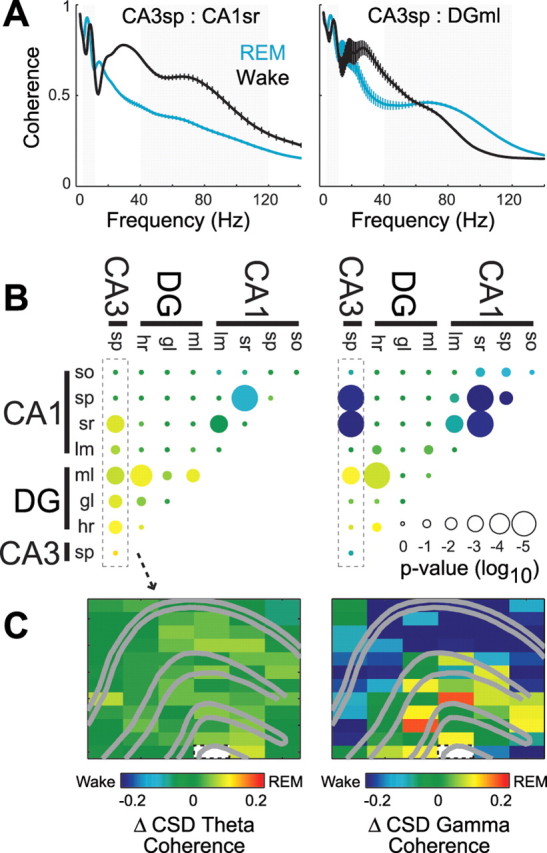
Behavior-dependent changes in theta and gamma coherence across hippocampal regions. A, Example coherence spectra from one animal (±SEM across recording site pairs) between CA3sp and CA1sr (top; n = 6 pairs) and between CA3sp and DGml (bottom; n = 4 pairs) during REM and waking. Note the peak in gamma coherence ∼80 Hz that varies differentially between site pairs across behavioral states. Coherence peaks in the 15–30 Hz range during waking likely reflect increased theta harmonics during running behavior (Figs. 1, 2) (Buzsaki et al., 1986; Terrazas et al., 2005). B, C, Changes in CSD theta (left column) and gamma (right column) coherence across REM and waking states (REM − wake). B, Group statistics showing REM sleep-associated change in theta and gamma coherence between all hippocampal layer pairs. The color of each dot shows the average within-pair change in coherence, and size of the dot indicates the significance of Bonferroni-corrected t tests. The outlined column of dots corresponds to the profile of changes in coherence with respect to the CA3 pyramidal layer (CA3sp). C, Example anatomical profile of the changes in coherence with respect to the CA3 pyramidal layer (outlined white pixel) from one recording session. Other abbreviations are as defined in the legend to Figure 2.
Phasic activation of hippocampal networks during REM sleep
The frequency and power of theta and gamma oscillations were more variable during REM sleep than while running in the maze (Fig. 4 F–H; supplemental Fig. 4, available at www.jneurosci.org as supplemental material). Previous work has shown that sudden increases in theta frequency and power during REM sleep are associated with clusters of eye movements, ponto-geniculo-occipital spikes, muscle twitches, accelerated or irregular heart rate and respiration (Sakai et al., 1973; Sano et al., 1973; Robinson et al., 1977; Lerma and Garcia-Austt, 1985; Valle et al., 1992; Sei and Morita, 1996; Rowe et al., 1999; Karashima et al., 2005), and distinguished these episodes as phasic REM sleep from the tonic REM epochs, characterized by steady muscle atonia. Examining the laminar profile of LFP activity during REM sleep, we found phasic increases in the power and frequency of both theta and gamma oscillations, most prominent in the molecular layer of the dentate gyrus (Fig. 4). These phasic power increases had spectral peaks in the theta and gamma bands, although the power often showed broad-band increases, up to nearly 250 Hz. Examining several combinations of spectral parameters, we found that these phasic bouts of activity were best characterized by increases in the integrated power (0–250 Hz) averaged across dentate molecular layer recording sites (Fig. 4B). Using a threshold of 2 SDs, we detected 131 phasic bouts (typically lasting 1–2 s) of a total of 3337 s of REM sleep (3.9% across all animals). Theta frequency during phasic REM epochs was comparable with theta present during running behavior and significantly higher than during tonic REM sleep (Fig. 4D,G) (p < 0.001). These phasic LFP changes were consistently associated with increased unit activity in the dentate gyrus and CA1, but not in CA3 (Figs. 4E, 6A; supplemental Fig. 6, available at www.jneurosci.org as supplemental material). In addition to the distinct phasic REM epochs, theta power also showed variability within tonic REM periods. This theta power fluctuation during tonic REM may reflect “replay” of waking patterns (Louie and Wilson, 2001), or, alternatively, a modulation by underlying slower rhythms (Leopold et al., 2003). Another major difference between the waking state and REM sleep was the higher variability of the theta wave periods during tonic REM (Fig. 4F,H). This was not simply attributable to gradual or systematic shifts in frequency because comparing adjacent wave-by-wave periods revealed a significantly larger theta wave variability in tonic REM compared with phasic REM sleep and waking theta (Fig. 4H) (|Δwavelength|, p = 0, Kruskal–Wallis and post hoc tests).
Figure 6.

Behavior-dependent changes in hippocampal unit firing. A–C, Changes in firing properties of CA1 pyramidal cells (pyr) (top row), dentate granule layer interneurons (int) (middle row), and CA3 pyramidal cells (bottom row) during active waking (black), phasic (red), and tonic (cyan) REM sleep. Changes in firing rate (CA1, n = 28; DG, n = 10; CA3, n = 27) (A), bursting [fraction of interspike intervals (ISIs) <6 ms (Harris et al., 2001); CA1, n = 18; DG, n = 10; CA3, n = 18] (B), and unit-firing theta (4–12 Hz) and gamma (40–120 Hz) rhythmicity [rate normalized spectral analysis (Jarvis and Mitra, 2001); CA1, n = 15; DG, n = 10; CA3, n = 13] (C). D, Changes in unit-CSD coherence across active waking and tonic REM sleep. Top row, One second example of a putative interneuron and simultaneously recorded CSD from the dentate granule layer. Note the high degree of unit firing theta rhythmicity and phase locking to local currents. Middle row, Average coherence spectrum of all granule layer interneurons with dentate hilar region CSD traces. Bottom row, Group statistics showing theta and gamma coherence changes between granule layer interneuron firing and CSD traces recorded from all hippocampal layers (CA1, n = 15; DG, n = 10; CA3, n = 13). Because of small sampling and potential contamination from nonstationarity effects, phasic REM was excluded from unit spectral analyses. CA1 and CA3 pyramidal cells were further excluded from coherence analyses because of insufficient firing rates. See Materials and Methods for firing rate inclusion criteria of bursting and spectral analyses. All results were statistically tested using Bonferroni-corrected within-cell nonparametric Kruskal–Wallis and post hoc tests; *p < 0.05. Other abbreviations are as defined in the legend to Figure 2.
Phasic REM epochs transiently synchronize DG, CA3, and CA1 networks
Because of the significant differences between phasic and tonic stages of REM sleep, we analyzed the changes in the anatomical profile of theta and gamma power and coherence patterns separately for each state. Because REM sleep is dominated by tonic REM activity with only short interspersed episodes of phasic patterns (Hobson and Pace-Schott, 2002), the wake versus tonic REM analyses yielded essentially the same results (supplemental Fig. 5, available at www.jneurosci.org as supplemental material) as the wake versus entire REM sleep sessions (Figs. 2, 3). Compared with tonic REM periods, phasic REM epochs showed increased theta and gamma power throughout most hippocampal layers (Fig. 5A). Comparing phasic versus tonic REM also showed increased theta coherence among CA1 layers and between the dentate and CA1 (Fig. 5B,C), the latter possibly indicative of more coherent inputs from layers 2 and 3 of the entorhinal cortex to the dendrites of the dentate and CA1, respectively. Gamma coherence increased among nearly all hippocampal regions during phasic REM compared with tonic REM (Fig. 5B,C), suggesting that, whereas tonic REM is associated primarily with dentate/CA3 gamma synchrony, phasic epochs may provide short windows in which the dentate, CA3, and CA1 transiently synchronize. These highly significant results were obtained despite the relatively small number of detected phasic epochs, indicating robust changes in hippocampal network coordination during phasic REM sleep. Using alternative phasic detection criteria (e.g., REM epochs with theta frequency in the highest five percentile) yielded similar effects (data not shown).
Figure 5.

Changes in hippocampal network coordination during phasic REM versus tonic REM and active waking. A–F, Changes in theta and gamma synchrony (left and right panels of each subplot, respectively) between phasic and tonic REM sleep (A–C) (phasic − tonic) and between phasic REM and active waking (D–F) (phasic − waking). A, B, D, E, Group statistics show changes in CSD power (A, D) (decibels; ±SEM; Bonferroni-corrected t tests) and coherence (B, E) (dot color, mean within-site change; dot size, significance of Bonferroni-corrected t tests; *p < 0.01). C, F, Examples from one recording session showing anatomical maps of coherence changes with respect to a single reference site (white pixel) illustrating the highlighted group of layer pairs (dotted outline) in B and E. Abbreviations are as defined in the legend to Figure 2.
The coordination of hippocampal networks during phasic REM epochs also showed differences from the waking state (Fig. 5 D–F). Theta power was significantly greater in phasic REM than during wake across nearly all hippocampal layers, and theta coherence was increased among layers of the dentate, CA3, and apical dendritic layers of CA1 during phasic REM. Gamma power also showed large increases in the dentate gyrus during phasic REM, although a slight but significant decrease in CA1 str. radiatum compared with the waking state (p < 0.01). Similarly, gamma coherence showed significant increases among dentate layers and between the dentate and CA3/CA1 layers during phasic REM. Although there was a decrease in gamma coherence between CA1 str. radiatum and str. pyramidale, there was no significant difference in CA3–CA1 gamma coherence (p > 0.05) between phasic REM and waking, possibly suggesting a differential contribution of CA1 apical, basal, and perisomatic compartments in mediating CA3–CA1 gamma coordination during phasic REM. In total, these data suggest that, during phasic REM, dentate/CA3 networks are even more synchronized by both theta and gamma oscillations than during tonic REM sleep. Furthermore, during phasic epochs, coordination among dentate, CA3, and CA1 networks is transiently reinstated.
Changes in single-unit firing properties between waking and REM sleep states
Although the spacing of the recording sites of the 96 site silicon probe is not ideal for single-unit separation (Wilson and McNaughton, 1993), we could nevertheless isolate several putative principal cells and interneurons in various regions and layers (Csicsvari et al., 1999). We recorded from a variety of cell types in different layers (supplemental Fig. 6, available at www.jneurosci.org as supplemental material), but for statistical analysis we confined our analysis to putative CA1 and CA3 pyramidal cells and fast firing, putative dentate granule layer interneurons (Fig. 6). The discharge rates of dentate area putative interneurons and CA1 pyramidal cells mirrored the changes of LFP power, being highest during phasic REM sleep (Fig. 6A). In contrast, the activity of CA3 pyramidal cells was significantly lower during tonic REM compared with waking state, whereas phasic REM sleep rates showed intermediate values. The incidence of “burst” discharges (defined as spikes at <6 ms intervals) (Ranck, 1973; Harris et al., 2001) of dentate interneurons and CA1 principal cells were higher during phasic REM than during tonic REM or waking behavior (Fig. 6B), whereas CA3 pyramidal cells showed the highest incidence of bursting during tonic REM sleep. These results show that CA1 and dentate neurons selectively increase output firing and bursting during phasic REM, whereas CA3 firing rates and bursting change somewhat independently of firing in other hippocampal networks.
Rhythmic discharge activity of hippocampal neurons was congruent with the power changes of the LFP and CSD. We assessed rhythmic firing of neurons by calculating rate-normalized power spectra of unit firing patterns (Fig. 6C) (Jarvis and Mitra, 2001). The low number of spikes recorded during the short and sparsely occurring phasic REM epochs precluded quantitative analysis of firing patterns during phasic REM sleep. In accord with the field analysis, dentate interneurons and CA3 pyramidal cells showed increased theta rhythmicity during tonic REM compared with the waking state, whereas CA1 pyramidal cells showed no significant difference between these two states. Furthermore, CA3 and CA1 neurons showed greater gamma rhythmicity during active waking than during tonic REM, congruent with the field results and underscoring the generation of these patterns by local networks. Finally, we analyzed the degree to which neuronal firing phase-locked with extracellular currents recorded from other hippocampal layers (Fig. 6D). Although firing rates of CA3 and CA1 neurons were too low to obtain reliable results, dentate interneurons showed significantly increased theta coherence with CSD traces across most hippocampal layers during tonic REM sleep compared with waking. Dentate interneurons showed a split effect of unit-CSD gamma coherence, with significantly increased coherence with dentate recording sites and significantly decreased coherence with CA1 str. radiatum during tonic REM. Thus, the unit results support and extend the LFP analysis and show how firing patterns of single neurons coordinate within and across hippocampal networks during active waking and REM sleep.
Discussion
Numerous functions have been postulated for REM sleep since its discovery >50 years ago (Aserinsky and Kleitman, 1953), but the best consensus is that we need a better understanding of REM sleep physiology to shape our functional theories (Gottesmann, 2001; Walker and Stickgold, 2004). REM sleep is not only the state with the highest threshold to arousing perturbations from the body and the environment, but it also minimizes the brain's ability to control the skeletal muscle system (Chase and Morales, 1990). This dramatically different behavioral state has been assumed to be “paradoxically” associated with seemingly identical physiological forebrain patterns as in the fully waking brain (Llinas and Pare, 1991; Jouvet, 1999; Steriade, 2000). The present results, however, reveal distinct changes in the coordination of hippocampal networks across REM and waking states, implicating fundamentally different intrahippocampal processing in the waking and sleeping animal.
The state-dependent shifts in theta and gamma coordination of hippocampal subregions is summarized in Figure 7. Overall, we found increased dentate/CA3 theta and gamma synchrony during REM sleep compared with active waking behavior. In contrast, gamma power in CA1 and CA3–CA1 gamma coherence showed significant decreases in REM sleep. Changes in unit firing rhythmicity and unit-field coherence further specified the local generation of these patterns. Although these patterns of hippocampal network coordination characterized the more common tonic periods of REM sleep (∼95% of total REM), we also detected large phasic bursts of LFP power in the dentate molecular layer, accompanied by transient increases in the firing of dentate and CA1 neurons. In contrast to tonic REM periods, these phasic REM epochs were characterized by higher theta and gamma synchrony among the dentate, CA3, and CA1 regions. Although phasic REM patterns, exhibiting high CA3–CA1 gamma coherence and relatively consistent theta wave periods, were more similar to waking activity than activity during tonic REM sleep, phasic REM sleep also significantly differed from patterns of the waking state.
Figure 7.

Summary of hippocampal network coordination during active waking and tonic and phasic REM sleep. Bar height reflects within-region synchrony changes, combining the effects of CSD power, within-region CSD coherence, unit rhythmicity, and within-region unit-CSD coherence. The arrow thickness reflects between-region coordination changes, combining CSD coherence and unit-CSD coherence between different hippocampal regions. Note the increase in dentate synchrony and dentate–CA3 coordination at theta and gamma frequencies during tonic REM sleep compared with active waking. In contrast, gamma synchrony in CA1 and CA3–CA1 gamma coordination was significantly lower during tonic REM sleep than active waking. Phasic REM, however, is accompanied by high theta and gamma synchronization throughout the trisynaptic circuit.
Critical role of the CA3 region in coordinating hippocampal networks
The role of the CA3 region in these operational shifts in hippocampal processing is likely to be critical. Gamma rhythmicity of CA3 unit firing decreased during tonic REM, likely contributing to the decreased CA1 gamma power and CA3–CA1 gamma coherence (Bragin et al., 1995a; Fisahn et al., 1998; Csicsvari et al., 2003a; Mann and Paulsen, 2005). Interestingly, compared with the waking state, during tonic REM sleep there is no change in CA3 gamma power and a significant increase in gamma coherence between the dentate molecular layer and the CA3 pyramidal layer. These results suggest that, during tonic REM sleep, there may be a state-dependent shift in the contribution of local CA3 perisomatic inhibition and other proximal inputs (e.g., mossy fiber input) to local CA3sp gamma currents, and this shift may result in a failure to entrain output spiking. Furthermore, whereas CA3 pyramidal cells show less gamma rhythmicity during tonic REM, they show increased theta rhythmicity. Similarly, local CA3 theta currents show increased coherence with specific dentate and CA1 layers, perhaps reflecting enhanced coherence of the layer 2 and layer 3 entorhinal cortical inputs (Chrobak and Buzsaki, 1998). These combined results suggest that the CA3 region defaults to the broader theta rhythm to mediate coordination of hippocampal networks during tonic REM at the expense of the temporally and spatially more precise gamma coordination. These findings may be contrasted with the theta–gamma changes in the absence of entorhinal inputs. After surgical removal of the entorhinal cortex, the decreased theta power in the DGml and CA1lm is associated with a remarkable increase of CA3 gamma power and increased gamma coherence between CA3 and CA1 regions (Bragin et al., 1995a). These combined findings support the hypothesis that both the dentate and the CA3 networks contribute to gamma oscillations (Bragin et al., 1995a; Csicsvari et al., 2003a).
Mechanisms of hippocampal activity patterns during REM sleep
A prominent difference between REM sleep and the waking state is a change in subcortical neuromodulator tone. Whereas the concentration of acetylcholine (ACh) in the hippocampus is high during both REM sleep and active waking (Marrosu et al., 1995), norepinephrine, serotonin, and histamine are high during waking, but nearly absent during REM sleep (Aston-Jones and Bloom, 1981; Park et al., 1999; Brown et al., 2001). Noradrenergic, serotonergic, and histaminergic fibers densely innervate specific hippocampal layers (Inagaki et al., 1988; Amaral and Witter, 1995) and each of these modulators exert numerous actions on hippocampal neuronal firing (Vizi and Kiss, 1998; Nitz and McNaughton, 1999), synaptic transmission (Segal, 1981a,b,c; Brown et al., 1995; Brown and Haas, 1999), neuronal resonant properties (Hu et al., 2002), and LFP theta and gamma oscillations (Krause and Jia, 2005; Kocsis et al., 2007; Hajos et al., 2008). These subcortical mechanisms likely explain the difference between waking and tonic REM sleep. However, hippocampal patterns underlying phasic episodes of REM sleep differed from both active waking and tonic REM sleep. A potential explanation is that pontine waves during phasic REM episodes fire brainstem cholinergic neurons (Datta, 1997) and are associated with increased power and frequency of hippocampal theta oscillations (Karashima et al., 2005). Previous work, however, has shown that phasic epochs of hippocampal theta during sleep, similar to movement-associated theta in the waking animal, are resistant to muscarinic ACh receptor blockade (Kramis et al., 1975; Robinson et al., 1977), although nicotinic receptors may play a role in phasic REM periods (Reinoso-Suarez et al., 2001). Additionally, whereas serotonergic neuron firing is inversely related to the occurrence of pontine waves (McGinty and Harper, 1976), noradrenergic neurons in the locus ceruleus fire short bursts of activity correlated with pontine waves (Chu and Bloom, 1973). These bursts may release sufficient amount of the critical neurotransmitter to transiently reinstate synchrony among hippocampal networks and perhaps exert similar effects on neocortical circuits as well.
Functional implications of REM/waking changes in hippocampal network synchrony
Greater LFP synchrony reflects higher temporal coincidence of synaptic activity (Buzsaki and Draguhn, 2004), promoting greater plasticity and spike transmission, and has been suggested to reflect enhanced local processing (Gray et al., 1989; Engel et al., 2001). Consistent with this, previous results have shown greater plasticity-related gene expression in the dentate gyrus during REM sleep (Ribeiro et al., 1999), which may result from increased dentate synchrony in this state. More broadly, during REM sleep, the dentate may engage pattern separation (Rolls, 1996; Leutgeb et al., 2007) and/or recombination of previous memories to facilitate novel inferences (Walker and Stickgold, 2004). Interestingly, during tonic REM, CA3–CA1 gamma coherence significantly decreases, whereas theta coherence is maintained or slightly increased. Because theta oscillations exhibit a more global synchronization across the extent of the hippocampus than gamma oscillations (Bragin et al., 1995a; Buzsaki, 2002), this difference between theta and gamma may reflect a decrease in the extent to which local assemblies can transmit specific information across these networks (Harris et al., 2003), while maintaining global synchronization of the system. From this perspective, we may speculate that increased temporal coordination and neuronal firing in the dentate area during tonic REM sleep may bring about plastic changes within this region but these effects are not transmitted through CA3 to CA1 and downstream targets. The altered balance of input of CA3 and the entorhinal inputs to CA1 may further explain the theta phase reversal of specific CA1 pyramidal cells during REM sleep (Poe et al., 2000).
We also found phasic periods of REM sleep that transiently increased theta and gamma synchrony in the dentate, CA3, and CA1 regions, in contrast to the limited CA3–CA1 gamma coherence during tonic REM sleep. Recent work has implicated the pontine waves associated with phasic REM as important for hippocampus-dependent memory consolidation (Datta et al., 2004, 2005; Mavanji et al., 2004). Reinstatement of CA3–CA1 communication during phasic bouts of REM sleep may provide windows of opportunity for information encoded in the dentate during tonic REM to be replayed back to the neocortex (Louie and Wilson, 2001). Because these phasic epochs transiently reestablished waking-like communication between the hippocampal regions and increased output to the neocortex, it is also possible that these short but powerful episodes are responsible for generating the dream content of sleep. These phasic windows are of particular interest in light of recent observations in depth recording from the hippocampus in human epileptic patients. In contrast to the continuous presence of theta throughout REM sleep in lower animals, theta oscillations in these human subjects were only observed in short bouts lasting a second or so (Cantero et al., 2003) (but see Bodizs et al., 2001). Thus, it is possible that, in humans, only the phasic REM-associated, large-amplitude theta bouts are detectable.
Overall, our data show that hippocampal subregions exhibit dynamic oscillatory coupling at theta and gamma frequencies. Even within “theta behaviors,” hippocampal networks engage differential coupling patterns that may reflect specific modes of operation. The present data reveal large-scale changes in hippocampal network coordination between active waking, tonic and phasic REM sleep and cast a new light on hippocampal function during REM sleep.
Footnotes
This work was supported by National Institutes of Health Grants NS34994 and MH54671, the National Science Foundation, and the J. McDonnell Foundation. We thank Martha Betancur for assistance with behavioral training. Thanks to Ken Harris, Stephan Marguet, Asohan Amarasingham, Denis Paré, Kenji Mizuseki, Kamran Diba, Bernat Kocsis, and Robert Vertes for advice and support, and to Aslak Grinsted for providing wavelet coherence algorithms.
References
- Amaral DG, Witter MP. Hippocampal formation. In: Paxinos G, editor. The rat nervous system. New York: Academic; 1995. pp. 443–490. [Google Scholar]
- Aserinsky E, Kleitman N. Regularly occurring periods of eye motility, and concomitant phenomena, during sleep. Science. 1953;118:273–274. doi: 10.1126/science.118.3062.273. [DOI] [PubMed] [Google Scholar]
- Aston-Jones G, Bloom FE. Activity of norepinephrine-containing locus coeruleus neurons in behaving rats anticipates fluctuations in the sleep-waking cycle. J Neurosci. 1981;1:876–886. doi: 10.1523/JNEUROSCI.01-08-00876.1981. [DOI] [PMC free article] [PubMed] [Google Scholar]
- Bartho P, Hirase H, Monconduit L, Zugaro M, Harris KD, Buzsaki G. Characterization of neocortical principal cells and interneurons by network interactions and extracellular features. J Neurophysiol. 2004;92:600–608. doi: 10.1152/jn.01170.2003. [DOI] [PubMed] [Google Scholar]
- Bastuji H, Garcia-Larrea L. Evoked potentials as a tool for the investigation of human sleep. Sleep Med Rev. 1999;3:23–45. doi: 10.1016/s1087-0792(99)90012-6. [DOI] [PubMed] [Google Scholar]
- Berger RJ, Oswald I. Eye movements during active and passive dreams. Science. 1962;137:601. doi: 10.1126/science.137.3530.601. [DOI] [PubMed] [Google Scholar]
- Bodizs R, Kantor S, Szabo G, Szucs A, Eross L, Halasz P. Rhythmic hippocampal slow oscillation characterizes REM sleep in humans. Hippocampus. 2001;11:747–753. doi: 10.1002/hipo.1090. [DOI] [PubMed] [Google Scholar]
- Borbely AA, Tobler I. Endogenous sleep-promoting substances and sleep regulation. Physiol Rev. 1989;69:605–670. doi: 10.1152/physrev.1989.69.2.605. [DOI] [PubMed] [Google Scholar]
- Bragin A, Jando G, Nadasdy Z, Hetke J, Wise K, Buzsaki G. Gamma (40–100 Hz) oscillation in the hippocampus of the behaving rat. J Neurosci. 1995a;15:47–60. doi: 10.1523/JNEUROSCI.15-01-00047.1995. [DOI] [PMC free article] [PubMed] [Google Scholar]
- Bragin A, Jando G, Nadasdy Z, van Landeghem M, Buzsaki G. Dentate EEG spikes and associated interneuronal population bursts in the hippocampal hilar region of the rat. J Neurophysiol. 1995b;73:1691–1705. doi: 10.1152/jn.1995.73.4.1691. [DOI] [PubMed] [Google Scholar]
- Brown RE, Haas HL. On the mechanism of histaminergic inhibition of glutamate release in the rat dentate gyrus. J Physiol. 1999;515:777–786. doi: 10.1111/j.1469-7793.1999.777ab.x. [DOI] [PMC free article] [PubMed] [Google Scholar]
- Brown RE, Fedorov NB, Haas HL, Reymann KG. Histaminergic modulation of synaptic plasticity in area CA1 of rat hippocampal slices. Neuropharmacology. 1995;34:181–190. doi: 10.1016/0028-3908(94)00138-i. [DOI] [PubMed] [Google Scholar]
- Brown RE, Stevens DR, Haas HL. The physiology of brain histamine. Prog Neurobiol. 2001;63:637–672. doi: 10.1016/s0301-0082(00)00039-3. [DOI] [PubMed] [Google Scholar]
- Buzsaki G. Two-stage model of memory trace formation: a role for “noisy” brain states. Neuroscience. 1989;31:551–570. doi: 10.1016/0306-4522(89)90423-5. [DOI] [PubMed] [Google Scholar]
- Buzsaki G. Theta oscillations in the hippocampus. Neuron. 2002;33:325–340. doi: 10.1016/s0896-6273(02)00586-x. [DOI] [PubMed] [Google Scholar]
- Buzsaki G, Draguhn A. Neuronal oscillations in cortical networks. Science. 2004;304:1926–1929. doi: 10.1126/science.1099745. [DOI] [PubMed] [Google Scholar]
- Buzsaki G, Czopf J, Kondakor I, Kellenyi L. Laminar distribution of hippocampal rhythmic slow activity (RSA) in the behaving rat: current-source density analysis, effects of urethane and atropine. Brain Res. 1986;365:125–137. doi: 10.1016/0006-8993(86)90729-8. [DOI] [PubMed] [Google Scholar]
- Buzsaki G, Horvath Z, Urioste R, Hetke J, Wise K. High-frequency network oscillation in the hippocampus. Science. 1992;256:1025–1027. doi: 10.1126/science.1589772. [DOI] [PubMed] [Google Scholar]
- Cantero JL, Atienza M, Stickgold R, Kahana MJ, Madsen JR, Kocsis B. Sleep-dependent theta oscillations in the human hippocampus and neocortex. J Neurosci. 2003;23:10897–10903. doi: 10.1523/JNEUROSCI.23-34-10897.2003. [DOI] [PMC free article] [PubMed] [Google Scholar]
- Chase MH, Morales FR. The atonia and myoclonia of active (REM) sleep. Annu Rev Psychol. 1990;41:557–584. doi: 10.1146/annurev.ps.41.020190.003013. [DOI] [PubMed] [Google Scholar]
- Chrobak JJ, Buzsaki G. Operational dynamics in the hippocampal-entorhinal axis. Neurosci Biobehav Rev. 1998;22:303–310. doi: 10.1016/s0149-7634(97)00016-x. [DOI] [PubMed] [Google Scholar]
- Chu N, Bloom FE. Norepinephrine-containing neurons: changes in spontaneous discharge patterns during sleeping and waking. Science. 1973;179:908–910. doi: 10.1126/science.179.4076.908. [DOI] [PubMed] [Google Scholar]
- Crick F, Mitchison G. The function of dream sleep. Nature. 1983;304:111–114. doi: 10.1038/304111a0. [DOI] [PubMed] [Google Scholar]
- Csicsvari J, Hirase H, Czurko A, Mamiya A, Buzsaki G. Oscillatory coupling of hippocampal pyramidal cells and interneurons in the behaving rat. J Neurosci. 1999;19:274–287. doi: 10.1523/JNEUROSCI.19-01-00274.1999. [DOI] [PMC free article] [PubMed] [Google Scholar]
- Csicsvari J, Jamieson B, Wise KD, Buzsaki G. Mechanisms of gamma oscillations in the hippocampus of the behaving rat. Neuron. 2003a;37:311–322. doi: 10.1016/s0896-6273(02)01169-8. [DOI] [PubMed] [Google Scholar]
- Csicsvari J, Henze DA, Jamieson B, Harris KD, Sirota A, Bartho P, Wise KD, Buzsaki G. Massively parallel recording of unit and local field potentials with silicon-based electrodes. J Neurophysiol. 2003b;90:1314–1323. doi: 10.1152/jn.00116.2003. [DOI] [PubMed] [Google Scholar]
- Datta S. Cellular basis of pontine ponto-geniculo-occipital wave generation and modulation. Cell Mol Neurobiol. 1997;17:341–365. doi: 10.1023/A:1026398402985. [DOI] [PMC free article] [PubMed] [Google Scholar]
- Datta S, Mavanji V, Ulloor J, Patterson EH. Activation of phasic pontine-wave generator prevents rapid eye movement sleep deprivation-induced learning impairment in the rat: a mechanism for sleep-dependent plasticity. J Neurosci. 2004;24:1416–1427. doi: 10.1523/JNEUROSCI.4111-03.2004. [DOI] [PMC free article] [PubMed] [Google Scholar]
- Datta S, Saha S, Prutzman SL, Mullins OJ, Mavanji V. Pontine-wave generator activation-dependent memory processing of avoidance learning involves the dorsal hippocampus in the rat. J Neurosci Res. 2005;80:727–737. doi: 10.1002/jnr.20501. [DOI] [PMC free article] [PubMed] [Google Scholar]
- Dement W, Wolpert EA. The relation of eye movements, body motility, and external stimuli to dream content. J Exp Psychol. 1958;55:543–553. doi: 10.1037/h0040031. [DOI] [PubMed] [Google Scholar]
- Diba K, Montgomery SM, Harris KD, Buzsaki G. Identification of silicon probe irregularities using analysis of in vivo recordings. Soc Neurosci Abstr. 2005;31:275–10. [Google Scholar]
- Engel AK, Fries P, Singer W. Dynamic predictions: oscillations and synchrony in top-down processing. Nat Rev Neurosci. 2001;2:704–716. doi: 10.1038/35094565. [DOI] [PubMed] [Google Scholar]
- Fisahn A, Pike FG, Buhl EH, Paulsen O. Cholinergic induction of network oscillations at 40 Hz in the hippocampus in vitro. Nature. 1998;394:186–189. doi: 10.1038/28179. [DOI] [PubMed] [Google Scholar]
- Gottesmann C. The golden age of rapid eye movement sleep discoveries. 1. Lucretius–1964. Prog Neurobiol. 2001;65:211–287. doi: 10.1016/s0301-0082(01)00014-4. [DOI] [PubMed] [Google Scholar]
- Grastyan E, Karmos G. A study of a possible “dreaming” mechanism in the cat. Acta Physiol Acad Sci Hung. 1961;20:41–50. [PubMed] [Google Scholar]
- Gray CM, Konig P, Engel AK, Singer W. Oscillatory responses in cat visual cortex exhibit inter-columnar synchronization which reflects global stimulus properties. Nature. 1989;338:334–337. doi: 10.1038/338334a0. [DOI] [PubMed] [Google Scholar]
- Hajos M, Siok CJ, Hoffmann WE, Li S, Kocsis B. Modulation of hippocampal theta oscillation by histamine H3 receptors. J Pharmacol Exp Ther. 2008;324:391–398. doi: 10.1124/jpet.107.130070. [DOI] [PubMed] [Google Scholar]
- Harris KD, Henze DA, Csicsvari J, Hirase H, Buzsaki G. Accuracy of tetrode spike separation as determined by simultaneous intracellular and extracellular measurements. J Neurophysiol. 2000;84:401–414. doi: 10.1152/jn.2000.84.1.401. [DOI] [PubMed] [Google Scholar]
- Harris KD, Hirase H, Leinekugel X, Henze DA, Buzsaki G. Temporal interaction between single spikes and complex spike bursts in hippocampal pyramidal cells. Neuron. 2001;32:141–149. doi: 10.1016/s0896-6273(01)00447-0. [DOI] [PubMed] [Google Scholar]
- Harris KD, Csicsvari J, Hirase H, Dragoi G, Buzsaki G. Organization of cell assemblies in the hippocampus. Nature. 2003;424:552–556. doi: 10.1038/nature01834. [DOI] [PubMed] [Google Scholar]
- Hazan L, Zugaro M, Buzsaki G. Klusters, NeuroScope, NDManager: a free software suite for neurophysiological data processing and visualization. J Neurosci Methods. 2006;155:207–216. doi: 10.1016/j.jneumeth.2006.01.017. [DOI] [PubMed] [Google Scholar]
- Hobson JA, Pace-Schott EF. The cognitive neuroscience of sleep: neuronal systems, consciousness and learning. Nat Rev Neurosci. 2002;3:679–693. doi: 10.1038/nrn915. [DOI] [PubMed] [Google Scholar]
- Hu H, Vervaeke K, Storm JF. Two forms of electrical resonance at theta frequencies, generated by M-current, h-current and persistent Na+ current in rat hippocampal pyramidal cells. J Physiol. 2002;545:783–805. doi: 10.1113/jphysiol.2002.029249. [DOI] [PMC free article] [PubMed] [Google Scholar]
- Inagaki N, Yamatodani A, Ando-Yamamoto M, Tohyama M, Watanabe T, Wada H. Organization of histaminergic fibers in the rat brain. J Comp Neurol. 1988;273:283–300. doi: 10.1002/cne.902730302. [DOI] [PubMed] [Google Scholar]
- Isomura Y, Sirota A, Ozen S, Montgomery S, Mizuseki K, Henze DA, Buzsaki G. Integration and segregation of activity in entorhinal-hippocampal subregions by neocortical slow oscillations. Neuron. 2006;52:871–882. doi: 10.1016/j.neuron.2006.10.023. [DOI] [PubMed] [Google Scholar]
- Jarvis MR, Mitra PP. Sampling properties of the spectrum and coherency of sequences of action potentials. Neural Comput. 2001;13:717–749. doi: 10.1162/089976601300014312. [DOI] [PubMed] [Google Scholar]
- Jouvet M. The paradox of sleep: the story of dreaming. Cambridge, MA: MIT; 1999. [Google Scholar]
- Karashima A, Nakao M, Katayama N, Honda K. Instantaneous acceleration and amplification of hippocampal theta wave coincident with phasic pontine activities during REM sleep. Brain Res. 2005;1051:50–56. doi: 10.1016/j.brainres.2005.05.055. [DOI] [PubMed] [Google Scholar]
- Kocsis B, Li S, Hajos M. Behavior-dependent modulation of hippocampal EEG activity by the selective norepinephrine reuptake inhibitor reboxetine in rats. Hippocampus. 2007;17:627–633. doi: 10.1002/hipo.20299. [DOI] [PubMed] [Google Scholar]
- Kramis R, Vanderwolf CH, Bland BH. Two types of hippocampal rhythmical slow activity in both the rabbit and the rat: relations to behavior and effects of atropine, diethyl ether, urethane, and pentobarbital. Exp Neurol. 1975;49:58–85. doi: 10.1016/0014-4886(75)90195-8. [DOI] [PubMed] [Google Scholar]
- Krause M, Jia Y. Serotonergic modulation of carbachol-induced rhythmic activity in hippocampal slices. Neuropharmacology. 2005;48:381–390. doi: 10.1016/j.neuropharm.2004.10.011. [DOI] [PubMed] [Google Scholar]
- Leopold DA, Murayama Y, Logothetis NK. Very slow activity fluctuations in monkey visual cortex: implications for functional brain imaging. Cereb Cortex. 2003;13:422–433. doi: 10.1093/cercor/13.4.422. [DOI] [PubMed] [Google Scholar]
- Lerma J, Garcia-Austt E. Hippocampal theta rhythm during paradoxical sleep. Effects of afferent stimuli and phase relationships with phasic events. Electroencephalogr Clin Neurophysiol. 1985;60:46–54. doi: 10.1016/0013-4694(85)90950-2. [DOI] [PubMed] [Google Scholar]
- Leung LS. Theta rhythm during REM sleep and waking: correlations between power, phase and frequency. Electroencephalogr Clin Neurophysiol. 1984;58:553–564. doi: 10.1016/0013-4694(84)90045-2. [DOI] [PubMed] [Google Scholar]
- Leutgeb JK, Leutgeb S, Moser MB, Moser EI. Pattern separation in the dentate gyrus and CA3 of the hippocampus. Science. 2007;315:961–966. doi: 10.1126/science.1135801. [DOI] [PubMed] [Google Scholar]
- Lissak K, Karmos G, Grastyan E. A peculiar dreamlike stage of sleep in the cat. Act Nerv Super (Praha) 1962;4:347–352. [PubMed] [Google Scholar]
- Llinas RR, Pare D. Of dreaming and wakefulness. Neuroscience. 1991;44:521–535. doi: 10.1016/0306-4522(91)90075-y. [DOI] [PubMed] [Google Scholar]
- Louie K, Wilson MA. Temporally structured replay of awake hippocampal ensemble activity during rapid eye movement sleep. Neuron. 2001;29:145–156. doi: 10.1016/s0896-6273(01)00186-6. [DOI] [PubMed] [Google Scholar]
- Mann EO, Paulsen O. Mechanisms underlying gamma (“40 Hz”) network oscillations in the hippocampus–a mini-review. Prog Biophys Mol Biol. 2005;87:67–76. doi: 10.1016/j.pbiomolbio.2004.06.004. [DOI] [PubMed] [Google Scholar]
- Marrosu F, Portas C, Mascia MS, Casu MA, Fa M, Giagheddu M, Imperato A, Gessa GL. Microdialysis measurement of cortical and hippocampal acetylcholine release during sleep-wake cycle in freely moving cats. Brain Res. 1995;671:329–332. doi: 10.1016/0006-8993(94)01399-3. [DOI] [PubMed] [Google Scholar]
- Mavanji V, Ulloor J, Saha S, Datta S. Neurotoxic lesions of phasic pontine-wave generator cells impair retention of 2-way active avoidance memory. Sleep. 2004;27:1282–1292. doi: 10.1093/sleep/27.7.1282. [DOI] [PubMed] [Google Scholar]
- McGinty DJ, Harper RM. Dorsal raphe neurons: depression of firing during sleep in cats. Brain Res. 1976;101:569–575. doi: 10.1016/0006-8993(76)90480-7. [DOI] [PubMed] [Google Scholar]
- Mitra PP, Pesaran B. Analysis of dynamic brain imaging data. Biophys J. 1999;76:691–708. doi: 10.1016/S0006-3495(99)77236-X. [DOI] [PMC free article] [PubMed] [Google Scholar]
- Mitzdorf U. Current source-density method and application in cat cerebral cortex: investigation of evoked potentials and EEG phenomena. Physiol Rev. 1985;65:37–100. doi: 10.1152/physrev.1985.65.1.37. [DOI] [PubMed] [Google Scholar]
- Montgomery SM, Buzsaki G. Gamma oscillations dynamically couple hippocampal CA3 and CA1 regions during memory task performance. Proc Natl Acad Sci USA. 2007;104:14495–14500. doi: 10.1073/pnas.0701826104. [DOI] [PMC free article] [PubMed] [Google Scholar]
- Muzur A. Toward an integrative theory of sleep and dreaming. J Theor Biol. 2005;233:103–118. doi: 10.1016/j.jtbi.2004.09.011. [DOI] [PubMed] [Google Scholar]
- Nitz DA, McNaughton BL. Hippocampal EEG and unit activity responses to modulation of serotonergic median raphe neurons in the freely behaving rat. Learn Mem. 1999;6:153–167. [PMC free article] [PubMed] [Google Scholar]
- Park SP, Lopez-Rodriguez F, Wilson CL, Maidment N, Matsumoto Y, Engel J., Jr In vivo microdialysis measures of extracellular serotonin in the rat hippocampus during sleep-wakefulness. Brain Res. 1999;833:291–296. doi: 10.1016/s0006-8993(99)01511-5. [DOI] [PubMed] [Google Scholar]
- Poe GR, Nitz DA, McNaughton BL, Barnes CA. Experience-dependent phase-reversal of hippocampal neuron firing during REM sleep. Brain Res. 2000;855:176–180. doi: 10.1016/s0006-8993(99)02310-0. [DOI] [PubMed] [Google Scholar]
- Ranck JB., Jr Studies on single neurons in dorsal hippocampal formation and septum in unrestrained rats. I. Behavioral correlates and firing repertoires. Exp Neurol. 1973;41:461–531. doi: 10.1016/0014-4886(73)90290-2. [DOI] [PubMed] [Google Scholar]
- Reinoso-Suarez F, de Andres I, Rodrigo-Angulo ML, Garzon M. Brain structures and mechanisms involved in the generation of REM sleep. Sleep Med Rev. 2001;5:63–77. doi: 10.1053/smrv.2000.0136. [DOI] [PubMed] [Google Scholar]
- Ribeiro S, Goyal V, Mello CV, Pavlides C. Brain gene expression during REM sleep depends on prior waking experience. Learn Mem. 1999;6:500–508. doi: 10.1101/lm.6.5.500. [DOI] [PMC free article] [PubMed] [Google Scholar]
- Robinson TE, Kramis RC, Vanderwolf CH. Two types of cerebral activation during active sleep: relations to behavior. Brain Res. 1977;124:544–549. doi: 10.1016/0006-8993(77)90954-4. [DOI] [PubMed] [Google Scholar]
- Rolls ET. A theory of hippocampal function in memory. Hippocampus. 1996;6:601–620. doi: 10.1002/(SICI)1098-1063(1996)6:6<601::AID-HIPO5>3.0.CO;2-J. [DOI] [PubMed] [Google Scholar]
- Rowe K, Moreno R, Lau TR, Wallooppillai U, Nearing BD, Kocsis B, Quattrochi J, Hobson JA, Verrier RL. Heart rate surges during REM sleep are associated with theta rhythm and PGO activity in cats. Am J Physiol. 1999;277:R843–R849. doi: 10.1152/ajpregu.1999.277.3.R843. [DOI] [PubMed] [Google Scholar]
- Sakai K, Sano K, Iwahara S. Eye movements and hipocampal theta activity in cats. Electroencephalogr Clin Neurophysiol. 1973;34:547–549. doi: 10.1016/0013-4694(73)90072-2. [DOI] [PubMed] [Google Scholar]
- Sakai K, El Mansari M, Lin JS, Zhang JG, Vanni-Mercier G. The posterior hypothalamus in the regulation of wakefulness and paradoxical sleep. In: Marini G, editor. The diencephalon and sleep. New York: Raven; 1990. pp. 171–198. [Google Scholar]
- Sano K, Iwahara S, Senba K, Sano A, Yamazaki S. Eye movements and hippocampal theta activity in rats. Electroencephalogr Clin Neurophysiol. 1973;35:621–625. doi: 10.1016/0013-4694(73)90215-0. [DOI] [PubMed] [Google Scholar]
- Segal M. The action of norepinephrine in the rat hippocampus: intracellular studies in the slice preparation. Brain Res. 1981a;206:107–128. doi: 10.1016/0006-8993(81)90104-9. [DOI] [PubMed] [Google Scholar]
- Segal M. Histamine modulates reactivity of hippocampal CA3 neurons to afferent stimulation in vitro. Brain Res. 1981b;213:443–448. doi: 10.1016/0006-8993(81)90251-1. [DOI] [PubMed] [Google Scholar]
- Segal M. The action of serotonin in the rat hippocampus. Adv Exp Med Biol. 1981c;133:375–390. doi: 10.1007/978-1-4684-3860-4_22. [DOI] [PubMed] [Google Scholar]
- Sei H, Morita Y. Effect of ambient temperature on arterial pressure variability during sleep in the rat. J Sleep Res. 1996;5:37–41. doi: 10.1046/j.1365-2869.1996.00007.x. [DOI] [PubMed] [Google Scholar]
- Siegel JM. The REM sleep-memory consolidation hypothesis. Science. 2001;294:1058–1063. doi: 10.1126/science.1063049. [DOI] [PMC free article] [PubMed] [Google Scholar]
- Steriade M. Corticothalamic resonance, states of vigilance and mentation. Neuroscience. 2000;101:243–276. doi: 10.1016/s0306-4522(00)00353-5. [DOI] [PubMed] [Google Scholar]
- Steriade M, Llinas RR. The functional states of the thalamus and the associated neuronal interplay. Physiol Rev. 1988;68:649–742. doi: 10.1152/physrev.1988.68.3.649. [DOI] [PubMed] [Google Scholar]
- Terrazas A, Krause M, Lipa P, Gothard KM, Barnes CA, McNaughton BL. Self-motion and the hippocampal spatial metric. J Neurosci. 2005;25:8085–8096. doi: 10.1523/JNEUROSCI.0693-05.2005. [DOI] [PMC free article] [PubMed] [Google Scholar]
- Thomson DJ, Chave AD. Jackknifed error estimates for spectra, coherences, and transfer functions. Advances in spectrum analysis and array processing. New York: Prentice Hall; 1991. Advances in spectrum analysis and array processing; pp. 58–113. [Google Scholar]
- Valle AC, Timo-Iaria C, Fraga JL, Sameshima K, Yamashita R. Theta waves and behavioral manifestations of alertness and dreaming activity in the rat. Braz J Med Biol Res. 1992;25:745–749. [PubMed] [Google Scholar]
- Vanderwolf CH. Hippocampal electrical activity and voluntary movement in the rat. Electroencephalogr Clin Neurophysiol. 1969;26:407–418. doi: 10.1016/0013-4694(69)90092-3. [DOI] [PubMed] [Google Scholar]
- Vertes RP. Memory consolidation in sleep; dream or reality. Neuron. 2004;44:135–148. doi: 10.1016/j.neuron.2004.08.034. [DOI] [PubMed] [Google Scholar]
- Vertes RP, Kocsis B. Brainstem-diencephalo-septohippocampal systems controlling the theta rhythm of the hippocampus. Neuroscience. 1997;81:893–926. doi: 10.1016/s0306-4522(97)00239-x. [DOI] [PubMed] [Google Scholar]
- Vizi ES, Kiss JP. Neurochemistry and pharmacology of the major hippocampal transmitter systems: synaptic and nonsynaptic interactions. Hippocampus. 1998;8:566–607. doi: 10.1002/(SICI)1098-1063(1998)8:6<566::AID-HIPO2>3.0.CO;2-W. [DOI] [PubMed] [Google Scholar]
- Walker MP, Stickgold R. Sleep-dependent learning and memory consolidation. Neuron. 2004;44:121–133. doi: 10.1016/j.neuron.2004.08.031. [DOI] [PubMed] [Google Scholar]
- Wehrle R, Kaufmann C, Wetter TC, Holsboer F, Auer DP, Pollmacher T, Czisch M. Functional microstates within human REM sleep: first evidence from fMRI of a thalamocortical network specific for phasic REM periods. Eur J Neurosci. 2007;25:863–871. doi: 10.1111/j.1460-9568.2007.05314.x. [DOI] [PubMed] [Google Scholar]
- Wilson MA, McNaughton BL. Dynamics of the hippocampal ensemble code for space. Science. 1993;261:1055–1058. doi: 10.1126/science.8351520. [DOI] [PubMed] [Google Scholar]