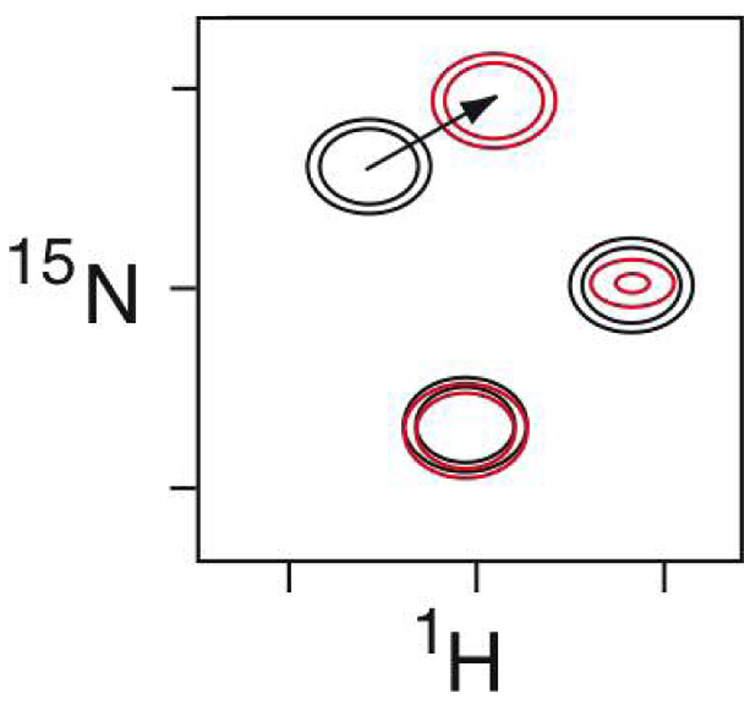
Figure 1.
Schematic of a spectral perturbation mapping experiment. Shown is the overlay of two 2D heteronuclear 1H-15N correlated NMR spectra of an 15N-labeled protein, in absence (black) and presence (red) of its ligand. The signals in these spectra are dominated by the backbone amides of the protein, and thus each peak corresponds to an individual amino acid. Note that one of the signals is unaffected by the presence of the ligand. The other two peaks are implicated as being in the intermolecular interface by the perturbations produced by the ligand: either a shift in the position (chemical shift) of the signal, or broadening and reduced intensity through enhanced relaxation.

