Abstract
A series of nitrofuranylamide and related aromatic compounds displaying potent activity against M. tuberculosis has been investigated utilizing 3-Dimensional Quantitative Structure-Activity Relationship (3D-QSAR) techniques. Comparative Molecular Field Analysis (CoMFA) and Comparative Molecular Similarity Indices Analysis (CoMSIA) methods were used to produce 3D-QSAR models that correlated the Minimum Inhibitory Concentration (MIC) values against M. tuberculosis with the molecular structures of the active compounds. A training set of 95 active compounds was used to develop the models, which were then evaluated by a series of internal and external cross-validation techniques. A test set of 15 compounds was used for the external validation. Different alignment and ionization rules were investigated as well as the effect of global molecular descriptors including lipophilicity (cLogP, LogD), Polar Surface Area (PSA), and steric bulk (CMR), on model predictivity. Models with greater than 70% predictive ability, as determined by external validation, and high internal validity (cross validated r2 > .5) have been developed. Incorporation of lipophilicity descriptors into the models had negligible effects on model predictivity. The models developed will be used to predict the activity of proposed new structures and advance the development of next generation nitrofuranyl and related nitroaromatic anti-tuberculosis agents.
1. Introduction
There is an urgent need today for new anti-tuberculosis agents with novel mechanisms of action. The global incidence of tuberculosis continues to rise, with a third of the world's population currently infected, yet there have been no new classes of antimycobacterial agents approved for use in forty years.1 The efficacy of the currently available agents used in standard Tuberculosis (TB) treatment regimens is severely limited by several factors; including long treatment regimens, multiple drug treatment regimens, drug interactions, and drug resistance. The emergence of resistance, particularly Multi-Drug Resistant Tuberculosis (MDR-TB) and Extensively Drug Resistant Tuberculosis (XDR-TB), is particularly concerning. A recent report released by the World Health Organization estimated that the incidence of TB drug resistance (resistance to one drug in standard TB regimen) was as high as 57% in some countries, while multi-drug resistance was 14%.2 Novel agents are needed that can bypass resistance mechanisms, that can treat the latent phase of infection shortening the duration of tuberculosis treatment, and that are compatible with HIV co-therapy by possessing low drug interaction rates.3, 4
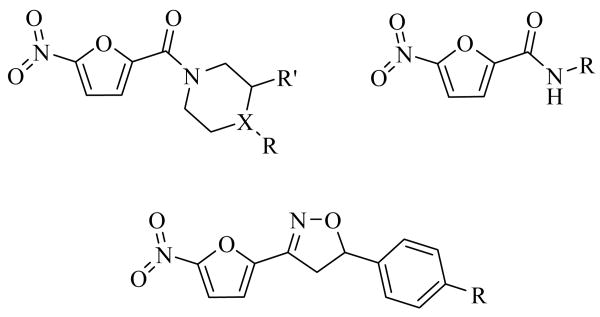
Toward these goals, our laboratory has been developing a series of nitrofuranyl compounds with potent wholecell activity against M. tuberculosis.5-11 Figure 1 shows the three major scaffolds in the nitrofuran series that have been examined so far. The series originated from a screen for TB cell wall inhibitors that produced a nitrofuran hit with a respectable MIC activity and low molecular weight.5 Subsequent lead optimization efforts led to compounds with activity against the tuberculosis bacilli falling into the nanomolar range. Importantly, these compounds exhibit activity against both actively growing and latent bacilli, which is believed to be a beneficial attribute of potential new anti-tuberculosis agents.10 Although the in vitro activity looks very promising for this nitrofuran series, poor solubility and metabolic instability have necessitated the development of further generations of nitrofuran agents that can overcome these issues. Because the exact mechanism of action and cellular target of these compounds remains unclear; ligand-based drug design techniques were employed to guide the synthesis of future generations of nitrofuran compounds, as described herein.
Figure 1.
Major scaffolds of the nitrofuran compounds.
Quantitative Structure-Activity Relationship (QSAR) techniques are methods used to correlate physicochemical descriptors from a set of related compounds to their known molecular activity or molecular property values.12 QSAR models are a useful method of ligand-based drug design when the molecular target for the compounds being investigated is either unknown or has not been structurally resolved. The descriptors used to develop QSAR models can range from molecular descriptors for lipophilicity (cLogP and LogD)13, 14, steric bulk (Molar Refractivity, volume)15, and electrostatics (polar surface area, Coulombic charges, dipole moments)16 to 3-dimensional descriptors that involve alignment of the compounds, and calculating steric and electrostatic values using charged probe atoms at grid lattice points (CoMFA)17 or 3-D similarity indices (CoMSIA).18 Several quantitative structure-activity relationship models were developed in this study. Different molecular alignment rules were investigated in order to obtain models with high predictivity. Compounds with ionizable functional groups were investigated in their charged and uncharged states. Descriptors including cLogP, LogD, molar refractivity (CMR), polar surface area (PSA), and 3D CoMFA and CoMSIA variables were investigated for their ability to predict and correctly rank whole cell MIC activity using the method of Partial Least Squares, PLS.19
Since the activity data utilized in this 3D-QSAR study is whole cell activity expressed as the Minimum Inhibitory Concentration (MIC, see experimental section), it is assumed that the activity reflects several processes in addition to compound binding to the biomolecular target. Compound solubility, mycobacterial cell entry (i.e. passive diffusion or active transport), and stability to TB metabolism may all contribute to the whole cell activity. Additionally, these nitro-aromatic compounds are pro-drugs and must be metabolically activated by TB nitro reductase enzymes as already demonstrated for nitroimidazole agents PA824 and OPC67683 that are currently in clinical development.20-22 The activated form is then believed to interact with its ultimate molecular target. Because of this multistep process, the development of reliable QSAR models using whole cell activity is considered to be a difficult undertaking. However, several groups have reported success in the development of 3D-QSAR models using whole cell antimicrobial and antitubercular activity recently.23-26 We have attempted to account for some of the processes mentioned above by investigating the addition of molecular descriptors that may be important factors for cell entry including lipophilicity and steric bulk to our 3D-QSAR models and testing the effects of ionized versus neutral compounds on the 3D-QSAR model's validity and predictive power.
2. Training and Test Set Preparation
Figure 2 graphically illustrates the general method followed for the development of the QSAR models in this study. We began with an initial set of 110 nitrofuran compounds with activity against M. tuberculosis (as determined by carefully standardized micro broth dilution MIC determination method, see experimental section). A test set of 15 compounds was selected from the remaining compounds for use in external validation. These test set compounds were selected such that their activity and physical properties (MW and cLogP) were broadly reflective of the training set characteristics (see experimental section). Tables 1 and 2 list the training set and test set nitrofuran compounds used in this study, respectively, along with their calculated molecular descriptors and biological activity. MIC activity originally determined in μg/mL were converted to micromolar values (μM/mL) and then converted to a pMIC value by taking Log (1/MIC). The pMIC values were used as the dependent variable in all PLS models subsequently developed. As a general rule, for a reliable 3D-QSAR model the spread of activity should cover at least 3 log units and there ideally should be a minimum of 15 to 20 compounds in the training set.27 The activity range of the nitrofuran compounds ranged from 0.73 to 5.73 pMIC units (see Table 1), a full 5 log activity distribution, and there were 95 compounds in the training set. Figure 3 shows the training set and test set compounds distributed by their lipophilicity (cLogP) and molecular weight. The compounds are colored by activity. Importantly, it should be noted from this preliminary analysis that there is a correlation of increasing activity with molecular weight but no correlation with increasing cLogP, which may be expected for mycobacterial entry. We attribute the correlation with increasing molecular weight to the non-random nature of the data set, as these compounds result from the systematic medicinal chemistry development of the series from a low molecular weight, lower potency screening hit to high potency, higher molecular weight optimized compounds.
Figure 2.
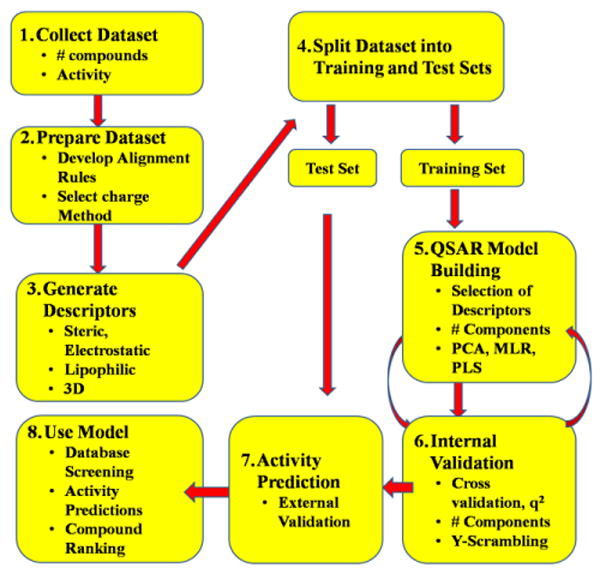
QSAR Project Flowchart
Table 1.
Physicochemical properties and activity of Training Set Compounds.31
| Compound | Molecular Weight | PSAa (A2) | cLogPb | LogD7.4c | CMRb | MIC (μg/mL) | pMICd |
|---|---|---|---|---|---|---|---|
| L1 | 290.314 | 137.057 | 1.84 | 1.50 | 7.488 | 3.1 | 1.9715 |
| L2 | 232.192 | 155.828 | 1.68 | 1.95 | 5.893 | 0.8 | 2.4628 |
| L3 | 276.220 | 145.403 | 2.57 | 2.77 | 6.903 | 0.4 | 2.8392 |
| L4 | 517.454 | 172.693 | 5.84 | 6.19 | 12.725 | 0.025 | 4.3159 |
| L5 | 382.342 | 163.142 | 4.12 | 4.20 | 10.031 | 0.003 | 5.1053 |
| L6 | 400.306 | 130.996 | 3.39 | 3.33 | 8.852 | 0.0008 | 5.6993 |
| L7 | 341.361 | 152.959 | 3.43 | 3.61 | 9.398 | 0.00156 | 5.3401 |
| L8 | 252.266 | 146.082 | 1.89 | 1.70 | 6.451 | 3.1 | 1.9105 |
| L9 | 236.181 | 174.535 | 0.36 | 0.50 | 5.571 | 6.25 | 1.5774 |
| L10 | 257.202 | 218.788 | 1.71 | 1.76 | 6.371 | 0.8 | 2.5072 |
| L11 | 276.245 | 165.292 | 1.62 | 1.31 | 6.974 | 0.1 | 3.4413 |
| L12 | 280.664 | 153.319 | 2.30 | 2.08 | 6.849 | 1.6 | 2.2441 |
| L13 | 306.271 | 173.676 | 1.49 | 1.05 | 7.591 | 0.4 | 2.8840 |
| L14 | 306.271 | 164.455 | 1.49 | 1.05 | 7.591 | 0.2 | 3.1851 |
| L15 | 336.297 | 164.287 | 1.37 | 0.80 | 8.208 | 0.8 | 2.6236 |
| L16 | 286.283 | 142.587 | 2.54 | 2.41 | 7.571 | 3.1 | 1.9654 |
| L17 | 317.297 | 170.828 | 1.56 | 1.87 | 8.093 | 3.13 | 2.0059 |
| L18 | 330.339 | 157.250 | 1.72 | 1.43 | 8.772 | 12.5 | 1.4220 |
| L19 | 406.434 | 155.828 | 3.45 | 3.00 | 11.284 | 0.8 | 2.7059 |
| L20 | 405.446 | 155.828 | 4.63 | 4.88 | 11.379 | 3.13 | 2.1124 |
| L21 | 272.256 | 144.663 | 2.12 | 2.01 | 7.107 | 3.1 | 1.9436 |
| L22 | 330.339 | 157.180 | 1.72 | 1.44 | 8.772 | 12.5 | 1.4220 |
| L23 | 406.434 | 155.828 | 3.45 | 3.01 | 11.284 | 12.5 | 1.5121 |
| L24 | 405.446 | 155.828 | 4.63 | 4.88 | 11.379 | 12.5 | 1.5110 |
| L25 | 393.396 | 164.787 | 3.17 | 3.51 | 10.609 | 6.25 | 1.7989 |
| L26 | 234.168 | 203.256 | -0.28 | 0.02 | 5.471 | 6.25 | 1.5736 |
| L27 | 314.336 | 110.259 | 2.82 | 2.70 | 8.500 | 0.4 | 2.8953 |
| L28 | 276.245 | 165.039 | 1.62 | 1.31 | 6.974 | 1.6 | 2.2372 |
| L29 | 306.271 | 164.057 | 1.84 | 1.02 | 7.590 | 1.2 | 2.4069 |
| L30 | 292.244 | 212.380 | 1.23 | 1.02 | 7.127 | 0.39 | 2.8747 |
| L31 | 288.255 | 171.250 | 1.17 | 0.94 | 7.261 | 9.38 | 1.4876 |
| L32 | 290.228 | 195.200 | 1.53 | 1.24 | 6.950 | 0.15 | 3.2866 |
| L33 | 332.308 | 136.172 | 2.06 | 1.59 | 8.341 | 0.1 | 3.5215 |
| L34 | 324.309 | 221.944 | 0.45 | 0.34 | 7.694 | 0.17 | 3.2805 |
| L35 | 331.323 | 168.233 | 1.63 | 1.48 | 8.557 | 0.4 | 2.9182 |
| L36 | 344.365 | 154.693 | 1.79 | 1.00 | 9.236 | 0.4 | 2.9350 |
| L37 | 420.461 | 153.312 | 3.52 | 2.56 | 11.747 | 0.0125 | 4.5268 |
| L38 | 344.365 | 154.388 | 1.79 | 1.00 | 9.236 | 6.25 | 1.7411 |
| L39 | 419.473 | 153.312 | 4.70 | 4.49 | 11.843 | 1.56 | 2.4296 |
| L40 | 260.245 | 155.967 | 2.03 | 1.81 | 6.821 | 1.6 | 2.2113 |
| L41 | 266.637 | 155.828 | 2.24 | 2.47 | 6.385 | 0.8 | 2.5228 |
| L42 | 419.473 | 153.312 | 4.7 | 4.49 | 11.843 | 0.8 | 2.7196 |
| L43 | 420.461 | 153.310 | 3.52 | 2.56 | 11.747 | 0.05 | 3.9248 |
| L44 | 331.323 | 172.571 | 1.35 | 1.31 | 8.557 | 1.56 | 2.3271 |
| L45 | 260.245 | 146.467 | 2.07 | 1.97 | 6.821 | 3.1 | 1.9240 |
| L46 | 289.287 | 153.314 | 2.03 | 1.83 | 7.654 | 0.4 | 2.8593 |
| L47 | 280.664 | 153.346 | 2.30 | 2.08 | 6.849 | 0.2 | 3.1472 |
| L48 | 320.297 | 166.871 | 1.77 | 1.31 | 8.055 | 0.4 | 2.9035 |
| L49 | 314.217 | 153.346 | 2.67 | 2.45 | 6.868 | 0.05 | 3.7983 |
| L50 | 264.209 | 153.346 | 1.90 | 1.70 | 6.373 | 1.56 | 2.2288 |
| L51 | 264.209 | 153.346 | 1.90 | 1.70 | 6.373 | 0.8 | 2.5189 |
| L52 | 347.389 | 181.002 | 2.35 | 2.06 | 9.210 | 1.56 | 2.3477 |
| L53 | 379.388 | 222.205 | 0.45 | 0.48 | 9.276 | 50 | 0.8801 |
| L54 | 330.339 | 185.480 | 1.41 | -0.23 | 8.772 | 0.8 | 2.6159 |
| L55 | 384.429 | 153.312 | 2.51 | 1.08 | 10.490 | 0.05 | 3.8858 |
| L56 | 438.452 | 153.345 | 3.68 | 3.17 | 11.763 | 0.1 | 3.6419 |
| L57 | 362.356 | 155.962 | 1.95 | 1.55 | 9.252 | 1.56 | 2.3660 |
| L58 | 365.379 | 180.785 | 2.51 | 2.20 | 9.226 | 1.56 | 2.3696 |
| L59 | 319.292 | 117.883 | 2.16 | 2.13 | 7.960 | 0.2 | 3.2032 |
| L60 | 349.314 | 168.194 | 1.79 | 1.62 | 8.572 | 1.56 | 2.3501 |
| L61 | 437.463 | 153.312 | 4.86 | 4.63 | 11.858 | 0.4 | 3.0389 |
| L62 | 359.333 | 158.130 | 1.24 | 0.62 | 9.060 | 1.6 | 2.1907 |
| L63 | 248.192 | 211.631 | 1.29 | 1.64 | 6.047 | 0.2 | 3.2545 |
| L64 | 402.401 | 176.891 | 1.98 | 1.90 | 10.353 | 0.0062 | 4.8123 |
| L65 | 415.443 | 183.540 | 1.79 | 1.71 | 11.032 | 0.2 | 3.3175 |
| L66 | 415.443 | 175.337 | 1.62 | 1.67 | 11.032 | 0.8 | 2.7154 |
| L67 | 293.255 | 239.058 | 2.56 | 1.92 | 6.870 | 50 | 0.7698 |
| L68 | 267.236 | 196.771 | 2.94 | 2.38 | 6.293 | 50 | 0.7296 |
| L69 | 325.382 | 106.482 | 3.62 | 4.25 | 9.216 | 25 | 1.1145 |
| L70 | 446.498 | 119.369 | 3.73 | 2.81 | 12.498 | 0.0125 | 4.5529 |
| L71 | 388.375 | 178.977 | 1.64 | 1.55 | 9.889 | 0.05 | 3.8903 |
| L72 | 430.454 | 176.288 | 2.89 | 2.76 | 11.280 | 0.025 | 4.2360 |
| L73 | 430.454 | 176.353 | 2.87 | 2.77 | 11.280 | 0.025 | 4.2360 |
| L74 | 414.412 | 177.426 | 2.34 | 2.29 | 10.791 | 0.05 | 3.9185 |
| L75 | 444.481 | 160.475 | 2.62 | 2.44 | 11.744 | 0.1 | 3.6479 |
| L76 | 311.088 | 155.835 | 2.51 | 2.74 | 6.670 | 1.6 | 2.2888 |
| L77 | 338.314 | 156.451 | 3.28 | 3.47 | 9.022 | 12.5 | 1.4324 |
| L78 | 389.359 | 156.162 | 0.92 | 0.37 | 9.670 | 6.25 | 1.7945 |
| L79 | 431.442 | 171.924 | 1.90 | 1.75 | 11.069 | 0.0008 | 5.7318 |
| L80 | 357.380 | 141.100 | 2.41 | 2.57 | 9.283 | 6.25 | 1.7573 |
| L81 | 434.488 | 153.312 | 3.63 | 1.66 | 12.211 | 0.8 | 2.7349 |
| L82 | 416.428 | 170.810 | 2.09 | 1.95 | 10.816 | 0.1 | 3.6195 |
| L83 | 429.470 | 171.300 | 1.73 | 1.71 | 11.496 | 0.4 | 3.0309 |
| L84 | 421.449 | 162.679 | 2.90 | 2.23 | 11.536 | 0.0062 | 4.8324 |
| L85 | 403.389 | 183.649 | 1.36 | 1.26 | 10.142 | 0.05 | 3.9068 |
| L86 | 250.183 | 155.747 | 1.84 | 2.09 | 5.909 | 0.8 | 2.4952 |
| L87 | 262.218 | 164.178 | 1.55 | 1.69 | 6.510 | 0.8 | 2.5156 |
| L88 | 262.218 | 168.069 | 1.55 | 1.69 | 6.510 | 0.4 | 2.8166 |
| L89 | 373.426 | 146.915 | 2.57 | 2.30 | 9.960 | 0.4 | 2.9701 |
| L90 | 238.240 | 145.856 | 1.56 | 1.37 | 5.988 | 3.1 | 1.8857 |
| L91 | 246.219 | 114.858 | 1.91 | 1.72 | 6.357 | 3.125 | 1.8965 |
| L92 | 276.245 | 126.760 | 1.79 | 1.46 | 6.974 | 6.25 | 1.6454 |
| L93 | 258.229 | 115.575 | 1.89 | 1.70 | 6.644 | 0.8 | 2.5089 |
| L94 | 233.180 | 179.275 | 0.34 | 0.63 | 5.682 | 6.25 | 1.5718 |
| L95 | 233.180 | 179.120 | 0.34 | 0.63 | 5.682 | 3.125 | 1.8728 |
Table 2.
Physicochemical properties and activity of Test Set Compounds.31
| Test Set | Molecular Weight | PSAa (A2) | cLogPb | LogD7.4c | CMRb | MIC (μg/mL) | pMICd |
|---|---|---|---|---|---|---|---|
| T1 | 334.325 | 153.027 | 4.09 | 4.31 | 9.399 | 0.025 | 4.1262 |
| T2 | 393.396 | 169.032 | 2.50 | 3.51 | 10.610 | 0.4 | 2.9928 |
| T3 | 247.207 | 169.364 | 0.83 | 0.39 | 6.146 | 0.8 | 2.4900 |
| T4 | 319.293 | 218.116 | 2.75 | 2.43 | 7.796 | 1.6 | 2.3001 |
| T5 | 264.194 | 200.702 | 1.05 | 0.96 | 6.088 | 1.6 | 2.2178 |
| T6 | 290.271 | 168.402 | 1.90 | 1.56 | 7.438 | 0.8 | 2.5597 |
| T7 | 260.245 | 140.827 | 2.07 | 1.97 | 6.821 | 1.6 | 2.2113 |
| T8 | 330.339 | 228.151 | 0.98 | -1.41 | 8.772 | 0.8 | 2.6172 |
| T9 | 347.298 | 146.305 | 1.33 | 1.01 | 8.455 | 1.56 | 2.3476 |
| T10 | 279.272 | 208.089 | 1.88 | 1.99 | 6.894 | 50 | 0.7486 |
| T11 | 370.402 | 120.369 | 2.00 | 1.24 | 9.986 | 0.05 | 3.8697 |
| T12 | 341.381 | 122.884 | 2.36 | 2.28 | 9.249 | 6.25 | 1.7374 |
| T13 | 233.180 | 179.557 | 1.06 | 1.33 | 5.682 | 3.125 | 1.8728 |
| T14 | 222.158 | 231.397 | 0.49 | 0.97 | 5.112 | 6.25 | 1.5508 |
| T15 | 214.132 | 204.941 | 0.31 | -0.47 | 4.499 | 0.4 | 2.7286 |
Figure 3.
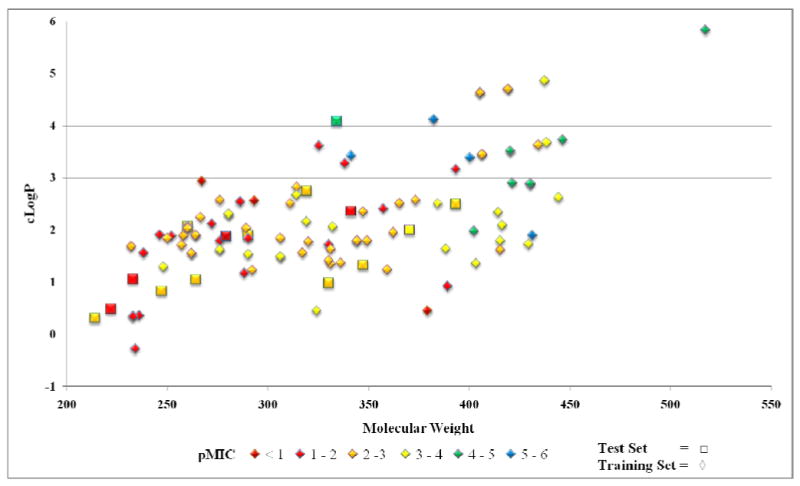
Nitrofuran Training (Diamonds) and Test (Squares) sets distributed by physical properties cLogP and Molecular Weight and colored by activity (pMIC).
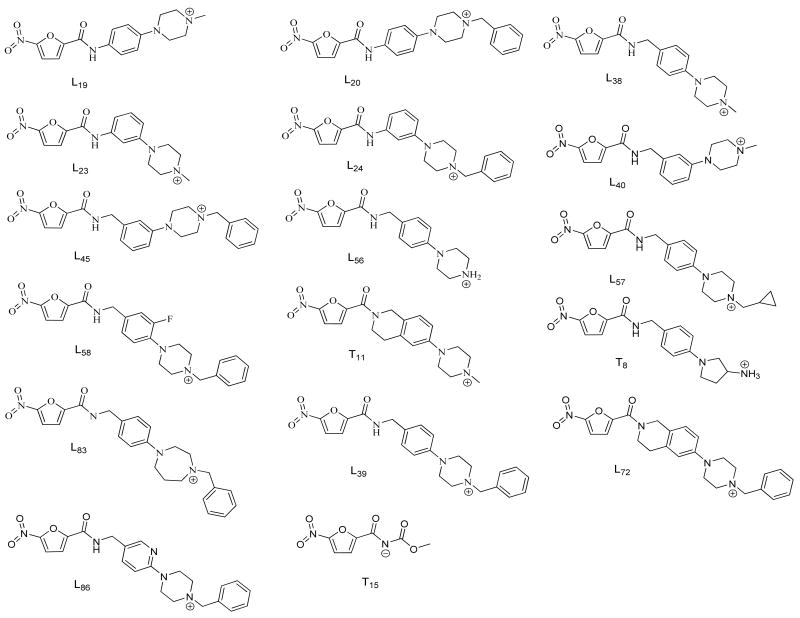
When designing a 3D-QSAR model using Comparative Molecular Field Analysis (CoMFA) or Comparative Molecular Similarity Indices Analysis (CoMSIA) the compounds in the training and test sets must share a common alignment, assumed to be the active conformation, and have the atomic charges loaded by a reliable method.28 The compounds used in this study were built using the Sybyl Molecular Modeling Package of Tripos, Inc.29 The charges were loaded on all compounds in the training and test sets using the PM3 semi-empirical method contained in the MOPAC suite.30 Several of the nitrofuran compounds contained ionizable functional groups that would be expected to carry a charge at physiological pH. In order to account for this and to investigate the effect of protonating or de-protonating these functional groups on model predictivity, two sets of models were built for each alignment rule utilized. The first set of PLS models used all nitrofuran compounds in their neutral state and the cLogP molecular descriptor for lipophilicity (when a lipophilicity descriptor was used), the second set of PLS models used ionized nitrofuran compounds, as determined by a major microspecies calculation (discussed in the experimental section), and LogD as the lipophilic descriptor.
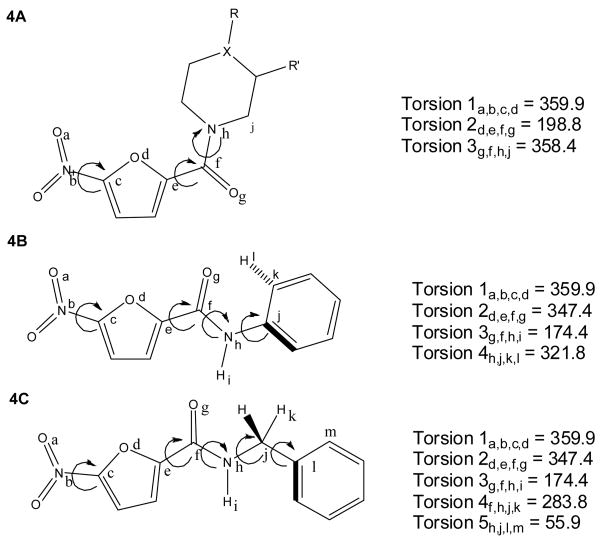
Because the molecular target of the nitrofuran compounds is unknown and the active conformation remains unclear, multiple alignments for these compounds were studied in an attempt to generate the optimal PLS model in terms of activity prediction. The first alignment method specified all nitrofuran compounds be aligned in the same orientation: a sterically unhindered trans-amide conformation shown in figure 4A. The second alignment method specified that the compounds were aligned to the minimum energy conformations of several of the more active nitrofuran compounds. Due to differences in the side chains and steric hindrance factors, the second method actually consisted of separate alignment rules for phenyl substituted, benzyl substituted, and hindered tertiary amide nitrofurans. Figures 4B and 4C show the alignment rules adopted for unhindered phenyl and benzyl substituted nitrofurans. Sterically hindered tertiary amide nitrofurans were aligned using the rules shown in Figure 4A, which conform more closely to the minimum energy conformation seen with these compounds and is the same rule adopted for all compounds in the first alignment method. We note that the selected conformation of our nitrofuran compounds in 4B and 4C very closely aligns with the structure of PA824 determined in a recently solved crystal structure.34
Figure 4.
Nitrofuran alignment rules used for QSAR studies.
Global molecular and 3D physicochemical descriptors were calculated for all compounds in the training and test set and used to develop the QSAR models (see experimental section). Lipophilicity descriptors included cLogP, LogD, and Polar Surface Area (PSA). Molecular volume and steric bulk were also investigated using molar refractivity (CMR) as a molecular descriptor. 3D-QSAR methods utilized were CoMFA and CoMSIA. The performance of the 3D models before and after the addition of various combinations of molecular descriptors was investigated.
3. QSAR Model Building and Validation
The QSAR models investigated in this study were built using the Molecular Spreadsheet tool in the Sybyl 8.0 suite of Tripos, Inc.29 3-dimensional descriptors were generated using both CoMFA and CoMSIA methods as described in the experimental section below. The effect of outlier removal, number of components, and incorporation of molecular descriptors in the 3D models were investigated for the CoMFA and CoMSIA models generated. The program SAMPLS was used to gauge the optimum number of components for each model during model development.35 In order to avoid overfitting the models, a higher component was only accepted and used if it resulted in an increase of greater than 10% to the cross-validated r2 (q2) values. Progressive scrambling was performed to confirm the optimum number of PLS components and dependent variable scrambling was done to check for chance correlation within the models generated.36-38 The best model was obtained using the following methodology: First, models were generated for each alignment and ionization rule using both CoMFA and CoMSIA fields without the addition of molecular descriptors or the removal of any outlier compounds. Next, the molecular descriptors cLogP, LogD, CMR, and PSA were investigated for their ability to improve the best CoMFA and CoMSIA models. Following this, the best performing CoMFA and CoMSIA models at this stage was optimized by the successive removal of outlier compounds (see discussion below) and finally by region focusing.39
The strength of all the models developed was evaluated by a number of validation methods, including internal cross-validation, and external test set predictions. The cross validation methods of Leave-One-Out (LOO) and Leave-Group-Out (10 compound groups) were chosen to generate cross validated r2 (q2) values and Standard Errors of Prediction (SEP). Bootstrapping (10 runs) was utilized to calculate confidence intervals for the r2 and Standard Errors of Estimate (SEE). The equations for q2 and standard errors are given below. Models generated were used to predict activity for the test set compounds and generate activity correlated r2 values. Coefficient of determination, r2, values and standard errors were generated for the final models developed. Models were considered questionable if the difference between cross-validated r2 (q2) and non-validated r2 was > 0.3.40
| [Eq 1] |
where:
Ypred = predicted activity
Yactual = experimental activity
Ymean = the best estimate of the mean
| [Eq 2] |
where:
n = number of compounds
c = number of components
| [Eq 3] |
4. Results and Discussion
Descriptions of the 3D-QSAR models built are given in Table 3; the validation data and predictive ability are shown in Table 4. PLS models which used CoMFA generated 3D descriptors generally outperformed models using CoMSIA 3D descriptors. It should be noted that all 5 CoMSIA fields were used in the PLS (steric, electrostatic, hydrophobic, h-bond donor, and h-bond acceptor) built in this study. The rules of alignment and ionization had a strong influence on the final performance of the models generated. Models using ionized nitrofuran compounds, Figure 5, generally performed worse than the neutral compound models, with the exception of model 2 and 10, both of which had higher test set r2 and non-validated r2 values, but lower internal validation, q2, values. This may be reflective of the need for neutral compounds to passively diffuse into the mycobacterial cell, or possibly the binding of the nitrofuran compounds to their biomolecular target in a neutral state. Models generated using alignment 1, in which all nitrofuran compounds adopted the sterically unhindered trans-amide conformation, also performed significantly worse than those built using alignment 2, in which compounds adopted one of three minimum energy conformations. Test set activity predictions were particularly poor for the alignment 1 QSAR models, and the cross-validation also demonstrated that these were much weaker models compared with alignment 2 models. In light of this data, the decision was made to advance model 3 (CoMFA, alignment 2, neutral compounds) and model 7 (CoMSIA, alignment 2, neutral compounds) into the next stage of model development, which involved the investigation of molecular descriptors ability to improve the model's predictivity.
Table 3.
QSAR Model Descriptions
| Model | Description | Alignment | Ionization | # Components | Outliers |
|---|---|---|---|---|---|
| 1 | CoMFA | 1 | No | 1 | 0 |
| 2 | CoMFA | 1 | Yes | 2 | 0 |
| 3 | CoMFA | 2 | No | 3 | 0 |
| 4 | CoMFA | 2 | Yes | 3 | 0 |
| 5 | CoMSIA | 1 | No | 2 | 0 |
| 6 | CoMSIA | 1 | Yes | 2 | 0 |
| 7 | CoMSIA | 2 | No | 3 | 0 |
| 8 | CoMSIA | 2 | Yes | 2 | 0 |
|
| |||||
| 9 | CoMFA, cLogP | 2 | No | 3 | 0 |
| 10 | CoMFA, LogD | 2 | Yes | 4 | 0 |
| 11 | CoMFA, PSA | 2 | No | 3 | 0 |
| 12 | CoMFA, CMR | 2 | No | 3 | 0 |
| 13 | CoMFA, cLogP, CMR | 2 | No | 3 | 0 |
| 14 | CoMFA, cLogP, PSA | 2 | No | 3 | 0 |
| 15 | CoMFA, PSA, CMR | 2 | No | 4 | 0 |
| 16 | CoMFA, cLogP, PSA, CMR | 2 | No | 4 | 0 |
| 17 | CoMSIA, cLogP | 2 | No | 3 | 0 |
|
| |||||
| 18 | CoMFA | 2 | No | 3 | 3 |
| 19 | CoMFA | 2 | No | 5 | 6 |
| 20 | CoMFA | 2 | No | 5 | 7 |
| 21 | CoMFA | 2 | No | 5 | 8 |
| 22 | CoMSIA | 2 | No | 3 | 6 |
|
| |||||
| 23 | CoMFA (19) Region Focused | 2 | No | 5 | 6 |
Table 4.
QSAR Model Validation and Predictivity
| Model | LOO Cross q2 / SEP | Group Cross q2 / SEP | Bootstrapped r2 | Bootstrapped SEE | Non-Validated r2 / SEE | Test Set r2 / SEE |
|---|---|---|---|---|---|---|
| 1 | .166 / 1.009 | .162 / 1.012 | .414 ± .079 | .886 ± .393 | .294 / .928 | .118 / .831 |
| 2 | .139 / 1.030 | .130 / 1.036 | .471 ± .047 | .799 ± .326 | .355 / .842 | .293 / .750 |
| 3 | .286 / .935 | .279 / .930 | .741 ± .041 | .564 ± .279 | .650 / .655 | .769 / .456 |
| 4 | .235 / .968 | .236 / .974 | .683 ± .050 | .642 ± .340 | .580 / .717 | .648 / .591 |
| 5 | .167 / 1.014 | .187 / 1.001 | .523 ± .044 | .728 ± .298 | .425 / .842 | .567 / .611 |
| 6 | .153 / 1.022 | .127 / 1.038 | .557 ± .044 | .718 ± .301 | .451 / .823 | .417 / .613 |
| 7 | .240 / .964 | .215 / 1.004 | .690 ± .030 | .637 ± .313 | .588 / .710 | .786 / .497 |
| 8 | .205 / .981 | .203 / .982 | .563 ± .071 | .679 ± .285 | .451 / .816 | .441 / .667 |
|
| ||||||
| 9 | .326 / .908 | .320 / .913 | .683 ± .059 | .636 ± .227 | .558 / .735 | .528 / .746 |
| 10 | .264 / .954 | .238 / .971 | .705 ± .065 | .594 ± .293 | .588 / .714 | .697 / .556 |
| 11 | .265 / .949 | .261 / .951 | .645 ± .043 | .640 ± .232 | .559 / .735 | .609 / .601 |
| 12 | .311 / .918 | .314 / .916 | .690 ± .034 | .581 ± .204 | .633 / .670 | .737 / .498 |
| 13 | .304 / .923 | .295 / .929 | .632 ± .030 | .674 ± .202 | .552 / .740 | .514 / .781 |
| 14 | .296 / .928 | .305 / .922 | .594 ± .048 | .705 ± .242 | .486 / .793 | .525 / .757 |
| 15 | .284 / .941 | .288 / .938 | .742 ± .034 | .549 ± .240 | .636 / .671 | .717 / .533 |
| 16 | .308 / .925 | .326 / .913 | .680 ± .045 | .622 ± .242 | .578 / .723 | .419 / .836 |
| 17 | .402 / .855 | .358 / .887 | .627 ± .051 | .674 ± .278 | .601 / .698 | .559 / .618 |
|
| ||||||
| 18 | .448 / .732 | .420 / .750 | .794 ± .023 | .447 ± .175 | .725 / .516 | .756 / .474 |
| 19 | .530 / .664 | .537 / .660 | .923 ± .016 | .251 ± .097 | .856 / .368 | .781 / .561 |
| 20 | .559 / .643 | .588 / .621 | .919 ± .015 | .265 ± .116 | .884 / .330 | .734 / .612 |
| 21 | .581 / .631 | .600 / .616 | .926 ± .020 | .250 ± .116 | .896 / .315 | .754 / .584 |
| 22 | .573 / .668 | .589 / .607 | .768 ± .041 | .465 ± .149 | .708 / .512 | .781 / .493 |
|
| ||||||
| 23 | .585 / .625 | .587 / .623 | .903 ± .024 | .305 ± .127 | .845 / .381 | .769 / .524 |
Figure 5.
Nitrofuran compounds with predicted charge at physiological pH.a,b
a. As determined by major microspecies calculation using MarvinSketch, v. 4.1.13. 33 b. Physiological pH, 7.4
Global molecular descriptors were added to the 3D-QSAR models developed in an attempt to account for factors contributing to the MIC including, solubility and cell entry. The addition of cLogP to Model 3 led to a significant improvement in the cross-validated r2 (internal validation), but a lower non-validated and bootstrapped r2 (model 9). A similar result was seen when cLogP was added to CoMSIA fields in a reflective PLS analysis (model 17); the cross validated r2 values were significantly higher, but the non-validated and test set r2 values were not an improvement over model 7. The addition of LogD values to model 4 (in order to investigate ionization) had negligible effect on the internal validity or test set prediction of that model. Polar Surface Area (PSA) values added to model 3 had a negligible effect on internal validity of the model and worsened the predictivity, as seen by the decreased performance against the test set. The addition of CMR as a measure of steric bulk of the nitrofuran compounds led to slight improvements in the cross-validated r2 values, but again, lower bootstrapped and test set r2 values. Similarly, various combinations of the molecular descriptors, as shown in models 13 through 16, did not improve model 3 to any significant extent Ultimately, the models selected to proceed to step 3 (outlier investigation) were models 3 and 7, which do not incorporate any global molecular descriptors.
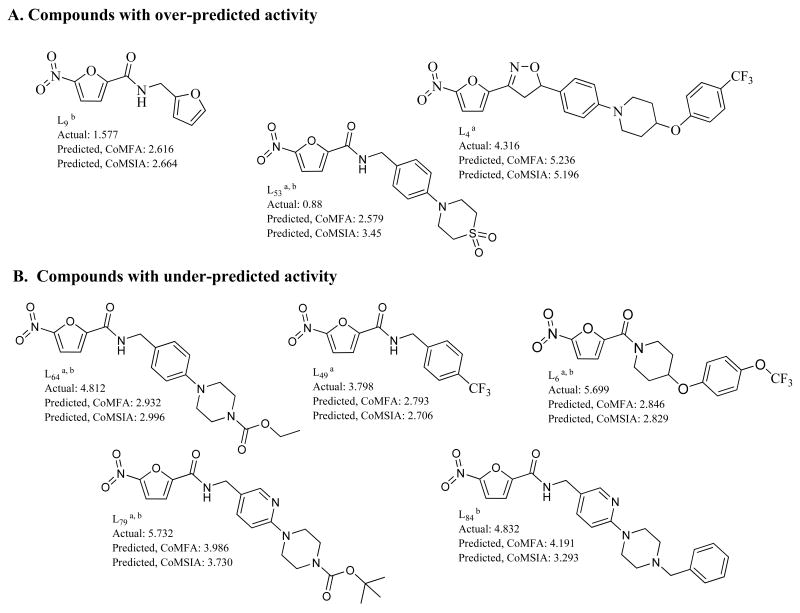
Figure 6 shows outlier nitrofuran compounds, the removal of which improved the CoMFA and CoMSIA models discussed herein. Outlier compounds removed from each model were determined by analysis of a QQ plot generated by the QSAR analysis tool of Tripos, Inc. The QQ plot is essentially a normal probability plot of residuals, which is a validated method specifically developed to detect outliers.40, 41 Compounds with residuals that did not follow normal distribution were removed sequentially from the models developed, starting with the highest deviation from normal distribution. Model 18 was generated by removal of compounds L6, L64, and L79, all with under-predicted activity. Model 19 was generated by removing 3 more compounds; L4, L53, and L49. Subsequent outlier removal (model 20 and model 21) did not result in the improvement of the CoMFA models to a significant extent. It can be seen from the data given in Table 4 that the removal of 6 outliers was optimal in terms of predictive ability of the CoMFA models as demonstrated by the test set r2 values. Although there was modest improvement in the internal validity (seen by cross-validated r2 values for CoMFA) by removal of additional outlier compounds, there was negligible improvement to bootstrapping and non-validated r2 values. CoMSIA model 22 was generated by removal of six compounds from CoMSIA model 7 again based upon the residual distribution. The CoMSIA outlier compounds are shown in Figure 6. Four of the six outlier compounds removed to generate CoMSIA model 22 were also outlier compounds from the CoMFA models (model 18 and model 19). CoMSIA model 22 showed significant improvement to both cross-validated and non-validated r2 values but had little effect on the test set r2 values, indicating an improvement in validity without affecting external predictivity. This model had comparable internal validity and test set predictivity to our best CoMFA model (model 19), but the bootstrapped and non-validated r2 values were significantly lower. For this reason, model 19 (CoMFA, 6 outliers) was chosen to take to the final step in the 3D-QSAR development, region focusing.
Figure 6.
Structures of outlier compounds. a. Outliers from CoMFA Model 19. b. Outliers from CoMSIA Model 22.
The compounds in Figure 6 are sorted by whether their activity was over-predicted or under-predicted. Failure of these compounds to perform well in the QSAR models can be due to several factors, including inability to align correctly with the training set, inaccurate activity values, other processes not accounted for (i.e. active transport, prodrug activation, alternate metabolic routes, increased metabolic stability). Compounds with over-predicted activity may be subject to metabolic inactivation that can't be accounted for in the QSAR models. Further, we have demonstrated that L4 has poor solubility that may account for its over-predicted activity.9 Additionally, as can be seen from Figure 3, compound L4 has extreme values of molecular weight and lipophilicity which may explain the inability of the generated QSAR models predict its activity. The trifluoromethyl groups on compounds L49 and L6, both with under-predicted activity, block metabolism at this site and also increase lipophilicity of these compounds. This leads to enhanced metabolic stability and facilitated passive diffusion across the lipophilic mycobacterial cell wall. These factors may have resulted in an improved MIC for these compounds which the QSAR model was not able to predict. Compounds L64 and L79 (CoMFA and CoMSIA outliers) both contain a metabolically labile carbamic ester functionality, cleavage of which could result in an active metabolite. This process may account for the under-predicted activity of these two compounds. Compound L84 is unique in that it had a high residual when activity predictions were performed using the CoMSIA model (model 7), but residuals that did not result in outlier removal from any CoMFA model. As can be seen from Figure 6, for the most part the CoMFA and CoMSIA activity predictions were reasonably comparable; compounds L84 and L53 were the notable exceptions. The reason for the poor activity prediction of this compound by the CoMSIA model is not readily apparent.
One method of 3D-QSAR optimization is known as region focusing.39 It involves giving additional weight to the lattice points in a given CoMFA region to increase the contribution of those points in a further analysis. Region focusing is used to suppress PLS contributions from minor descriptors. The result is a new model with increased q2 (cross-validated r2), tighter grid spacing, and greater stability at a higher number of components. In this study, discriminant power was used to weight the lattice points by their contribution to the original model's components (see experimental). Figure 7 shows the CoMFA fields for one of the more active nitrofuran compounds before and after region focusing. As can be seen from the data for Model 23 in Table 4, the application of region focusing to Model 19 resulted in a significant improvement to the internal validity of the model, with small to negligible effect to the non-validated r2 and test set activity predictions. Relative steric and electrostatic contributions were calculated from regression coefficients of the PLS models generated. Steric contributions played a larger role than electrostatic in the final model (model 23). The steric and electrostatic field contributions to the final model were 74% and 26%, respectively. Model 23 was selected as the best performing model in this 3D-QSAR study and will be used to predict the activity and guide future synthetic efforts on next generation nitrofuranyl compounds. Figure 8 graphically represents the biological activity predictions of Model 23. Figure 9 shows the CoMFA steric and electrostatic contour fields for the final model with the active compound, L37, overlaid. Figure 10 displays the CoMSIA fields for our best performing CoMSIA model (model 22). The CoMFA fields indicate that the steric effects are mostly limited to the side chain, with clear areas seen where bulk is favored and disfavored.
Figure 7.
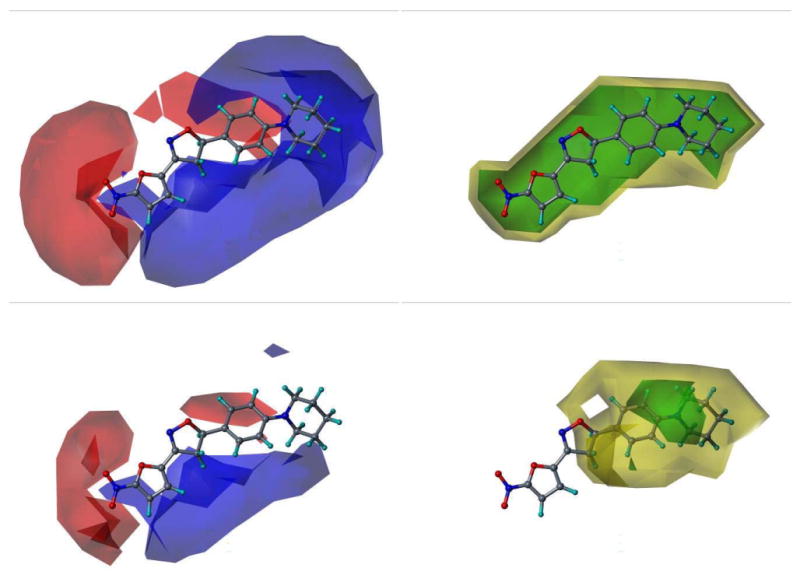
Region Focusing. The CoMFA field calculations are shown for L7 before (upper) and after (lower) region focusing. Electrostatic fields (Left): Blue fields indicate electropositive groups favored, red fields indicate electronegative groups favored. Steric fields (Right): Green fields indicate steric bulk favored, yellow fields indicate steric bulk disfavored.
Figure 8.
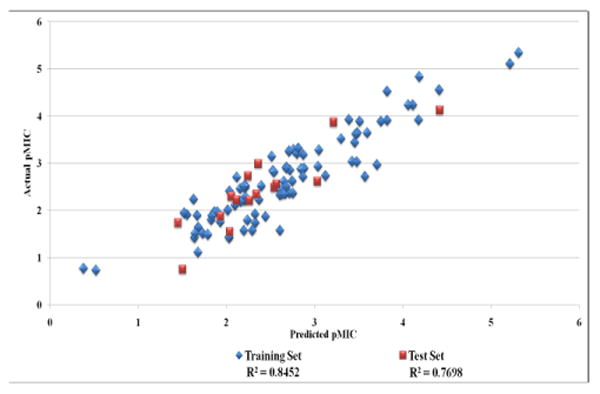
Model 23 results: Actual vs. Predicted Activity
Figure 9.
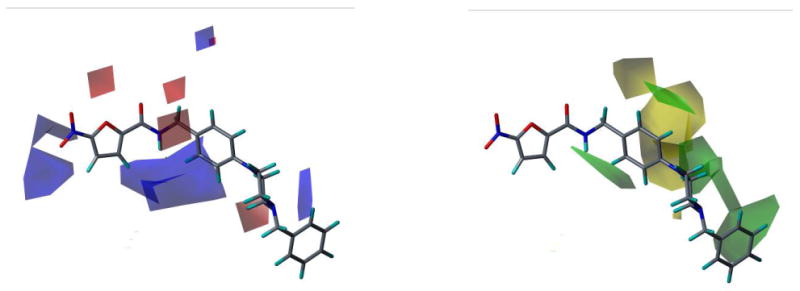
CoMFA field contour maps for Model 23 and active compound, L37. Electrostatic fields (Left): Blue fields indicate electropositive groups favored, red fields indicate electronegative groups favored. Steric fields (Right): Green fields indicate steric bulk favored, yellow fields indicate steric bulk disfavored.
Figure 10.
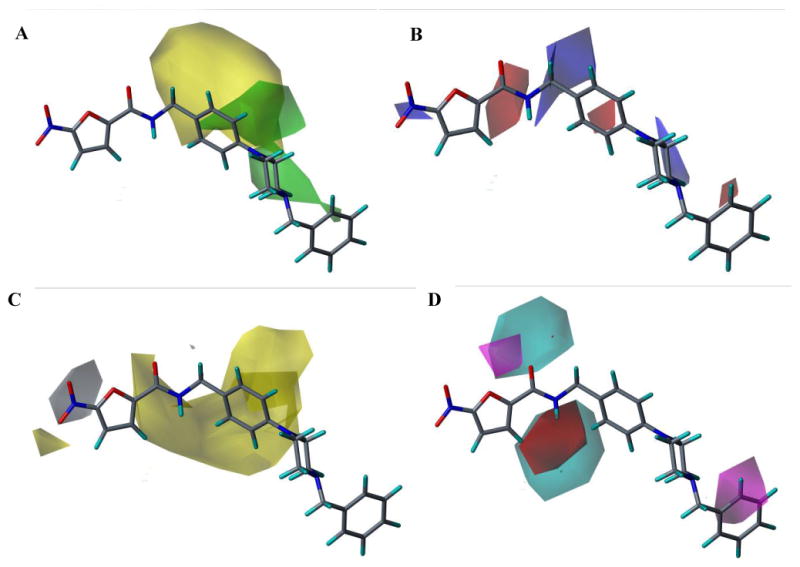
CoMSIA Fields. The CoMSIA Fields from Model 22 are shown below with active compound L37. A. Steric Fields, Green indicates steric bulk favored, Yellow indicates bulk disfavored. B. Electrostatic fields, blue indicates positive charge favored, red indicates disfavored. C. Hydrophobic fields, Yellow indicates favored, gray indicates disfavored. D. H-bond donor and acceptor fields, Cyan indicates donor favored, Magenta indicates acceptor favored, and red indicates disfavored.a
a. H-bond donor disfavored fields were negligible at default energy values used for field generation and are not shown here.
The CoMFA electrostatic fields show regions where positive and negative charge are favored on both the nitrofuran scaffold as well as the side chain. The blue field near the nitro group seems to indicate that compounds with less negative charge near the one of the nitro oxygens are favored; this is most likely due to the contribution of the aryl sulfone and aryl sulfoxide substitutions at this position in our training set. There is also a clear preference for a positively charged group at the terminal end of the side chain, which appears to correspond to basic amine groups at this position in several of the more active compounds in the training set. The CoMSIA fields (Fig. 10) show steric regions and electrostatic fields that correlate well with what is seen in the CoMFA fields. Additional fields for hydrophobicity and H-bond donors and acceptors are shown; this information will be used for optimization of further generations of nitrofuran compounds.
Cross-validation values must be interpreted with caution when building 3D-QSAR models with large training sets. This is because redundancy in the data sets can confuse the Leave-One-Out and Leave-Group-Out validation techniques.37 The Progressive Scrambling method was developed to overcome this problem.36-38 This method checks the sensitivity of the PLS model developed to small changes in the dependent variable. The values of Q2, cSDEP, and dq2/dr2yy′ are returned and can aid in interpreting the predictivity of the model without the potentially confusing redundancy.
The Q2 statistic returned is an estimate of the predictivity of the model after removing the effects of redundancy. It is calculated by fitting the correlation of scrambled to unscrambled data (r2yy′) to the cross-validated correlation coefficient (q2) (calculated after each scrambling performed) using a 3rd order polynomial equation. The cSDEP statistic is an estimated crossvalidated standard error at a specific critical point (0.85 default used in this study) for r2yy′, and is calculated from a 3rd order polynomial equation which fits the scrambled results. The slope of q2 with respect to r2yy′ is reported as dq2/dr2yy′, and is considered the critical statistic. It indicates to what extent the model changes with small changes to the dependent variable. In a stable model, dq2/dr2yy′ should not exceed 1.2 (ideally 1). This method was employed against the final model to verify the number of components used to build the model and to check the cross-validation against the possibility of such a redundancy in our training set. Table 5 lists the results of the progressive scrambling of Model 23. For a valid model, as additional components are added, values of Q2 should be increasing while cSDEP is decreasing, the slope should fall near unity. While the value of the Q2 statistic may seem low in comparison to the crossvalidated r2 (q2) value, it must be noted that the introduced noise from scrambling renders this statistic very conservative. Q2 values above 0.35 are reported to indicate that the original, unperturbed model is robust.36
Table 5.
Progressive Scrambling Results, Model 23
| Components | Q2 | cSDEP | dq2′/dr2yy′ |
|---|---|---|---|
| 2 | 0.337 | 0.776 | 0.13 |
| 3 | 0.387 | 0.750 | 0.52 |
| 4 | 0.430 | 0.726 | 0.78 |
|
| |||
| 5 | 0.432 | 0.728 | 1.15 |
|
| |||
| 6 | 0.381 | 0.763 | 1.47 |
| 7 | 0.424 | 0.741 | 1.48 |
| 8 | 0.393 | 0.766 | 1.55 |
Another validation method that was employed in this study was Dependent Variable Scrambling (Y-scrambling). This method involves scrambling the dependent data in the training set and then building a PLS model using this scrambled data. The method is used to verify that the correlation in the original, unscrambled model is accurate and not a chance correlation. Ideally, the cross-validated r2 (q2) values returned from the scrambled PLS will be very low, even negatively correlated. Table 6 shows the results of the Y-scrambling test run against model 19. This model was chosen because model 23 was built by region focusing model 19, which was been built using unscrambled data. Therefore, Y-scrambling results against model 23 would not have been easily interpreted.
Table 6.
Dependent Variable Scrambling Results, Model 19
| Components | LOO q2 | SEP |
|---|---|---|
| 1 | -0.260 | 1.210 |
| 2 | -0.546 | 1.349 |
| 3 | -0.498 | 1.335 |
| 4 | -0.833 | 1.486 |
| 5 | -0.863 | 1.507 |
| 6 | -0.827 | 1.501 |
| 7 | -0.765 | 1.485 |
| 8 | -0.791 | 1.505 |
5. Experimental
Training and Test Set Preparation
All nitrofuranyl compounds investigated in this QSAR study were originally synthesized and tested for activity in our lab.5-7 Compounds were built using the Sybyl 8.0 molecular modeling package and charges were loaded using the PM3 semi-empirical method available in the MOPAC suite. The compounds were minimized using the Powell method with an initial Simplex optimization and gradient termination of 0.01 kcal/mol (500 maximum iterations). The global molecular descriptors cLogP and CMR were calculated using ChemBioOffice 2008.32 Polar surface area was calculated using the molecular spreadsheet application in Sybyl 8.0.29 LogD was calculated for compounds at pH 7.4 using the calculator plugin tool in Marvin 4.1.13.33 Ionized compounds were identified by performing a major microspecies calculation on all compounds in the training and test set at pH 7.4 using the calculator plugin tool of Marvin 4.1.13.33 All compounds were aligned manually as discussed above. The 15 test set compounds were chosen from the 110 nitrofuran compounds by selecting for diversity using the program, Selector.42 Selector is an application available in the Sybyl 8.0 molecular modeling suite.29 Atom pairs and 2D fingerprints were used to form 15 diversity clusters by hierarchical clustering. 1 compound was selected from each cluster, chosen to maximize the spread of activity data.
QSAR Model Validation
SAMPLS was used to initially select the optimum number of components used in the PLS models generated35; with the exception noted above that a higher component was selected only if it resulted in an increase in q2 values of at least 10%. Group cross-validation used 10 groups in all cases. Bootstrapped results were obtained using 10 bootstrapping runs. The progressive scrambling stability test was performed up to 10 components using 50 scramblings, 10 maximum bins, and 2 minimum bins. The critical point was 0.85 and the seed was 12080.
QSAR Model Development
3-D CoMFA descriptors were generated using c.3 probe atom with a +1 charge and a grid spaced at 2 Å and extending 4 Å beyond the compounds in all directions. Tripos Standard CoMFA steric and electrostatic fields were generated using a distance dependent dielectric, no smoothing, and cutoffs of 30 kcal/mol for each. CoMSIA similarity fields were calculated for steric, electrostatic, hydrophobic, h-bond donor, and h-bond acceptor using the default attenuation factor of 0.3. Partial Least Squares analysis was used to build models correlating descriptors to the dependent variable, pMIC. Optimum number of components was determined by SAMPLS, cross validation methods, and progressive scrambling. A column filtering value of 0.5 and CoMFA standard scaling was used in all PLS analyses. Region focusing was performed by applying a discriminant power weighting factor of 0.3 and new grid spacing equal to the original.
Antituberculosis Activity Testing
MIC values were determined using the microbroth dilution method and were read by visual inspection. Two-fold serial dilutions of test compound were prepared in 96-well round bottom microtiter plates (Nunc, USA) in 100 μL of the 7H9 broth media (Difco Laboratories, MI, USA) supplemented with 10% Albumin-Dextrose Complex and 0.05% (v/v) Tween80. An equivalent volume (100 μL) of broth inocula containing approximately 105 CFU/mL of M. tuberculosis H37Rv was added to each well to give final concentrations of test compound starting at 200 μg/mL. The plates were incubated aerobically at 37°C for 7 days and the MIC was recorded as the lowest concentration of drug which inhibited 90% of growth with respect to the no-drug control.
6. Conclusions
Using a series of nitrofuranyl compounds with known anti-tuberculosis activity, a predictive 3D-QSAR model has been developed. The effects of compound ionization, multiple alignments, and the incorporation of global molecular descriptors for lipophilicity, polar surface area, and steric bulk were investigated for their ability to improve QSAR model predictivity. Our expectation was that the addition of a lipophilicity descriptor (cLogP or LogD) and steric bulk descriptor could improve the model's predictivity by accounting for the cell entry contribution to the MIC of a given compound. We also theorized that polar surface area and ionization could model the effects of solubility. Interestingly, the addition of molecular descriptors for lipophilicity, polar surface area, and steric bulk did little to improve the predictive ability of the model. While in most cases, the addition of the global molecular descriptors didn't weaken the models significantly, they did little to benefit them either. This may be due to the fact that most of the compounds in the training set had suitable physicochemical properties (cLogP 1-5) to penetrate the TB cell wall. As can be seen from Figure 3, although there is a clear trend of increasing activity with increased molecular weight, there is little correlation with cLogP in the range that our active compounds fall into. This is reflected in the QSAR models built in this study.
We noted above that the CoMFA steric field contribution of the final model (74%) greatly outweighed the electrostatic field contribution. As can be seen from the CoMFA fields shown in Figure 9 as well as the CoMSIA fields shown in Figure 10, the steric effects were isolated to the side chain while electrostatic effects were contributed from both the side chain and the nitrofuran scaffold. We believe this can be explained by the two processes discussed above, activation of the compounds by a nitro reducing enzyme (electrostatic effects, low steric contribution) and binding of the compound to its ultimate biological target (electrostatic and steric contribution). The CoMFA and CoMSIA fields clearly indicate regions of interest (both to avoid and to target) that will be used when performing CoMFA and/or CoMSIA guided activity predictions of nitrofurans for proposed synthesis and testing.
Another interesting result that we note is the improved performance of the QSAR models both in terms of internal validity and external (test set) predictivity when using alignment 2 versus alignment 1. In alignment 2, the side chains of the tertiary amide nitrofuran compounds adopted a conformation that was significantly different when compared to the unhindered nitrofurans and fell into a region not occupied by the unhindered compounds (see Fig. 4A). It is possible that this is reflecting the dual processes of compound activation and binding to the ultimate biomolecular target. While it may seem from initial inspection of the CoMFA and CoMSIA fields in Figures 9 and 10 that these tertiary amide compounds contributed little to the final model, we point out that the test set included two such compounds whose activity was predicted with a fair degree of accuracy (within .5 pMIC units).
Further experiments are ongoing to investigate if our best performing models can be expanded to examine the nitroimidazole class of anti-tuberculosis agents. Preliminary evidence indicates that CoMFA model 23, discussed here, is suitable to predict MIC activity of these compounds as demonstrated by the reasonably accurate predictions of MIC's for PA824 (predicted 1.2 μg/mL, actual 0.5 μg/mL) and OPC67638 (predicted 0.0075 μg/mL, actual 0.006 μg/mL). This suggests that steric and electronic requirements for entry and nitroactivation are shared by the nitrofuran and nitroimidazole anti-tuberculosis agents and are major contributors to this QSAR model.
The final model was optimized by outlier removal and region focusing and validated by a variety of methods; including cross-validation, progressive scrambling, and test set predictions. The model developed has high internal validity (cross-validated r2 {q2} above 0.5) and high predictive ability (test set r2 above 0.7). It is being used to predict the anti-tuberculosis activity of proposed new compounds and to prioritize their synthesis by activity ranking. We believe this is an new important tool for the development of next generation nitrofuranyl and related nitroaromatic anti-tuberculosis agents.9
Acknowledgments
The authors would like to thank National Institutes of Health grant R01AI02415 for financial support. KH was funded in part by the American Foundation for Pharmaceutical Education fellowship that is gratefully acknowledged. We also acknowledge the work of Robin Lee in anti-tuberculosis activity testing of the nitrofuran compounds.
Footnotes
Publisher's Disclaimer: This is a PDF file of an unedited manuscript that has been accepted for publication. As a service to our customers we are providing this early version of the manuscript. The manuscript will undergo copyediting, typesetting, and review of the resulting proof before it is published in its final citable form. Please note that during the production process errors may be discovered which could affect the content, and all legal disclaimers that apply to the journal pertain.
References and notes
- 1.Frothingham R, Stout JE, Hamilton CD. Int J Infect Dis. 2005;9:297. doi: 10.1016/j.ijid.2005.04.001. [DOI] [PubMed] [Google Scholar]
- 2.WHO. World Health Organization: Geneva, 2007.
- 3.Ginsberg AM, Spigelman M. Nature Medicine. 2007;13:290. doi: 10.1038/nm0307-290. [DOI] [PubMed] [Google Scholar]
- 4.Sacchettini JC, Rubin EJ, Freundlich JS. Nature reviews. 2008;6:41. doi: 10.1038/nrmicro1816. [DOI] [PubMed] [Google Scholar]
- 5.Tangallapally RP, Yendapally R, Lee RE, Hevener K, Jones VC, Lenaerts AJ, McNeil MR, Wang Y, Franzblau S, Lee RE. J Med Chem. 2004;47:5276. doi: 10.1021/jm049972y. [DOI] [PubMed] [Google Scholar]
- 6.Tangallapally RP, Yendapally R, Lee RE, Lenaerts AJ. J Med Chem. 2005;48:8261. doi: 10.1021/jm050765n. [DOI] [PMC free article] [PubMed] [Google Scholar]
- 7.Tangallapally RP, Lee RE, Lenaerts AJ, Lee RE. Bioorg Med Chem Lett. 2006;16:2584. doi: 10.1016/j.bmcl.2006.02.048. [DOI] [PubMed] [Google Scholar]
- 8.Tangallapally RP, Yendapally R, Daniels AJ, Lee RE, Lee RE. Curr Top Med Chem. 2007;7:509. doi: 10.2174/156802607780059772. [DOI] [PubMed] [Google Scholar]
- 9.Budha NR, Mehrotra N, Tangallapally R, Rakesh, Daniels A, Lee RE, Meibohm B. The AAPS Journal. 2008 doi: 10.1208/s12248-008-9017-8. in Press. [DOI] [PMC free article] [PubMed] [Google Scholar]
- 10.Hurdle JG, Lee RB, Budha NR, Carson EI, Qi J, McNeil MR, Lenaerts AJ, Franzblau SG, Meibohm B, Lee RE. Antimicrob Agents Chemother. 2008 doi: 10.1093/jac/dkn307. In Press. [DOI] [PMC free article] [PubMed] [Google Scholar]
- 11.Budha NR, L RE, Meibohm B. Current Medicinal Chemistry. 2008 doi: 10.2174/092986708783955509. in press. [DOI] [PubMed] [Google Scholar]
- 12.Hansch C. Accounts of Chemical Research. 1969;2:232. [Google Scholar]
- 13.Smith RN, Hansch C, Ames MM. J Pharm Sci. 1975;64:599. doi: 10.1002/jps.2600640405. [DOI] [PubMed] [Google Scholar]
- 14.Scherrer RA, Howard SM. J Med Chem. 1977;20:53. doi: 10.1021/jm00211a010. [DOI] [PubMed] [Google Scholar]
- 15.Hansch C, Leo A, Unger SH, Kim KH, Nikaitani D, Lien EJ. J Med Chem. 1973;16:1207. doi: 10.1021/jm00269a003. [DOI] [PubMed] [Google Scholar]
- 16.Stanton DT, Dimitrov S, Grancharov V, Mekenyan OG. SAR QSAR Environ Res. 2002;13:341. doi: 10.1080/10629360290002811. [DOI] [PubMed] [Google Scholar]
- 17.Cramer R, III, Patterson DE, Bunce JD. J Am Chem Soc. 1988;110:5959. doi: 10.1021/ja00226a005. [DOI] [PubMed] [Google Scholar]
- 18.Klebe G, Abraham U, Mietzner T. J Med Chem. 1994;37:4130. doi: 10.1021/jm00050a010. [DOI] [PubMed] [Google Scholar]
- 19.Wold S, Albano C, Dunn WJ, III, Edlund U, Esbensen K, Geladi P, Hellberg S, Johansson E, Lindberg W, Sjostrom M. In: CHEMOMETRICS: Mathematics and Statistics in Chemistry. Kowalski B, editor. Reidel; Dordrecht, Netherlands: 1984. [Google Scholar]
- 20.Manjunatha UH, Boshoff H, Dowd CS, Zhang L, Albert TJ, Norton JE, Daniels L, Dick T, Pang SS, Barry CE., 3rd Proc Natl Acad Sci U S A. 2006;103:431. doi: 10.1073/pnas.0508392103. [DOI] [PMC free article] [PubMed] [Google Scholar]
- 21.Matsumoto M, Hashizume H, Tomishige T, Kawasaki M, Tsubouchi H, Sasaki H, Shimokawa Y, Komatsu M. PLoS medicine. 2006;3:e466. doi: 10.1371/journal.pmed.0030466. [DOI] [PMC free article] [PubMed] [Google Scholar]
- 22.Barry CE, 3rd, Boshoff HI, Dowd CS. Curr Pharm Des. 2004;10:3239. doi: 10.2174/1381612043383214. [DOI] [PubMed] [Google Scholar]
- 23.Ventura C, Martins F. J Med Chem. 2008;51:612. doi: 10.1021/jm701048s. [DOI] [PubMed] [Google Scholar]
- 24.Gupta RA, Gupta AK, Soni LK, Kaskhedikar SG. Eur J Med Chem. 2007;42:1109. doi: 10.1016/j.ejmech.2007.01.018. [DOI] [PubMed] [Google Scholar]
- 25.Saquib M, Gupta MK, Sagar R, Prabhakar YS, Shaw AK, Kumar R, Maulik PR, Gaikwad AN, Sinha S, Srivastava AK, Chaturvedi V, Srivastava R, Srivastava BS. J Med Chem. 2007;50:2942. doi: 10.1021/jm070110h. [DOI] [PubMed] [Google Scholar]
- 26.Nayyar A, Monga V, Malde A, Coutinho E, Jain R. Bioorg Med Chem. 2007;15:626. doi: 10.1016/j.bmc.2006.10.064. [DOI] [PubMed] [Google Scholar]
- 27.Cramer RD, 3rd, Patterson DE, Bunce JD. Prog Clin Biol Res. 1989;291:161. [PubMed] [Google Scholar]
- 28.Thibaut U, Folkers G, Klebe G, Kubinyi H, Merz A, Rognan D. Quant Struct-Act Relat. 1994;13:1. [Google Scholar]
- 29.Sybyl. Tripos, Inc. A Complete Computational Chemistry and Molecular Modeling Environment. St. Louis, MO: 2007. [Google Scholar]
- 30.Stewart JJP. J Comp Chem. 1989;10 [Google Scholar]
- 31.3D structural structure-data files for training and test set compounds submitted as supplemental material.
- 32.ChemBioOffice. CambridgeSoft, 2008.
- 33.Marvin. ChemAxon, 2007.
- 34.Li X, Manjunatha UH, Goodwin MB, Knox JE, Lipinski CA, Keller TH, Barry CE, 3rd, Dowd CS. Bioorg Med Chem Lett. 2008;18:2256. doi: 10.1016/j.bmcl.2008.03.011. [DOI] [PMC free article] [PubMed] [Google Scholar]
- 35.Bush BL, Nachbar RB., Jr J Comput Aided Mol Des. 1993;7:587. doi: 10.1007/BF00124364. [DOI] [PubMed] [Google Scholar]
- 36.Clark RD, Fox PC. J Comput Aided Mol Des. 2004;18:563. doi: 10.1007/s10822-004-4077-z. [DOI] [PubMed] [Google Scholar]
- 37.Clark RD, Sprous DG, Leonard JM. In: Rational Approaches to Drug Design. Holtje HD, Sippl W, editors. Prous Science SA; 2001. p. 475. [Google Scholar]
- 38.Luco JM, Ferretti FH. J Chem Inf Comput Sci. 1997;37:392. doi: 10.1021/ci960487o. [DOI] [PubMed] [Google Scholar]
- 39.Datar P, Desai P, Coutinho E, Iyer K. J Mol Model. 2002;10:290. doi: 10.1007/s00894-002-0097-6. [DOI] [PubMed] [Google Scholar]
- 40.Eriksson L, Jaworska J, Worth AP, Cronin MT, McDowell RM, Gramatica P. Environ Health Perspect. 2003;111:1361. doi: 10.1289/ehp.5758. [DOI] [PMC free article] [PubMed] [Google Scholar]
- 41.Box GEP, Hunter WG, Hunter JS. Statistics for Experimenter. New York: Wiley; 1978. [Google Scholar]
- 42.Holliday JD, Ranade SS, WIllett P. Quant Struct Act Relat. 1996;14:501. [Google Scholar]


