

Abstract
People are especially efficient in processing certain visual stimuli such as human faces or good configurations. It has been suggested that topology and geometry play important roles in configural perception. Visual search is one area in which configurality seems to matter. When either of 2 target features leads to a correct response and the sequence includes trials in which either or both targets are present, the result is a redundant-target paradigm. It is common for such experiments to find faster performance with the double target than with either alone, something that is difficult to explain with ordinary serial models. This redundant-targets study uses figures that can be dissimilar in their topology and geometry and manipulates the stimulus set and the stimulus–response assignments. The authors found that the combination of higher order similarity (e.g., topological) among the features in the stimulus set and response assignment can effectively overpower or facilitate the redundant-target effect, depending on the exact nature of the former characteristics. Several reasonable models of redundant-targets performance are falsified. Parallel models with the potential for channel interactions are supported by the data.
Keywords: redundant-target effect, similarity, systems factorial technology, configural, topology
People detect more quickly, and more accurately, a left parenthesis, when presented within a certain context, “( ),” than when presented alone, “(” (Pomerantz, Sager, & Stoever, 1977; Pomerantz et al., 2003). Similarly, people seem to better identify a nose, within the context of a face, than when the nose is presented alone (Tanaka & Farah, 1993, 2003; Tanaka & Sengco, 1997).1 This kind of result is counterintuitive from certain basic perspectives, given that context adds more details to the display and therefore distracts attention and/or increases processing load as well as possibly masking the target.
Also, in many such studies context is controlled such that by itself it provides no information with respect to the required response. Nonetheless, people exhibit better performance in the presence of certain contexts than with other contexts or with less context. What is so special about these facilitating contexts? What is special about faces and good figures that aids in their processing? According to one view, highly symmetrical (i.e., good) or highly learned (faces) figures are processed as gestalts, that is, as unified wholes (Garner, 1974; Palmer, 1999). Another related view suggests that combining features in a felicitous way may create emergent features, such as symmetry or closure.
On another front, it has been found in scores of experiments that increasing redundancy of features, each of which carries sufficient information for a correct response, can dramatically increase speed or accuracy in responses (e.g., Garner, 1974; Raab, 1962), sometimes beyond what is expected on the basis of ordinary parallel processing (Miller, 1982; Townsend & Nozawa, 1995). The traditional statistic for testing superiority of the redundant stimuli relative to a single stimulus is called the redundant-target effect (RTE). The critical contrast for the RTE compares mean response time (RT) on the faster of the two single-target conditions versus mean RT on the redundant-target condition. We should note initially that in some studies, such as the present one, feature search could actually be carried out, for instance, by identifying the entire figure of which it is a part. Nonetheless, given that much of the redundant-target literature is couched in terms of search constructs, we continue with that terminology except in cases in which an alternative perspective is needed.
Some clarification may be needed when adopting visual-search terminology—specifically, the term feature—to this article. Throughout its history, the term feature has been clouded by its many scattered meanings and by the many near synonyms to which it is linked, including property, attribute, dimension, aspect, level or value, part, component, and element. All refer to a subset of a whole stimulus; they are building blocks that can be reassembled in the proper configuration into that whole. Whole stimuli can be described in any number of ways: For example, a triangle can be described as three suitably arranged line segments, as three vertices, as one vertex plus one line, as an infinite number of points, and so on. Accordingly, these could all be candidates for the basic parts from which a triangle emerges. Additionally, a triangle has global features, such as size, closure, and symmetry, that cannot be localized to any subset or region of the stimulus but must be determined from its entirety.
For complex stimuli such as faces, one can think of more features, perhaps an infinite number. One might claim, for example, that the product of eye width times nose length divided by the mouth-to-ear size ratio is a feature. Given an infinity of such features, it is helpful to distinguish between physical features of the stimulus (those that can be measured explicitly) and those features that happen to be encoded in human perception and so have psychological reality. It would be useful if the literature used different terms to distinguish these two, but for now that is rare. It would likewise be helpful if the literature more accurately distinguished between physical similarity (objective feature overlap, etc.) and perceived similarity, but that too is a task for the future.
In this article, we use the word feature to refer mainly to physical properties. It is in this sense that we characterize as features the diagonal lines and └ shapes from which we construct our triangles and arrows. In doing so, we do not intend to imply or presume that these are necessarily the features used in human vision. Instead, we engage in a “what if” game whereby if these were the operative features, then certain predictions follow. In many of our experiments, those predictions are violated, implying that the diagonals and └s are clearly not the features attended to, which in turn supports the notion that other features, such as topological ones, are used in some conditions. In fact, more generally, we suspect that the actual features used by people are likely adaptive in nature, depending on many aspects of the stimulus set and environment.
In this work, we hoped to learn more about configural perception and feature redundancy as well as their interplay by using the tools from systems factorial technology, a synthesis of RT methodologies from factorial approaches (e.g., Schweickert, 1978; Sternberg, 1969; Townsend & Ashby, 1982); redundant-targets designs (e.g., Egeth, 1966; Miller, 1982; Townsend & Nozawa, 1995), which are especially good with capacity assessment; and decisional stopping rules (e.g., Townsend & Colonius, 1997; Van Zandt & Townsend, 1993). Also, feature dependencies play an important theoretical role but are less directly addressed with our RT measures than with accuracy measures (see, e.g., Ashby & Townsend, 1986). Finally, Wenger and Townsend (2001) and Townsend and Wenger (2004) have proposed axioms concerning processing of configural objects that are expressed in terms of concepts and hypotheses from systems factorial technology and hence are testable using the latter's methodologies.
One of the major axioms, and the one emphasized here, concerns capacity interpreted in terms of speed of processing. The benchmark we use is based on measures of single features (dimensions, etc.) and how they should act when placed together to form a composite stimulus, if capacity is at the level we should expect if standard parallel processing is in operation (e.g., Townsend & Nozawa, 1995; Wenger & Townsend, 2000). A brief exposition of capacity and how we apply it here will be offered below. First, we need a bit more motivation from the relevant literature.
Pomerantz et al. (1977) provided a demonstration of a salutary effect of context that provides configural information. They showed that participants were faster in judging the direction of curvature of the left-hand member of a pair of parentheses such as “( ),” than they were in judging the curvature of the same member presented alone, “(.” This facilitation, referred to as the configural superiority effect, was even more apparent when they used a localization-of-oddity task (indicating the location of an odd target surrounded by distractors took 1,450 vs. 2,400 ms for the context and no-context conditions, respectively). Similar results were obtained with the same task and a different set of stimuli: Discriminating between orientations of diagonal lines with no context added took 1,884 ms. The addition of a context that provided no task relevant information (but contributed to closure or symmetry) reduced RTs to as little as 749 ms. Figure 1 illustrates the original, context, and composite (target plus context) displays of these experiments.
Figure 1.

An example of the stimuli used by Pomerantz et al. (1977) to produce a configural superiority effect. When participants had to localize the odd item in the original display (A), it took them 1,884 ms. When an informationless context (B) was superimposed on the original display, thus creating a new set (C), response times were reduced to as little as 749 ms.
In the aforementioned works of Pomerantz et al. (1977) and Tanaka and Farah (1993), the term context referred to the set of visual features (lines, face contours) that were presented on the display but were not the target features. The lexical definition of context, however, is broader: “the interrelated conditions in which something exists or occurs” (see http://www.merriam-webster.com/dictionary/context). Note that these conditions should not necessarily be salient to the participant and may include other components of the field of vision such as the computer monitor, participants' memory of past experience, and so on. Let us take stock of three types of context germane to our study:
Displayed context: the set of items that are presented on the screen with the target but are not targets. In visual search theories such items are often referred to as distractors (cf. Duncan & Humphreys, 1989; Treisman & Gelade, 1980; Wolfe, 1994). We, however, advise caution using the term distractor because it hints that performance may be hindered by the presence of the no-target item(s), whereas the phenomenon that we pursue in this article (i.e., configural superiority effect) is concerned with potentially beneficial effects of context. Clearly, the added lines that were used as context by Pomerantz et al. (1977) and appear in Figure 1 fall into the category of displayed context.
Nondisplayed context: items or features that are part of the stimulus set but are not currently presented. In a letter recognition task, when a person is asked to recognize an impoverished letter, say A, the rest of the alphabet letters, or a subset of the alphabet, may constitute the nondisplayed context. Many studies, including Townsend and Landon (1983) and more recently Rouder (2004), demonstrated how nondisplayed context factors, such as variations in set size, affect processing. More generally, from an information theory point of view, our perception of, say, a visual pattern is determined not only by the properties of the pattern but also by the set of implied alternatives—displayed and not displayed. For example, Garner (1970) argued that argued that “Good patterns have few alternatives” and that “the very best patterns are those which are unique, having no perceptual alternatives” (p. 42).
Response assignment: the assignment of stimuli to particular responses. The Simon effect (Simon, 1969) illustrates how the compatibility of responses to presented stimuli affects performance: RTs are faster when stimulus and response occur at the same location than when they do not, even if the stimulus location is irrelevant to the task. More recently, Grice, Canham, and Boroughs (1984, Experiments 3 and 4) provided evidence for the effect of stimulus–response compatibility in a redundant-target search task, much like the type of task we use in the current study (but with different stimuli). They presented target letters (H, S) either on the left- or on the right-hand side of a fixation point and showed that responses on single-target displays were faster (and consequently led to a larger RTE) when the target appeared on the same side as the required response. Response assignment, too, is well within the broader definition of the experimental context.
All three contextual factors play a role in determining RTs in cognitive tasks. Our goal is to arrange our contexts, given in terms of stimulus set and response instructions, so that the RTE and the configural superiority effect may either counter or facilitate each other. In implementing this strategy, we also vary what we call a higher order stimulus similarity based on emergent properties arising from features presented in the presence of other features. Some of Pomerantz et al.'s (1977, 2003) results, for instance, are interpreted by way of topological constructs, an approach supported in the research of Chen (2005; Chen et al., 2003). Our stimuli differ in their topological similarity. In our experiments we are not able to establish unequivocally that topological similarity alone is the critical factor: The important figural aspects also differ in terms of other geometric properties. Nonetheless, we present interstimulus measurements that definitely support the hypothesis that the operative similarity is of a more complex variety compared with the kind of similarity a simple pixel-by-pixel ideal observer would use. Context plays a vital role by varying similarity via the set of features composing stimulus patterns and by way of the stimulus–response assignments.
The configural superiority effect demonstrates how the presence of an irrelevant displayed context (irrelevant because the context by itself is not informative to the task at hand) facilitates the processing of another task-relevant source of information. The configural superiority effect, or any other effect induced by an irrelevant source of information, suggests that some sort of interaction occurs between the processing channels of the different information sources. Given Pomerantz et al.'s (1977) figures, the features seem to somehow integrate into a unified whole, a gestalt, which in turn makes the discrimination between the target and distractors more efficient. Wenger and Townsend (2001) provided a working definition for a configural (or gestalt-like) mode of processing in terms of capacity, architecture, and stopping rule. Systems factorial technology allows testing these properties of the cognitive system and consequently determining whether particular stimuli, such as the figures used by Pomerantz et al., are processed configurally.
Defining and Implementing the Capacity Function and Related Tests
Systems factorial technology is well suited to handle data acquired through a redundant-target search paradigm. The central manipulation involves comparison of RTs on trials in which a single-target stimulus (feature, item, dimensional value, etc.) is presented versus trials in which two (or more) target stimuli are presented. Participants receive instructions to respond affirmatively if any target appears and negatively only if no target appears. This basic paradigm can be alternatively called redundant target (because the response can be made if any target is perceived) or disjunctive target for the same reason.
Because of theoretical reasons discussed below (see especially the contributions of Miller and colleagues, starting in the 1970s— e.g., Miller, 1978), if performance on the redundant-target trials is sufficiently faster than that on single-target trials, strong conclusions may be drawn about processing structure. Even ordinary parallel processing, with targets engaging in a race, can lead to redundant-target superiority (see, e.g., Egeth, 1966; Raab, 1962). In fact, even somewhat limited capacity parallel race models can produce redundant-target superiority (Townsend & Nozawa, 1995; Townsend & Ashby, 1983, chap. 4).
However, something even stronger than ordinary parallel processing must be occurring if certain RT bounds are exceeded, as first suggested by Miller (1978; see also Colonius & Townsend, 1997; see caveats by Townsend & Nozawa, 1997). Miller called this special kind of processing coactivation in an operational fashion. Later, the concept received more rigorous mathematical treatment (e.g., Colonius & Townsend, 1997; Diederich & Colonius, 1991; Miller, 1982; Townsend & Nozawa, 1988, 1995). Townsend and Nozawa (1988, 1995) introduced the notion of capacity and showed that well-defined coactivation models always predicted super capacity—that is, higher speed than a standard parallel race model with independent channels predicts. These concepts are discussed below.
There have been two major types of implementations of this basic redundant-targets paradigm. In one variety, which we call targets and blanks, a stimulus dimension can either contain a target or be blank. For instance, Townsend and Nozawa (1988, 1995) presented a single dot in the left eye, a single dot in the right eye, dots in both eyes, or no dots in either eye. “Neither” trials were entirely blank and in a “single-target left” trial, there was only a blank on the right. In one of their conditions, the left and right targets could be binocularly fused but not so in the other. The participants received instructions to respond “yes” if either position contained a dot and “no” only if neither did. Still within this class, some studies favored a go/no-go paradigm, in which participants were instructed to respond “yes” if at least one target appears and to withhold response otherwise. For example, Miller (1982, Experiments 1 and 2) used a stimulus set made up of a visual signal (asterisk) and an auditory signal (780-Hz tone). Participants were instructed to respond as quickly as possible if either or both signals were presented but to withhold the response if neither signal appeared. Despite variations in the mode of responding on no-signal trials (respond “no” in the former example, withhold response in the latter), both designs fall into the same class because they share an important common feature: Namely, a particular location, or dimension, can take one of two values—a target signal or blank; it cannot contain a nontarget signal (distractor).
We call the second major variety of redundant-targets design targets and nontargets; this variety includes a distractor value when either target is absent. There appear to be many examples of this design in the literature. For instance, Egeth and Dagenbach (1991) used a visual search task in which two spatial locations could contain the letters X and O, with X defined as the target and O as the distractor. The participants were instructed to respond “yes” if either or both positions contained the target X (i.e., if the display is XO, OX, or XX). Otherwise (i.e., when OO is displayed), they had to respond “no.” Variations in the mode of responding on no-target trials may apply for this class as well. For example, Miller (1982, Experiment 3) used a go/no-go procedure in which participants were instructed to press a key when presented with either the letter X and/or the high pitch tone (targets) and to withhold response if presented with the letter O and a low tone (distractors).
Redundant-target paradigms can assist in quantifying critical processing mechanisms, for example, how capacity changes as workload is increased. Particularly in the first kind of design, in which on single-target trials there really is nothing in the alternative position (dimension, feature, etc.), the workload measure is especially meaningful. With this design, moving from a single target to two redundant targets, workload is increased because two channels or items are processed instead of one. Thus, the potential benefits of redundancy are pitted against the possible capacity (e.g., attention) draining aspects of having two entities rather than a single entity to handle.
In the second type of design (targets and nontargets), a finding of RTE, or stronger results as discussed below, could also be due to real capacity improvements in the redundant-target trials. For instance, suppose the features in a single-target pattern are processed in parallel and independently and that the redundant target is processed quickly as a good configuration, that is, coactively (Colonius & Townsend, 1997). In this case, an RTE will arise; in fact capacity will be judged as super, and an inference of coactivation or some other type of extraordinary processing can legitimately be made.
However, this targets and nontargets type of design allows other cogent interpretations. For instance, suppose that the single-target stimuli possess nontrivial similarity with the negative stimuli (i.e., the no-target stimuli, termed negative because they are mapped onto the “no” response). This is almost always the case. Then even if the redundant-target features are processed in a standard parallel fashion, RTE measures will indicate superiority over the single-target trials. Indeed, even super capacity may be the conclusion (see below for a more precise explanation of this concept). Yet, the culprit is the slowness of the single-target stimuli RTs, not the quickness of the redundant target RTs! We have to keep this important aspect in mind throughout our experiments, which are of the second (targets and nontargets) variety.
We now show how to measure capacity and test special important cases. Consider a redundant-target search task in which the stimulus set is created by factorially combining two dimensions (A and B) with two values each (target and no target). On a given trial, the two targets can be presented simultaneously (AB; a redundant-target trial), one at a time (A alone or B alone; a single-target trial), or not at all (no-target trial, including two distractors). Accuracy and RTs for the detection of the target(s) are collected.
For each of the four experimental conditions (redundant target, single-target A, single-target B, and no target), we calculate three functions: the probability density function, f(t), the cumulative distribution function, F(t) (or CDF), and the survivor function [S(t) = 1 − F(t)]. Whereas F(t) tells us the probability that a process is finished before or at time t, its complement, S(t), tells us the probability that the process is finished later than time t. Going one step further, the hazard function, h(t), gives the probability of finishing the task in the next instant of time, given that the task is not yet completed, and is formally specified as h(t) = t(t)/S(t).
Taking the amount of work that the system does at each moment, as assessed by h(t), and integrating it up to time t yields the integrated hazard function, H(t), which is a measure of the cumulative amount of work done up to that point of time. Townsend and Nozawa (1995) showed that H(t) = −ln[S(t)], such that H(t) can be derived from the empirical survivor function. Finally, by dividing the integrated hazard function of the redundant-target condition by the sum of the integrated hazard functions from the single-target conditions, we can estimate the capacity coefficient, C(t) = HAB(t)/[HA(t) + HB(t)].
This index measures capacity continuously at all times and is therefore a relatively fine-grained index of processing efficiency. The measure is founded on the basis of standard parallel processing, which assumes simultaneity of processing, the stochastic independence of individual channels, and each channel operating at the same efficiency regardless of how many other channels are activated (i.e., working). The latter assumption is called unlimited capacity. If the system has unlimited capacity, and if information from the two channels (A and B) is processed independently and in parallel, then the integrated hazard function for the double-target stimulus, HAB, equals the sum of the functions for the single-target stimuli A and B (HA + HB). If our observed C(t) is close to 1 for all reliable sample points, the system is said to be performing in an unlimited capacity. We cannot prove that the channels are independent just because C(t) = 1, but certainly the overall system efficiency is equivalent to the standard parallel model.
On the other hand, if presenting two signals simultaneously decreases the processing ability in each of the channels (relative to when only one signal is present), then the values of C(t) would be smaller than 1, indicating that the system has a limited capacity. A standard serial system would predict C(t) = 0.5 as would a (nonstandard) fixed-capacity parallel system, which assumes that a fixed amount of capacity is divided up among the working channels. Finally, if having two targets actually increases the efficiency of processing in each channel, then the values of C(t) would be greater than 1, indicating super capacity. Wenger and Townsend's (2001; also see Townsend & Nozawa, 1995) set of axioms on configural processing state that when true configural processing occurs in a facilitatory way, that is, C(t) > 1, measured capacity should be superior to standard parallel processing.
Whereas C(t) is a continuous measure of workload capacity, the Miller (1978, 1982) inequality establishes an upper bound of performance that Miller associated with ordinary parallel race processing. The Miller bound is formally written as FA, B(t) ≤ FA(t) + FB(t), where FA, B(t) is the CDF corresponding to the probability that a response occurred before time t given a double-target stimulus AB, and the CDFs FA(t) and FB(t) are, respectively, the probabilities of a response to occur before time t given that the stimulus contained either target A alone or target B alone. The inequality states that the probability that a response faster or equal to t is given to a redundant target cannot exceed the sum of probabilities for such responses given each target alone. Townsend and Nozawa (1995; see also Townsend & Wenger, 2004) showed that the presence of super capacity over a substantial interval implies a violation of Miller's inequality. Conversely, violation of the Miller bound implies super capacity, that is, C(t) > 1.
In the opposite direction from the Miller bound, Grice (e.g., Grice, Canham, & Gwynne, 1984) suggested a lower bound on performance. It is formally given by FA, B(t) ≥ MAX [FA(t), FB(t)], where FA, B(t), FA(t), and FB(t) are again the CDFs for the double-target, single-target A, and single-target B conditions. Violation of the Grice lower bound requires extremely limited capacity (Townsend & Nozawa, 1995; Townsend & Wenger, 2004).
Thus, if performance on redundant signals is worse than that of the faster of the two single signals, then the Grice inequality is violated, implying limited capacity of a rather strong degree. Note that when FA(t) = FB(t) = F(t), performance at the edge of the Grice bound occurs exactly when C(t) = 0.5, the prediction of the fixed capacity parallel model, or the standard serial models.
Recall that the RTE subtracts the mean of the redundant condition, say, RTA,B, from the mean of the fastest single-target condition, MIN(RTA, RTB). Failure to achieve an RTE, that is, MIN(RTA, RT B) is less than or equal to RTA,B, will occur only in the face of rather extraordinary limited capacity, much as with the Grice bound.
The facilitation of RTs in response to displays containing a good gestalt should be bigger than expected on the basis of the advantage given by standard parallel processing (i.e., simple unlimited capacity). In that case, we predict, C(t) values higher than 1 (i.e., super capacity) and, possibly, violations of Miller's inequality.
We used figures constructed of angles and oblique lines, which were shown by Pomerantz et al. (1977) to produce a noticeable configural superiority effect, as stimuli. Participants performed a redundant-target detection task, in which they had to detect the presence of features that were designated earlier as targets. If these features co act (or positively interact) to create a unified whole, then presenting two targets together should produce a marked RTE, even possibly superseding standard unlimited capacity parallel processing.
Similarity, Topology, and Architecture
Similarity
In their seminal article, Duncan and Humphreys (1989) suggested that the efficiency of visual search is determined by stimulus similarity. More specifically, they argued that “search efficiency decreases with (a) increasing similarity between targets and non-targets, and (b) decreasing similarity between non-targets themselves, the two interacting to scale one another's effect.” (p. 434). The similarity that we shall discuss in this article differs, however, in two major ways.
First, we focus on the similarity between an individually displayed item and other items that are in the stimulus set but are not concurrently presented (nondisplayed context), whereas Duncan and Humphreys's (1980) similarity refers to the resemblance between simultaneously presented items, targets and nontargets, that make up the displayed context. Second, we highlight higher order, possibly topological, similarity between members of the stimulus set, whereas in Duncan and Humphreys's study, topology did not play a significant role, as the targets and distractors (rotated letters L and T) fell within the same broad topological class. Recently, Chen (2005) provided a theoretical framework and compelling empirical evidence for the role of topology in visual perception. In the upcoming section we define topology and specify our predictions regarding the way it will affect performance.
In addition, similarity in regard to stimulus–response assignment will also be important. For instance, in a parallel race model, when presented with target-absent trials, one must exhaustively process information from all (two) channels. This, plus the time-honored finding that negative responses typically take longer than affirmative ones, predicts longest RTs on exhaustive processing, target-absent trials. However, in the event of an interaction of higher order similarity plus differential response assignment of similar stimuli to distinctive responses, we can predict a further interesting effect on the no-target trials. On the one hand, a gestalt nontarget might be perceptually processed rapidly, but if it is assigned to a different response from a similar stimulus, processing could be slowed down. The consequence of these countervailing forces could leave the “no” responses at an intermediate speed.
Although topology is not the only higher order similarity possibly active in this work, it has been sufficiently studied as to render it a viable concept. We discuss some of the evidence for its validity and pertinence to the present investigation.
The Topological Connection
Topology deals with properties of geometric figures that are not changed by homeomorphism, such as stretching or bending. Two objects are topologically equivalent if one can be deformed into the other without cutting it apart or gluing pieces of it together. We can bend a rubber ring, stretch it, rotate it, change its shape and orientation, yet its topological properties (such as connectivity and number of holes) remain invariant. A circle and a triangle are therefore topologically equivalent (both have one hole), whereas the digits 0 and 8 are not (one vs. two holes, respectively). By the same token, any two triangles are topologically equivalent, even if they are rotated in space such that one is facing left and the other is facing right (see the redundant- and no-target stimuli in Experiment 1).
Chen, Zhang, and Srinivasan (2003) provided evidence for the importance of topology in visual perception. They showed that honeybees rapidly learned to discriminate patterns that were topologically different (e.g., the shapes O and S) and successfully generalized this knowledge to other novel patterns. By contrast, discrimination of topologically equivalent patterns (e.g., a ring and a hollow square), carefully chosen to control for area, luminance, and spatial frequency, was learned more slowly and not as well. These results led them to argue that “although the global nature of topological properties makes their computation difficult, topology may be a fundamental component of the vocabulary by which visual systems represent and characterize objects” (Chen et al., 2003, p. 6884).
Chen (2005) went on to provide a comprehensive theory that highlights the role of topological properties in visual perception and argues that global topological perception precedes the perception of other properties. One of his many experiments showed that when the luminance, spatial frequency, and perimeter length (as well as other factors that are commonly considered in the study of visual perception) are controlled, two visual stimuli that are topologically different with respect to holes, such as an S-like figure and a ring, are more discriminable to humans in a near threshold same–different task than are other pairs of figures that are topologically equivalent, such as a disc and a square or a disc and an S-like shape.
Pomerantz (2003) supported the view that topological properties might be the effective primitives of perception by demonstrating how topological differences can contribute to the emergence of configural superiority effects. In one illustration he presented a panel of three identical black rings and a fourth, larger ring (that differed in diameter, but not in topology). Adding an identical context to all four rings by superimposing a black disc in the center of each ring changed the topological properties of the small rings: The disc completely covered the central space, such that the rings no longer had a hole inside. The disc did not fully cover, however, the central space of the larger ring, and so that fourth item was constructed of the concentric black disc, white ring, and black ring (from the center out). Detecting the odd item in the composite display (with context) was easier than in the original display (four rings, no context added), presumably because of the topological difference between the odd item and the three (completely black and with no holes) circles. The original display and the context and the composite (original plus context) displays are illustrated in Figure 2.
Figure 2.

Detecting the odd item in the composite display (C, with context) is easier than in the original display (A, four rings, no context added), presumably because of the topological difference—that is, number of holes—between the odd item and the three completely black discs (Pomerantz, 2003).
Given the seemingly fundamental role of topological properties in visual perception, we predict that topological (dis)similarity will be instrumental in determining the order of RTs for the different figures. In our case, topologically similar items would suffer relatively slow RTs if they are assigned to different responses, because discrimination between them would be difficult and require additional processing time. On the other hand, topologically similar items that are assigned to the same response (especially if they are topologically different from the other items that may be presented) would be processed quickly, as no discrimination is needed.
Architecture
Estimating capacity is only one leg of systems factorial technology. The other leg of the methodology typically enables us to uncover the architecture and stopping rule of the processing system by way of manipulating the saliency of each target. The architecture-identification facet, independent of the capacity assessment (and therefore not plagued by the usual ability of limited capacity parallel models to mimic ordinary serial processing), requires the assumption of selective influence by carefully chosen experimental variables. That is, two distinct experimental variables must distinctively affect separate underlying subsystem's processing times (see, e.g., Dzhafarov, 1997; Sternberg, 1969; Townsend, 1984). In the present experiments, salience of the features was manipulated in Experiments 2, 3, and 4. Unfortunately, selective influence was not satisfied, so the associated tests could not be carried out. This manipulation, as well as its theoretical implications, are explained in the discussion section of Experiment 2, where it was first implemented. The capacity measurements were implemented within and over the salience manipulations with no differences found in any of the five experiments. Therefore, we do not report results in the distinct factorial conditions. Finally, we present some potential implications of the failure of selective influence for perception of our present stimuli and an interesting modest side experiment we carried out on this problem.
Experiment 1
In Experiment 1, the two single-target stimuli were constructed such that they shared the same topology and were assigned to the same response (see Figure 3A, Quadrants b and c). The redundant-and no-target stimuli were topologically equivalent to each other (Quadrants a and d) but were assigned to different responses. Also, they can be considered good configurations, as they both possessed the topological property of closure. Comparing performance between redundant-target and single-target conditions would give us a sense of which of two factors, when combined, governs processing.
Figure 3.
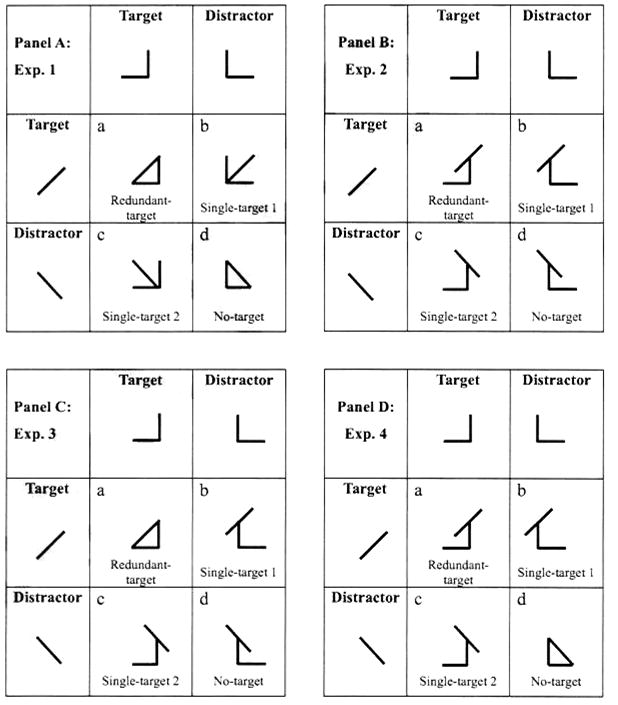
The stimulus sets used in Experiments 1–4 (A–D, respectively). Each stimulus, in each of the experiments, was made up of a diagonal line (left–right) and an └ (normal–mirror image). For each component, one value was defined as a target and the other as a distractor, such that when combined factorially they produced redundant-target (a), single-target (b and c), and no-target (d) displays. Given that the task was target detection, the stimuli in Quadrants a, b, and c call for a “yes” response, whereas the stimulus in Quadrant d calls for a “no” response.
Fast responses on redundant-target trials emphasize the role of redundancy gain, whereas fast responses on single-target trials imply that similarity, possibly topological similarity, among set items is at least as important. Additionally, deciding between these two will help in the resolution of another fundamental issue: Dominance of the topological similarity implies holistic processing (because topological similarity among items is determined by their overall shape), whereas redundancy gain can be obtained if the stimuli are processed on a parallel, feature-by-feature basis. Of course, the stimuli in Figure 3 differ in more than just their topology. We address this issue in the Results and Discussion section of Experiment 1.
Method
Participants
Twenty-four undergraduate students from Indiana University participated in the study in exchange for partial course credit. All had normal or corrected-to-normal vision.
Stimuli and procedure
The stimulus set was based on the figures used by Pomerantz et al. (1977). We used the factorial combination of a diagonal line (either left, “\”, or right, “/”) and a right angle (open either to the right, └, or to the left). The stimuli used are shown in Figure 3A and were presented in black over a gray background. The viewing distance was approximately 50 cm from the center of the screen, such that stimuli subtended a visual angle of 1.5°. On each trial, a fixation cross appeared in the center of the screen for 500 ms, followed by a blank screen (also 500 ms). Then, a single stimulus was presented in one of four possible locations around the center (trial-to-trial spatial uncertainty prevented adaptation and attending to a particular location), until a response was made. Participants had to respond affirmatively, by pressing the right-side mouse key, if either of the features that were defined as targets appeared. Otherwise, if only distractors appeared, they were to produce a negative response by pressing the left key.
Response assignment was counterbalanced over participants. In the current experiment, “/” and the mirror image of └ were defined as targets. Therefore, when either or both appeared (see Figure 3A, Quadrants a, b, and c), participants had to respond “yes.” If only distractors appeared (see Figure 3A, Quadrant d), then the correct response was “no.”. Each participant performed in a practice session consisting of 32 trials, followed by four experimental blocks of 320 trials each (amounting to a total of 1,280 experimental trials). The stimuli were presented on a Dell 15-in. computer screen, with a 1024 × 768 resolution, controlled by an IBM compatible (Pentium 3) personal computer running DMDX software (Forster & Forster, 2003).
Results and Discussion
We excluded data from 3 participants who had an error rate of more than 10% (in fact they had much higher error rates of 24%, 46%, and 41%, which likely reflect nonconformity with the instructions). Error rate was low for all other participants and across the four conditions (3.1% errors across all participants, with only 2 participants averaging 7% each and all the others below 5%), and no RT–accuracy trade off was observed. Analysis of data was restricted to correct responses. Mean RTs for each participant and averaged across participants are presented in Table 1. RTs on single-target trials were fastest, on average (448.3 and 482.7 ms). RTs in the redundant- and the no-target conditions were slower, averaging 541.7 and 552.7 ms, respectively. This same ordering appeared for most participants.
Table 1. Mean Reaction Times (in Milliseconds) for the Redundant-, Single-, and No-Target Conditions of Experiment 1.
| Participant | Redundant target | Single target 1 | Single target 2 | No target | Fastest single target | RTE | t | df | P |
|---|---|---|---|---|---|---|---|---|---|
| 1 | 454 | 372 | 463 | 521 | 372 | −82 | −7.86 | 610 | |
| 2 | 448 | 427 | 478 | 515 | 427 | −21 | −2.07 | 634 | .039 |
| 3 | 414 | 338 | 345 | 401 | 338 | −76 | −11.50 | 565 | |
| 4 | 612 | 517 | 611 | 634 | 517 | −95 | −6.32 | 594 | |
| 5 | 669 | 575 | 596 | 645 | 575 | −94 | −5.04 | 592 | |
| 6 | 646 | 512 | 598 | 696 | 512 | −134 | −6.82 | 561 | |
| 7 | 468 | 422 | 445 | 522 | 422 | −46 | −3.50 | 604 | |
| 8 | 434 | 334 | 353 | 421 | 334 | −100 | −11.84 | 506 | |
| 9 | 491 | 416 | 421 | 456 | 416 | −75 | −6.75 | 573 | |
| 10 | 659 | 504 | 482 | 603 | 482 | −177 | −12.73 | 604 | |
| 11 | 509 | 405 | 393 | 489 | 393 | −116 | −8.73 | 624 | |
| 12 | 534 | 393 | 398 | 511 | 393 | −141 | −13.29 | 586 | |
| 13 | 643 | 555 | 629 | 644 | 555 | −88 | −5.24 | 576 | |
| 14 | 498 | 399 | 439 | 551 | 319 | −179 | −9.14 | 631 | |
| 15 | 488 | 429 | 418 | 515 | 418 | −70 | −7.42 | 629 | |
| 16 | 568 | 474 | 543 | 580 | 474 | −94 | −7.46 | 608 | |
| 17 | 527 | 452 | 465 | 463 | 452 | −75 | −2.80 | 585 | .005 |
| 18 | 539 | 432 | 464 | 524 | 432 | −107 | −8.45 | 571 | |
| 19 | 564 | 436 | 441 | 573 | 436 | −128 | −11.04 | 624 | |
| 20 | 463 | 368 | 441 | 583 | 368 | −95 | −1.76 | 609 | .079 |
| 21 | 748 | 655 | 714 | 760 | 655 | −93 | −4.79 | 596 | |
| M | 541.7 | 448.3 | 482.7 | 552.7 | 442.4 | −99.3 |
Note. Redundant-target effect (RTE) is calculated as the difference between mean reaction time on the fastest single-target condition versus mean reaction time in the redundant-target condition. For both averaged and individual data, responses on single-target trials were faster than responses on redundant-target trials (resulting in negative RTE).
Recall that the critical contrast for the RTE is made by comparing mean RT on the faster of the two single-target conditions to mean RT on the redundant-target condition. Strikingly, all 21 participants in this experiment had slower RTs in the redundant-target condition, thus exhibiting a negative RTE (t test values and significance levels are presented in Table 1). All participants except for 3 exhibited a highly significant negative RTE (p < .001), documenting relatively slow responses when two targets were present. Even these 3 exhibited a significant, or close to significant (.001 < p < .1), negative RTE, as illustrated in the left panel of Figure 4, where each bar corresponds to the RTE of an individual participant and all bars (i.e., all participants) are below zero.
Figure 4.
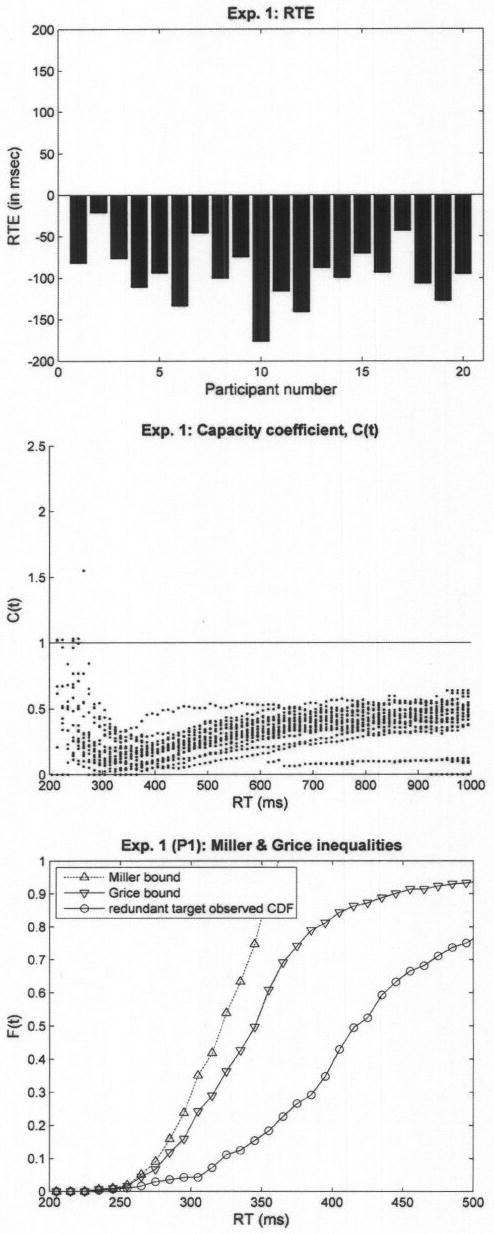
Results of Experiment 1. The left panel presents the redundant-target effect (RTE) calculated individually, with each bar corresponding to a single participant. The middle panel presents C(t) values pooled across participants. The right panel presents the Miller and Grice bounds for a typical participant (P1). The uppermost dashed line is the calculated (not observed) cumulative distribution function (CDF) for the sum of the two single-target CDFs, which serves as Miller's bound; if the redundant-target CDF exceeds this line, then the Miller inequality is violated. Violations of the lower, Grice, bound occur if the redundant-target CDF goes below the CDF of the faster of the two single-target conditions. The Miller inequality was not violated at any point t, whereas the Grice inequality was violated across almost the whole time range.
Note that we analyze data at the individual level, not across participants (although we report group means in the table and in the results sections). Different individuals may be faster to respond on single-target 1 (see Figure 3) trials than on single-target 2 (see Figure 3) trials (e.g., Table 1, Participants 1 and 2), whereas others may be faster on single-target 2 trials (e.g., Table 1, Participants 10 and 11).
The participants responded faster on single-target trials likely because the two look-alike figures that contained only a single target feature were mapped into the same response and no discrimination had to be made between them. That is, when presented with an arrow-like shape, the participant could immediately provide a positive response (indicating the presence of a target), without the need to make a more difficult discrimination of which arrow was present. However, the two isosceles triangles that constitute the redundant- and the no-target displays belong to the same topological class yet call for different responses. To respond accurately, participants had to discriminate between these two closed figures, causing in turn slower responses.
The prediction from the literature of faster performance on redundant-target trials was clearly not confirmed. Paradoxically, this absence of the RTE may signal the effect of holistic processing. The results, and the reports of our participants, suggest that the features of diagonal line slope and └ orientation were almost meaningless by themselves and therefore also the concepts of “redundant-,” “single-,” and “no-target.” Rather than looking for these components, participants assigned the stimuli in Quadrants a–c of Figure 3A as wholes to the “yes” response and the stimulus in Quadrant d to the “no” response. From that moment on, no processing of the constituting features was necessary.
We further analyzed the data using the tools provided by Townsend and Nozawa (1995). The middle panel of Figure 4 shows the capacity coefficient, C(t), pooled across individual participants [we estimated C(t) for each individual, then plotted all values on the same scatter plot, so it is really a collection of individual data]. Recall that C(t) values lower than 1.0 imply a limited capacity in the sense of the comparison of double-to-single target features. Most C(t) values in the current study lie below 0.5, suggesting that the system had a severely limited capacity. Further support for the capacity limitation is evident in the Miller and Grice bounds: No violation of Miller's race inequality was observed, whereas the Grice bound was violated for almost all time bins (see Figure 4, right panel).
In summary, the results of Experiment 1 showed that processing was fastest for the single-target conditions and slower for the redundant-target (as well as for the no-target) condition. Hence, the well replicated redundancy gain was not observed.
Possible factors that determine the efficiency of processing are the topological similarity among items and the response assignment. When presented with the topologically equivalent arrow shapes of the single-target conditions, the participant could immediately provide a positive response (indicating the presence of a target), without the need to make the more difficult discrimination of which arrow had appeared. However, the two triangles that constitute the redundant- and the no-target displays belong to the same topological class yet call for different responses. To respond accurately, participants had to discriminate between the two closed figures, causing slower responses. Recall that C(t) measures relative efficiency of redundant-to-single target. In the present case, the latter were fast and the former were slow, thus exhibiting the extreme limitations in capacity. The redundant-and the no-target stimuli may differ from the single-target stimuli in more than one aspect. However, they clearly differ in their topological properties, making topology a sufficient account for the observed violation of the RTE.
Is it possible that some type of lower order similarity could account for our results in Experiment 1? We have conducted an ideal observer analysis (cf. Geisler, 2003) to show that a different type of similarity, based on a pixel-by-pixel overlap across stimuli, yields similarity ratings that fail to account for the observed order of RTs for the different experimental conditions, making topological similarity a strong contender. These models are simple in not using relational or topological structure and yet are nontrivial in that they form the basis of ideal observer predictions, which form a strong type of optimal processing.
We provide a brief description of our procedures here (a more detailed description of the ideal observer analysis and its results can be found in Appendix A, which is available in the online supplementary materials). In implementing the ideal observer approach, we presented an optimal Bayesian decider with a noisy image of one of the four stimuli. The decider then rates the degree of pixel-by-pixel similarity among stimuli and chooses the item from the stimulus set that best matches the input pattern (by maximizing the cross correlation). We repeated this procedure many times and across various levels of noise. The ideal observer ranked the redundant-target stimulus (see Figure 3A, Quadrant a) as being most similar to single target 1 (see Figure 3A, Quadrant b), then to single target 2 (see Figure 3A, Quadrant c), and as least similar to the no-target stimulus (see Figure 3A, Quadrant d). This outcome is straightforward and can be predicted by looking at the four stimuli and eyeballing the overlap between their line segments. Thus, a pixel-by-pixel (nontopological) similarity cannot explain why participants would respond faster on single-target trials compared with redundant-target trials.2
Experiment 1 thus indicates that the effects of higher order similarity, along with response assignments, between the displayed item and the other items that made up the stimulus set but were not simultaneously presented were stronger than the effect of target redundancy. We follow up on this inference in the next experiment.
In Experiment 2, we created stimuli that belong to the same topological class. The effect of higher order similarity should vanish, and instead we expected to find the ordering that is generally observed: faster responses to redundant-target trials (redundancy gain as a result of statistical facilitation), followed by single-target trials, with the no-target trials having the slowest RTs (the no-target display requires the observer to exhaustively search both components). In fact, if the stimuli are visually interpreted as separable and independent featural combinations, then responses to the double-target trials should be as fast as standard parallel processing, that is, C(t) = 1 (i.e., unlimited capacity) approximately. If the double-target stimulus is seen as a unique positive response gestalt then perhaps C(t) > 1, indicating super capacity. Or, even simply possessing both features completely distinct from the “no” stimulus might render super capacity as a result of lessened interference.
The stimuli are presented in Figure 3B. Note that none of the items are more closed or symmetrical than the others. Note also that the four stimuli are matched for other topological properties, such as the number of terminators and the types of intersections present. C(t) values are expected to be around 1.0, or slightly lower if capacity is moderately limited.
Experiment 2
Method
Participants
Four undergraduate students from Indiana University were paid to participate in the study. Twenty-four additional undergraduate students performed in exchange for partial course credit. All had normal or corrected-to-normal vision.
Stimuli and procedure
As in Experiment 1, we used the factorial combination of a diagonal line (either left, “\”, or right, “/”) and a right angle (facing either left or right), with “/” and the mirror image of └ defined as targets. When either target, or both, appeared (see Figure 3B, Quadrants a, b, and c), the participant had to respond “yes.” If only distractors appeared (see Figure 3B, Quadrant d), then the correct response was “no”.
The procedure followed closely that of Experiment 1, with one exception: To investigate the architecture of the system (serial, parallel, coactive), we manipulated the intensity of each component (oblique line, └) to be either high or low. To construct the stimuli in the high intensity condition, we used the same black line that was used for the stimuli in Experiment 1. To construct the low intensity stimuli, we reduced the figure-to-background contrast: Using Microsoft Painter, we set the hue, saturation, and luminance values of the stimuli to 160, 0, and 226, respectively. These values yielded a pale gray line that was hardly detectable over the grey background. We use the notation HH to indicate a stimulus with high saliency in both the first (oblique line) and the second (right angle) components. We use LL to indicate that both features of a stimulus are of low salience. Similarly, we use HL and LH to indicate stimuli with one highly salient feature and one low salient feature, respectively.
Results and Discussion
We excluded data from 2 participants who had an error rate of more than 10%. Error rate was low for all other participants and across the four conditions (3.6% errors across all participants, with only 3 averaging more than 5%), and no RT–accuracy trade off was observed. Analysis of data was restricted to correct responses only. On average, responses on redundant-target trials were fastest (575.5 ms). The two single-target conditions were slower, with 602.5 (single target 1) and 634.8 (single target 2) ms, and the no-target condition appears to be slowest, averaging 708.5 ms across all participants. RTE was calculated, for each individual, as the difference between mean RT on the faster of the two single-target conditions and mean RT on the redundant-target condition. The left panel of Figure 5 illustrates the observed RTEs from Experiment 2 as bar plots, where each bar corresponds to the RTE of an individual participant. Out of 26 participants, 17 exhibited positive RTEs, nine of which were statistically significant at p < .05. As opposed to Experiment 1, only 5 participants exhibited significant (p < .05) negative RTEs.
Figure 5.
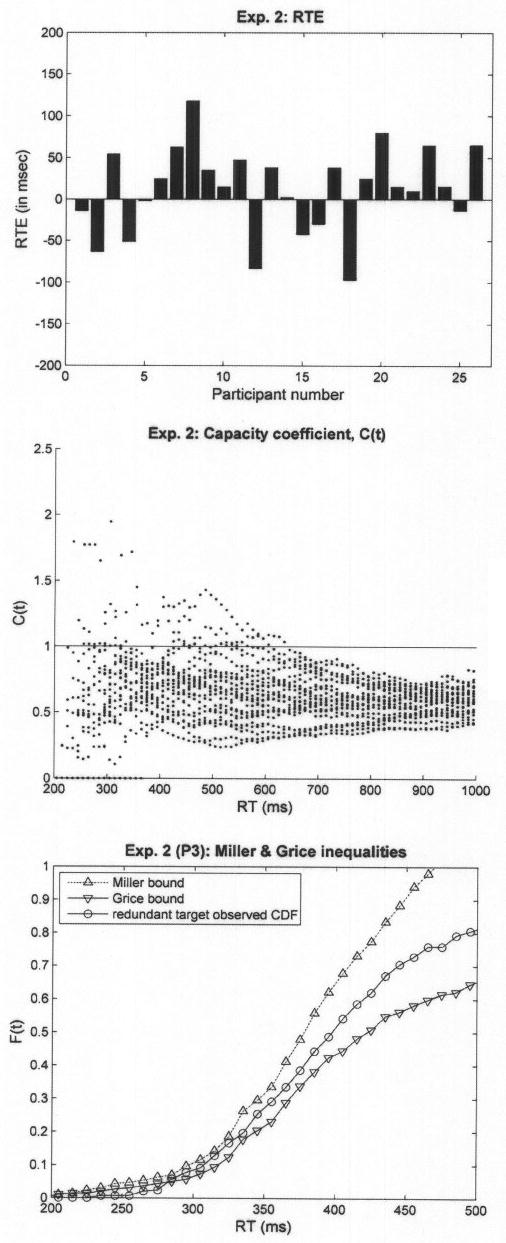
Results of Experiment 2. The left panel presents individual redundant target effects (RTEs), where each bar corresponds to a single participant. The middle panel presents C(t) values pooled across participants. The left panel presents the Miller and Grice bounds for a typical participant (P3). The observed cumulative distribution function (CDF) for the redundant-target condition lies between the two bounds, suggesting that capacity was neither limited nor super.
The results of Experiment 2, when compared with those of Experiment 1, are noteworthy. As predicted, when topological similarity across the four experimental conditions was equated, the RT advantage of single-target trials that was observed in Experiment 1 vanished. Instead, for most participants, RTs were ordered in a fashion similar to that observed in many visual search studies, including ours (e.g., Townsend & Nozawa, 1995): RTs on redundant-target trials were the fastest, then the single-target trials, and finally the no-target trials.
The stimuli in this experiment were constructed as members of the same topological class such that no stimulus was more con figural than any other ( i.e., all four types of stimuli had more or less the same spatial relations between the oblique line and the angle; see Figure 3B). None of the stimuli had the property of closure, nor was any one of them more symmetrical than any other, so members of the “yes” stimulus set were topologically and geometrically like the “no” stimulus.
If processing is a standard parallel race (i.e., unlimited capacity, independent), then C(t) = 1 and a notable, but not huge, RTE will be found. If the similarity of the single-target stimulus patterns to the negative (no-target) patterns increases single-target RTs, then it could be discovered that C(t) > 1, indicating super capacity, depending on how fast the double-target condition is. Such a slowdown of the single-target performance could be at the featural or configural level, with the latter being compatible with Experiment 1 and our subsequent findings. Thus, a finding of super capacity might mean only that the single-target data are slowed in some way by the presence of the accompanying distractor feature, rather than that the redundant target is phenomenally efficient (cf. Grice, Canham, & Boroughs, 1984; Miller, 1991). On the other hand, if 0.5 < C(t) < 1, then speed is not as good as standard parallel racing (indicating moderate limited capacity) but is better than what the Grice bound or failure to find any RTE would allow.
The middle panel of Figure 5 shows the capacity coefficient, C(t), pooled across individual participants. Concomitantly for most participants, the CDF of the redundant-target condition fell within the bounds set by Miller's and Grice's inequalities. An example from the data of a typical participant (Participant 3) is provided in the right panel of Figure 5.
A few observers exhibited a modest tendency toward super capacity, but most of the data indicated moderately limited capacity with a solid cluster of points less than C(t) = 0.5, indicating severe capacity loss per channel. Hence, the fact that the massive bulk of the data lies substantially below C(t) = 1 suggests that decisive support for parallel, independent, unlimited capacity feature processing is untenable.
The hypothesis that a large decrement in single-target efficiency arising from similarity with the nontarget stimulus inevitably causes super capacity is also falsified. And the hypothesis that the double-target stimulus forms a better gestalt than the single-target patterns under these conditions is also disconfirmed. Below we interpret these findings in light of our entire corpus of results from all five experiments.
The analyses of Experiment 2 were performed on data pooled across different levels of stimulus saliency. Manipulating the saliency of the features changed the stimulus set. Each factorial condition (redundant-, single 1, single 2, and no-target) was subdivided into four new factorial combinations (HH, HL, LH, and LL). Thus, stimuli could have been black, half black–half gray, or all gray. Acknowledging the effect of other items in the stimulus set (formerly defined as nondisplayed context) on processing, we tested whether the same set of geometrical shapes—but with no manipulation of saliency—would yield the same results. In Appendix B (see the online supplementary materials), we report the results of an additional analysis and a new experiment (Experiment 2B) revealing that the additional manipulation of salience did not significantly affect performance.
In summary, the first two experiments are compatible with our general notions regarding the contextual importance of higher order similarity interacting with response assignment, although Experiment 2 by itself is perhaps open to certain feature processing interpretations. Experiments 3 and 4 further pursued this line of thought. The stimuli sets were almost identical to that of Experiment 2, with a single exception: Three of the figures remained topologically similar to each other, but the fourth item differed; its features were spatially arranged to create a closed form (triangle).
In Experiment 3 the closed form included the redundant-target stimulus and in Experiment 4 it included the no-target stimulus. Figures 3C and 3D present the stimuli that were used in Experiments 3 and 4, respectively. Thus, in these two experiments, we expect the topological (or higher order) dissimilarity of “no” and “yes” stimuli to facilitate performance. Items that are topologically different and assigned to distinct response classes should yield fast responses. So, in Experiment 3 (see Figure 3C), we predicted that RTs on redundant-target trials (Quadrant a) would be faster than on single-target trials (Quadrants b and c). All three displays were assigned to the same response (“yes”), but although the former is topologically unique, the stimuli in Quadrants b and c share the same topological properties as the no-target stimulus in Quadrant d, which is assigned to a different response (“no”). Participants can quickly respond to the stimulus in Quadrant a but need to make an extra distinction when presented with the stimuli in Quadrants b, c, or d, which should result in slower RTs. We not only predicted responses on redundant-target trials to be faster than on single-target trials but also expected the facilitation to be greater than that observed in Experiment 2 (where all displays belonged to same topological class). Operationally, we expect to discover C(t) values higher than 1.
In Experiment 4 (see Figure 3D), on the other hand, the closed form contained the no-target display, whereas all other displays (see Quadrants a, b, and c) shared a common topological structure. Here, the single targets are dissimilar from the “no” pattern as is the double-target stimulus. In that case, if the nontarget (“no”) stimulus is not interacting with processing of the positive stimuli, then comparing RTs on redundant-target trials versus single-target trials should yield results equivalent to those observed in Experiment 2 (because the same stimuli in Quadrants a, b, and c were used in both experiments; compare Figures 3B and 3D).
Of particular interest is the no-target stimulus in Experiment 4 (see Quadrant d of Figure 3D). It is topologically distinct from the others and is uniquely assigned to its (“no”) response. In lieu of other considerations, this alone should yield responses that are at least as fast as any other condition. However, suppose the information in the “no” stimuli is processed by way of our operationally defined features. Then, the “no” stimulus features must be processed exhaustively. If those features in “yes” stimuli are processed in a terminating fashion (i.e., “stop when sufficient target information is accrued for a correct response”), then the sheer topological similarity influence would be counteracted by the termination dynamic, causing “no” trials to take longer than the “yes” trials.
Experiments 3 and 4
Method
Participants
Six undergraduate students from Indiana University were paid to participate in Experiment 3, and 6 others in Experiment 4. An additional 24 undergraduate students performed in each of the experiments in exchange for partial course credit. All had normal or corrected-to-normal vision.
Stimuli and procedure
The stimuli and procedure followed closely those used in Experiment 2, with one exception: As in Experiment 2, we manipulated the presence versus absence of the line target, the angle target, and their saliency. However, as depicted in Figures 3C and 3D, three of the figures remained topologically similar to each other, whereas the features of the fourth item were spatially arranged to create a closed form (triangle). In Experiment 3 this closed form included the redundant-target stimulus and in Experiment 4 it included the no-target stimulus.
To create the desired sets of stimuli, we slightly lowered the vertical position of the diagonal for the stimulus that creates the triangle compared with its height for the other three stimuli. This may introduce a new source of information—the height of the diagonal—that is associated with whether a stimulus is a triangle and so may make it hard to ascribe the results to triangularity or any topological property. A partial solution was obtained by introducing trial-to-trial spatial uncertainty throughout all of our experimentation. Practically, this means that the displayed item could be presented in one of four possible locations around the center of the screen. Hence, participants could not predict the location of the next display, nor could they focus their attention or foveate that particular location. Consequently, they could not fixate on one feature in order to quickly estimate its vertical distance from the other feature.3
Results and Discussion
Two participants in Experiment 3 and 4 in Experiment 4 had error rates of more than 10% and were excluded from the analysis. Mean RTs, RTEs, and C(t) values for all other participants, both at the individual and at the group level, are pooled across the factorial conditions HH, HL, LH, and LL. In Experiment 3, mean RT on the redundant-target trials was by far the fastest (470.9 ms). The two single-target conditions generated substantially slower RTs (547.1 and 589.1 ms), and the no-target condition generated substantially slower RTs (670.4 ms). The redundancy effects in Experiment 3 are overwhelmingly positive and counter the results of Experiment 1. Out of 28 participants, 27 exhibited a positive RTE (as evinced by the positive bars in the upper left panel of Figure 6), with 23 of them showing a statistically significant effect at p < .05.
Figure 6.

Results of Experiments 3 and 4. The left panels present redundant-target effects (RTEs) calculated individually, with each bar corresponding to a single participant. The right panels presents C(t) values pooled across participants.
The upper right panel of Figure 6 illustrates the capacity coefficient values observed in Experiment 3. Responses on the topologically unique redundant-target displays were much faster than on the single-target displays. Indeed, C(t) values substantially exceed 1.0, indicating super capacity. In fact, C(t) was sufficiently greater than 1 so that Miller's inequality was violated for most participants.
The results from Experiment 4 were different from those of Experiment 3. First, RTs on redundant-target trials in Experiment 4 were only slightly faster (459.5 ms) than on single-target trials (473.1 and 483.3 ms). Individual RTEs for Experiments 4 are plotted at the lower left panel of Figure 6 and show the same trend as the averaged data. Furthermore, C(t) values were typically around 0.6–0.7 and hardly ever over 1 (see lower right panel). This finding mirrors that of the positive stimuli in Experiment 2, as both redundant- and single-target displays (i.e., “yes” response trials) belonged to the same topological class and were therefore processed roughly at the same speed.
Responses for the topologically distinct “no” item in Experiment 4 were the slowest (529.4 ms on average). That the “no” stimulus of Experiment 4 was, unlike that of Experiment 2, topologically distinct from the “yes” stimulus patterns failed to produce fast “no” responses. An exhaustive search of information in target-absent trials is sufficient to account for the slow RTs, and such an explanation is consonant with piecemeal feature processing. However, given our other results that are so supportive of massive effects of interpattern similarity, we doubt the latter explanation is the best one. Other causes could supplement or replace this dynamic, such as the general tendency of people (e.g., as suggested by Clark & Chase, 1972) to take longer to make virtually any type of negation, as opposed to affirmation, decision.
The findings from Experiments 1–4 support, in general, our claim that response latencies in a redundant-target search task, using Pomerantz et al.'s (1977) figures as stimuli, are predominantly determined by high order (possibly based upon topological properties) similarity. In these experiments, an oblique line and an angle were combined to create four possible stimuli in each of the experiments. By varying the spatial arrangement of the two features such that they would sometimes form topologically equivalent stimuli and sometimes form topologically distinctive stimuli, in conjunction with their response assignment, we were able to systematically manipulate the ordering of RTs observed for the redundant-, single-, and no-target conditions. Nonetheless, it appears that classical notions of the importance of stopping rule cannot entirely be ruled out since the “no” responses in Experiment 4, though highly dissimilar from the positive stimuli, took significantly more time to process than the latter.
Could the higher order similarity referred to be topological in nature, at least as a sufficient cause? Logic suggests that the answer should be positive, as topology is mainly concerned with holes (as in doughnuts or loops—not wholes—e.g., see Munkres, 1993), and these could have been evident in our complete figures (triangles), but never in their constituting features (simple lines).4
Experiments 1–4 engage search or identification processing involving a small potential alphabet. The question arises as to how observers might perform in the presence of a larger alphabet, indeed, with a set of potential stimuli that include the previous stimuli as subsets. How will, for instance, the inclusion of two triangles, one as a target and the other as a distractor, but amidst topologically distinct stimuli (nontriangles in the present study) also either as targets or distractors, affect processing efficiency? Will the positive triangle, as in Experiment 1, be extremely slow or act more as in Experiment 3, in a highly efficient fashion? How will the positive and negative stimuli fare with respect to one another in general? Experiment 5 examines these questions.
Another motivation for using a larger stimulus set in Experiment 5 was to examine capacity (as well as other measures: RTE, Miller's bound, etc.) when participants are encouraged to process features. In Experiments 1–4, the small number of possible stimuli allowed participants to bypass the processing of the features by memorizing whole figures and their corresponding responses. Garner (1978) referred to such possibility as configural interaction to indicate that in some cases the attributes used by the experimenter do not define the properties of the stimuli as processed by the participant. Rather, the stimuli become new entities, or configurations. For example, participants could easily assign the three target-present figures as wholes to the “yes” response and the fourth no-target figure to the “no” response. Although this could be regarded as a support for holistic processing, we should consider the possibility that in some cases stimulus sets may be too large to allow such a strategy. A more parsimonious approach would then be to look for either the line target or the angle target. Would participants still show evidence for holistic processing even when encouraged, almost forced (by the large number of target items), to process the constituting features? In Experiment 5, we tested this question by introducing a much larger stimulus set, which makes the memorizing of items as wholes much more difficult and therefore less likely.
Experiment 5
Method
Four undergraduate students were paid to participate in Experiment 5. An additional 22 undergraduate students performed in exchange for partial course credit. All had normal or corrected-to-normal vision. As in the previous experiments, an oblique line (left–right) and an angle (left–right) were combined to form the stimuli, thus creating four experimental conditions (redundant target, single target 1, single target 2, and no target). However, as depicted in Figure 7, the line and angle could be arranged together in any of five ways, creating a total of 20 stimuli. The “/” and a rotated └ were again defined as the targets; when presented with either or both, the participants were to respond affirmatively by pressing the mouse key marked “yes.” Otherwise, they were to press the “no” key. Overall, 15 items contained at least one target feature and were assigned to the “yes” response, whereas the remaining 5 stimuli contained only distractor features.
Figure 7.
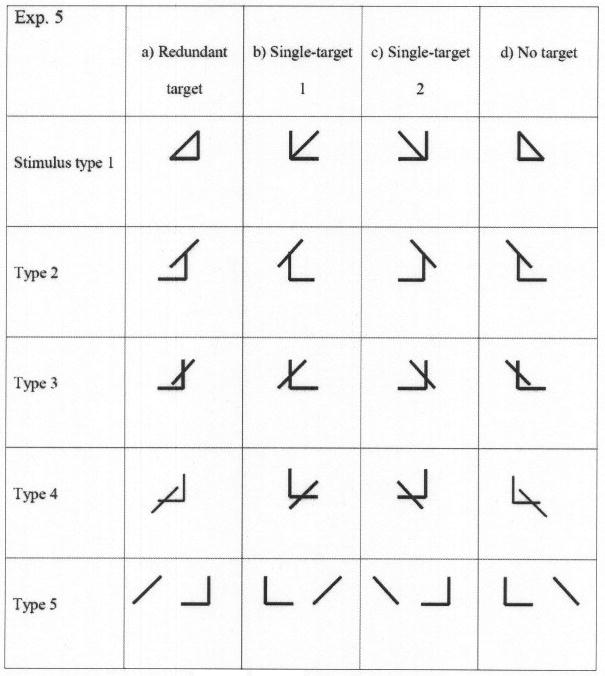
The stimulus set used in Experiment 5. As in the previous experiments, the redundant-target (a) and single-target (b and c) displays call for a “yes” response, whereas the no-target display (d) calls for a “no” response. The basic features of line and angle could be combined together in one of five spatial arrangements (stimulus types).
The design was similar to that of Experiment 1, with slightly fewer trials because of a longer instruction phase at the beginning of the session (the larger number of possible stimuli dictated more time for the introduction of stimulus examples). Each participant performed in a training session of 40 trials, followed by four experimental blocks of 240 trials each (a total of 960 trials that gives 240 trials per condition), with stimulus order randomized across and within blocks. The stimuli were evenly divided to five possible spatial arrangements (types), such that each of the four conditions had an equal number of 48 trials for any given spatial arrangement. We did not manipulate the saliency of the features, so stimuli were always presented in black over a gray background.
Results and Discussion
We excluded data from 3 participants who had an error rate of more than 10%. Most other participants demonstrated a notable RTE; when pooled across stimulus types, responses on redundant-target trials were much faster (577.4 ms on average) than on single-target trials (731.4 and 667.1 ms on average). The top two panels of Figure 8 show individual RTEs and capacity across all stimulus types. Positive RTEs, accompanied by C(t) values that exceed 1, were observed for almost all participants when data were pooled across stimulus types. Analysis of variance revealed that 17 out of the 23 participants exhibited highly significant RTE (p < .001), 1 (Participant 11) showed a negative RTE (p < .001), and the rest did not have statistically significant results. Also, there were massive indications of super capacity.
Figure 8.
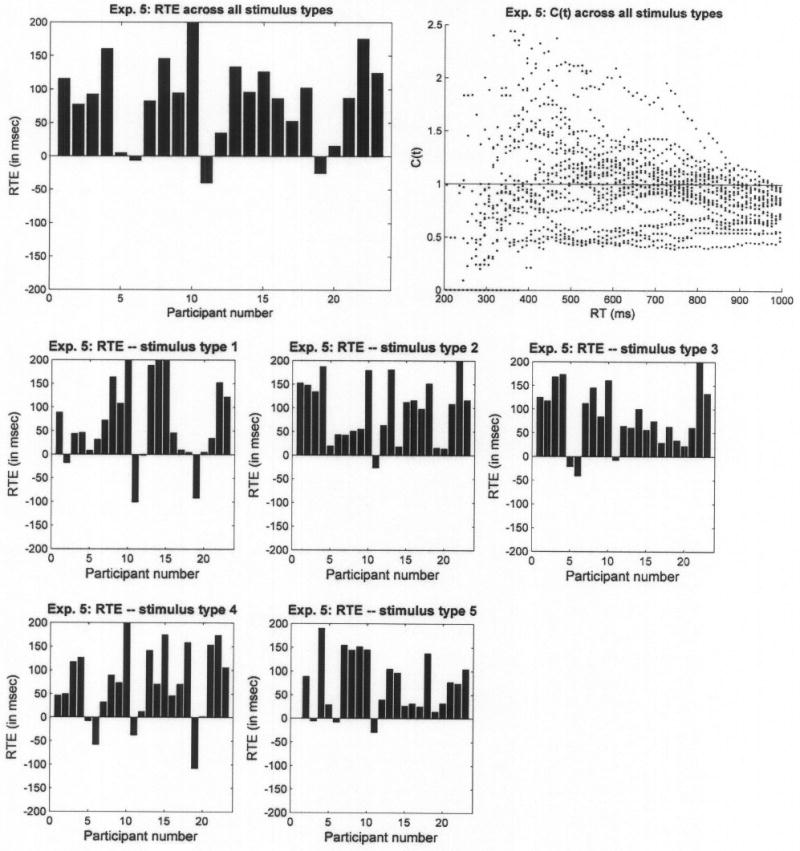
Redundant-target effect (RTE) and capacity coefficient, C(t), for Experiment 5. The upper left panel presents individual RTEs, where each bar corresponds to a single participant. The upper right panel presents C(t) values pooled across participants. The lower panels present RTEs calculated separately for each stimulus type.
What is more interesting is that positive RTEs and super capacity were observed also when estimated separately for each of the stimulus types (bottom of Figure 8). Most startling is the pattern observed for Stimulus Type 1. These are the exact same stimuli that yielded a negative RTE and extremely low C(t) values in Experiment 1. However, when presented in Experiment 5 as part of a larger stimulus set (i.e., different nondisplayed context), they led to a positive RTE and super capacity for most participants.
On a minor but interesting note, the two single-target stimuli were not processed at the same rate. Responses to single target 2, where the single target was the angle, were faster than to single target 1, where the target was the oblique line. Several reasons may account for this result: The overall length of lines in the angle is larger than the oblique line, the angle possesses the extra feature of a vertex (angle) where the horizontal and vertical lines meet, and sensitivity to horizontal and vertical lines (angle) may be higher than to diagonals. In Experiments 1–4, on the other hand, single-target 1 trials were faster than single-target 2 trials. We cannot determine unequivocally what drives this difference, but one speculation is that with a small set size of four items, the items may be processed as wholes and the advantage of one feature (angle) over the other would not matter as much. Other factors, which we have not studied, may then determine the relative RTs of single-target 1 versus single-target 2 conditions.
Returning to the primary focus, the super capacity observed in Experiment 5 could result from averaging data across subconditions; participants may have processed certain types of stimuli holistically (for instance, the line and angle that were spatially arranged to create the closed figure of a triangle) but not others. Separate analyses of RTE for each stimulus type (bottom of Figure 8) revealed that this was not the case. In addition, we examined a finer grained capacity analysis, calculated for each stimulus type. For this purpose, we asked a new participant to perform in two sessions instead of just one, so that we would have enough trials (98) to establish stable CDFs for each of the five stimulus types in each of the four conditions (redundant target, single target 1, single target 2, no target). The results for each stimulus type were qualitatively similar: Regardless of whether the oblique line and the angle were aligned to create a triangle, crossing each other, or spatially separated, the participant repeatedly demonstrated super capacity, thus showing evidence in favor of holistic processing.
Examples of the capacity coefficient functions calculated separately for two stimulus types are presented in Figure 9. Figure 9A corresponds to Stimulus Type 1, and Figure 9B corresponds to Stimulus Type 2 (the stimuli are depicted in Figure 7); in both cases, C(t) values exceed 1.0, thus manifesting super capacity. These two examples are especially intriguing because they correspond to stimuli that are identical to the stimuli used earlier in Experiments 1 and 2. The stimuli that were presented in Experiment 1 yielded extremely low C(t) values and negative RTEs. The exact same stimuli in Experiment 5 as part of a larger set yielded super capacity. Likewise, the stimuli that were used in Experiment 2 yielded C(t) values around 1.0, or slightly lower. The same set of stimuli used in Experiment 5 within a larger set yielded C(t) values that exceed 1.0, suggesting that capacity was super, at least for some time t.
Figure 9.

Capacity coefficient, C(t), calculated separately for each stimulus type (Experiment 5, Participant 27). Panel A illustrates the C(t) function for Stimulus Type 1, and Panel B illustrates the C(t) function for Stimulus Type 2 (both stimulus classes are presented in Figure 10).
With regard to interpretation of the major RTE and C(t) findings in Experiment 5, theoretically, participants could assign the figures to their corresponding response as wholes by adopting a negative strategy, that is, by memorizing a relatively small number (five) of target-absent figures and responding “no” if they appeared and “yes” otherwise. However, inconsistent with such a hypothesis, our data showed that participants were much slower in the no-target condition (792.7 ms) than in the target-present conditions.
Overall then, Experiment 5 in conjunction with Experiments 1–4, indicates that not only are context, higher order similarity, and response assignment important, but the entire complex of stimuli plays a key role. This conclusion is afforded by the fact that Type 1 stimuli (which include triangles in both a target and distractor role) exhibited the usual positive RTE and super capacity, rather than the extreme limited capacity found in Experiment 1. The cause of the marked super capacity is, as in the other experiments, attributable to two likely sources: (a) There was a strong configural perception of the redundant targets, relative to the single-target stimuli, and (b) even if the redundant target was processed in an ordinary parallel, race fashion, the slowing down of the single-target stimuli could have caused C(t) > 1. Other possible explanations of these and the entire data corpus are considered next.
General Discussion and Conclusions
Application of Systems Factorial Technology to Study Similarity and Redundancy
Let us recap the motivation and basic structure in the current experiments. Pomerantz and colleagues (e.g., 2003, 1977) have been investigating properties of good configurations for some time. One effective methodology has been the odd-one-out strategy: For instance, Pomerantz et al. (1977) presented a four-item display to their participants, asking them to indicate the location of the figure that was different from the other three. Responses were faster when certain contexts were added (but were slower with other contexts or with no added context), suggesting that nonin-formative contexts can contribute to the creation of emergent properties such as closure or symmetry, which in turn facilitate the detection of the odd item.
Many if not most experiments that directly or indirectly use attention, including the odd-one-out approach as well as the Tanaka and Sengco (1997) part-to-whole paradigm, several of Garner's tasks, and many other methods, can be divided into focused attention versus divided attention strategies. The former approach typically studies psychological issues via interference or assistance from the irrelevant stimulus elements, whereas the latter approach appraises issues assuming that attention (whether serial, parallel, or hybrid) must be applied to all the presented information. We hoped through the machinations of systems factorial technology to exploit a divided attention design in order to learn more about higher order similarity among patterns (e.g., of the topological variety explored by Pomerantz et al., 1977) and how it interacts with response assignment to affect process structure and efficiency.
To increase comparability to the Pomerantz et al. (1977) study, we used their figures here in a redundant-target search task. On a given trial, only a single stimulus item was presented, whereas the other three constituted the nondisplayed context or the set of stimuli that might have appeared on that trial but did not. The same set of basic features was used throughout all five experiments: an oblique line (left–right) and an └ shape (normal–mirror image). The two features were arranged in a way that could create a closed figure (a triangle) or a nonclosed figure. The oblique line “/” and the mirror image of └ were defined as targets. Therefore, when either one or both appeared, the participant had to respond “yes.” If only distractors appeared, then the correct response was “no.” Of course, mean RTs in redundant-target search tasks are generally ordered such that redundant-target trials are the fastest, then single-target trials, and finally no-target trials (e.g., Egeth & Dagenbach, 1991; Feintuch & Cohen, 2002; Grice, Canham, & Boroughs, 1984; Mordkoff & Yantis, 1991).
As we mentioned earlier, we use the term feature to refer to physical properties. Thus, we do not imply that the diagonal lines and └ shapes are the features used in human vision, particularly in a context-invariant fashion. If these were the operative features, then certain predictions, such as RTE, follow in certain of our designs. In some of our experiments, those predictions were violated, implying that the diagonals and └s were not the operative features under the attendant conditions, which in turn supports the notion that other features, such as topological ones, may have been engaged.
The odd-one-out strategy varies interpattern similarity within a display, whereas our approach varies similarity within the entire stimulus alphabet and across distinct response assignments in a redundant-targets design. However, in both designs, presence of a higher order similarity could potentially either impede or facilitate performance, thus acting in concert with, or antagonistic to, the usually helpful redundancy.
Manipulating the multiplicity of targets leads to an index of capacity of the double-target channels (on redundant-target trials), relative to single-target trials, and testing of upper and lower bounds on ordinary parallel race models. These analyses do not automatically test architecture—parallel versus serial processing—in a way unconfounded with workload. However, presence of an RTE, not to mention a finding of super capacity, is difficult to explain from a serial model point of view (e.g., Townsend & Ashby, 1983, chap. 4; but note that it can happen under certain circumstances, Townsend & Nozawa, 1997).
Testing Architecture and Failure of Selective Influence
In fact, we also tried to execute a branch of systems factorial technology that directly assesses the parallel versus serial issue—that is, we manipulated factors chosen to selectively influence processing durations of the separate features to test parallel versus serial processing directly (e.g., Schweickert & Townsend, 1989; Sternberg, 1969; Townsend, 1984; Townsend & Nozawa, 1995). The factors used in this study were contrast levels (high, low) of the respective features (oblique line, “L”).
The assumption of selective influence (e.g., Dzhafarov, 1997; Townsend & Schweickert, 1989) is critical in this operation and can be partly tested in several ways, the most pertinent here being the ordering of the survivor functions (or cumulative distribution functions). If selective influence is in force, the ordering should be SLL(t) > SHL(t) and SLH(t) > SHH(t), where L refers to the factor setting leading to slower processing and H refers to the factor setting leading to higher speeds. The first and second positions simply refer to the two distinctive features. The logic here is that processing is slowest (associated with a great probability that processing is not completed by time t—the definition of the survivor function) for the LL condition, next slowest for the HL or LH conditions, and fastest for the HH condition. This ordering was frequently violated in our data in all the experiments.
We are uncertain as to how and why the assumption of selective influence was violated in these experiments. The manipulation by selective influence has been highly successful in many studies in our and others' labs. We speculate that the loss of selective influence may have been associated with nonindependent processing of the features, as a result of their interactive nature. However, there are clues that the interactions, if present, may not be the ones we usually interpret in terms of configurality. Thus, several of the participants exhibited a symptom of selective influence breakdown that could be caused by a negative interaction (see Townsend & Thomas, 1994). This symptom is in the opposite direction to the positive dependence that we posit characterizes configural, gestalt perception (see Townsend & Wenger, 2004; Wenger & Townsend, 2001).
Perplexed, we carried out an ancillary experiment, with 4 participants, using the same features and experimental factors as in Experiments 2–4, but we displayed the line and the angle 1 cm apart from each other (approximately 1.15°), such that it would be less likely they would be combined to create a single figure. This simple manipulation resulted in selective influence of saliency on the speed of processing, as apparent from the relatively ordered survivor functions (for 3 out of 4 participants). Given that selective influence holds, we could estimate interaction contrasts at the mean (mean interaction contrast) and distribution (survivor interaction contrast) level and make inferences about the underlying architecture.5 The mean and the survivor interaction contrast plots of a typical participant (Participant 1) are presented in Figure 10. For all 4 participants, the mean interaction contrast was overadditive and the survivor interaction contrast function was positive for all time t. Together, the results of the two contrasts suggest that when the line and angle were spatially distinct, they were processed in parallel, and with a minimum-time stopping rule (cf. Schweickert, Giorgini, & Dzhafarov, 2000; Townsend & Nozawa, 1995). Presenting the features adjacent to each other such that they form a complete figure, as we have done in Experiments 1–5, may result not only in the failure of selective influence but also in a change of the architecture (and possibly the stopping rule).
Figure 10.
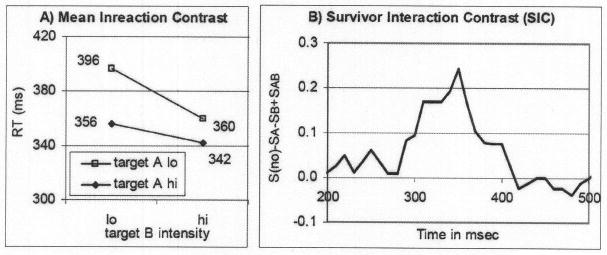
Mean interaction contrast (MIC; A) and survivor interaction contrast (SIC; B) plots for a typical participant in the auxiliary experiment, where the targets (line, angle) were spatially separated. The overadditive MIC and the entirely positive SIC suggest that the line and angle targets were processed in parallel, with a minimum-time stopping rule.
Hence, the clear suggestion is that the close proximity of the angle and line features in all the main experiments in this study is indeed interacting in some fashion that disrupts selective influence, but we do not know exactly how yet. We intend to investigate these phenomena further. The postscript on this topic is that the attempt at factorial manipulation did not affect any of the conclusions concerning the major issues, and we do not discuss it further.
Higher Order Similarity Among Stimulus Set Items and Response Assignment
By changing the relative position of the same features to create different figures, we thereby manipulate the configuration of each figure. Our results suggest that it is not the configuration of each item per se but rather its similarity to the other set items (and the response assignment) that governs the speed of processing. In the redundant- and no-target conditions of Experiment 1, we assigned the line and angle together such that they created a closed figure—a triangle. Though the two triangles differed in the direction of their inclination (left–right), they shared similar topological properties: one central hole surrounded by (three) line segments that are connected to each other at their ends. Because one such triangle was assigned to the “yes” response and the other to the “no” response, a discrimination between the two had to be made, causing in turn relatively slow RTs.
In contrast, the two single-target displays had an arrow shape with no holes. Both belonged to the same topological class yet differed from the closed figures. Because single-target displays were both assigned to the same response (“yes”), no discrimination was required, and because they differed markedly from the no-target display, the only condition assigned to the “no” response, the participants could immediately provide a positive response, indicating the presence of a target. RTs for the single-target condition were therefore faster than those observed for the redundant-target condition, hence a negative RTE.
The (positive) RTE is a common finding in many visual search studies with multiple targets (e.g., Egeth & Dagenbach, 1991; Feintuch & Cohen, 2002; Grice, Canham, & Boroughs, 1984; Mordkoff & Yantis, 1991) and a robust effect that appears across a variety of experimental conditions. In a particularly interesting experiment, Miller (1991) used auditory targets that varied in pitch (high, low) and visual targets that varied in location (high, low). A redundant-target display could therefore be composed of auditory and visual targets that were either congruent (e.g., high pitch and high location of the visual target) or incongruent (high pitch and low position). Although responses to congruent redundant targets were faster (585 ms) than responses to incongruent redundant targets (611 ms), both were much faster than responses to single-target trials, either auditory (825 ms) or visual (725 ms). Thus, redundancy overpowered congruity. (We leave the discussion open as to whether congruity is a special type of high order, semantically driven, similarity). A notable RTE was documented even when the targets were incompatible, possibly competing with, or inhibiting each other.
The absence of an RTE—in fact, the presence of its anti pode—in the current study is surprising. We argue that high order, possibly topological, similarity among set items plays an important role in the processing of the figures, along with the assignment of responses (i.e., whether topologically similar items call for the same response). These factors seem to be dominant in determining the unique ordering of RTs that was observed in Experiment 1. Other types of similarity may account for the results, making topology a sufficient rather than a necessary account.
In addition, we used an ideal observer analysis to rule out at least one alternative account—that of a low level, pixel-by-pixel, similarity. The ideal observer analysis essentially defines similarity by way of pixel or area overlap of two stimuli. The results strongly argue against simple overlap as a gauge of similarity, although even this crude measure can explain a hefty amount of confusion data in ordinary identification experiments (e.g., Townsend, 1971). Note that overlap as defined here is identical to cross-correlation measures of similarity.
To further pursue the similarity hypothesis, we manipulated the topological similarity among conditions by varying the spatial relations between the line and the angle. In Experiments 2–4, we changed the relative position of the line and angle such that some combinations would yield closed figures and some would yield unclosed lines (the relevant displays were presented earlier in Figure 3). As a result, some figures had holes and were therefore topologically different from other figures that did not have holes. By manipulating the topological (dis)similarity among display conditions we were able to obtain, eliminate, and reverse the RTE.
As noted earlier, a number of studies (e.g., Duncan & Humphreys, 1989; Pomerantz et al., 1977; Treisman & Souther, 1985) have indeed shown that the resemblance between the target item and other items (distractors) on the same display determined whether the target would pop out. In the current design, rather than simultaneously presenting the target and distractor items, we presented only a single item per trial. Nonetheless, the nondisplayed items—that is, other items from the stimuli set that appeared on previous or subsequent trials—were just as influential in determining the target-detection latencies. Our findings are consistent with a principle notion of information theory, arguing that perception depends not only on the stimulus presented for view but also on its alternatives—those stimuli that could have been presented but were not presented on that particular trial (Garner, 1974). Naturally, we again emphasize the criticality of response assignment, not just the fact that a pattern is a potential stimulus.
The Capacity Index and Alternative Explanations of Results
Experiment 1, with its single-target stimuli similar to the no-target stimulus, yielded some of the lowest capacity indices we have measured to date. Experiment 2 with homogeneous arrow-like stimuli (like the single-target patterns in Experiment 1) provided evidence for moderately limited capacity parallel processing and consequent modest RTEs. Experiment 3, with the triangle serving as the redundant target and the nontriangles either single-target patterns or the “no” stimulus, generated strong super capacity and major RTEs. Experiment 4 is key because all the positive stimuli were similar and the good gestalt was the no-target triangle. Yet, capacity was moderately to severely limited, leading to violations of the Grice inequality for some of the participants, with only miniscule RTEs. Finally, Experiment 5 again found an abundance of super capacity and strong RTEs, even when restricted to the stimuli from Experiment 1, which had delivered exceptionally low capacity!
The most viable explanation starts by assuming that processing is parallel. Such models can span the range of extremely limited to super capacity found across our collection of experiments. The failed attempt at eliciting selective influence, and its evocation when the features were physically separated, backs up other facets of the data that suggest that if processing is based on features, it is not stochastically independent.
Most critically, we view higher order, possibly topological, similarity as being essential, when paired with the response assignment, to explaining the large set of experimental data: Experiment 1 yielded excessive limited capacity because of the similarity of the redundant target to the no-target pattern. Experiment 2, with homogeneous stimuli for all responses, found moderate redundant effects. Experiment 3, with high dissimilarity of the triangle from the other positive stimuli, produced extreme super capacity. Experiment 4, like Experiment 2, assessed capacity at a modest level. Experiment 5 suggests that the total stimulus alphabet, including frequency of stimulus types and their similarity, is important because the latter included the same stimuli as in Experiment 1, but with very different capacity conclusions.
To provide an overview of this study, we briefly consider a number of alternative models, some of which have been presented earlier. It is important to note that either serial or parallel processing models could potentially be using other features, lower or higher order of the stimulus patterns, than those with which we built them. Indeed, in the case of parallel processing, completely holistic models might assume processing of the entire pattern as a unit. By default, all points (and all features of any description) would thereby be processed in a perfectly simultaneous fashion. Ultimately, a detailed analysis of the processing system must include submodels not only of the perception of the stimuli but also of other strategic facets, such as how the higher order similarity comparison is being computed and specifically how it interacts with response assignment. These latter issues cannot be discussed in detail here. Only certain broad-based aspects of the models can be addressed.
First, consider the class of serial models. There is a small set of selected data, those that found violations of the Grice inequality (Experiment 1), in which serial processing could have explained the results. However, it would be unparsimonious to propose this model because most of the data cannot be so explained. And there are other accounts that handle the various experiments together. Observe that we are not claiming that no serial model of whatever generality can accommodate our data. Indeed, Fournier and Eriksen (1990) deemed serial processing to be the preferred explanation for their results. Previous theoretical efforts demonstrate that the broad class of serial systems is exceedingly flexible (e.g., Townsend & Ashby, 1983), even being able to produce super capacity under some circumstances (e.g., Townsend & Nozawa, 1997). We view these models as just being unrealistic in the present circumstances.
Second, consider parallel race models. In a sense, any parallel model that permits first-terminating (i.e., minimum processing time) stopping on a redundant target is a race model, if one is liberal on how limited or super the capacity might be. Even models that assume holistic perception, template matching, or cross-correlations can often be represented as types of parallel processing (e.g., Wenger & Townsend, 2001). However, we can rule out some parallel models.
Parallel models based on independent, unlimited capacity feature processing are definitely falsified. Similarly, template models that assert that every stimulus is a unique pattern that is processed holistically without reference to the other stimuli and then a response assigned, again independent of the other patterns in the stimulus set, cannot explain the present results. For instance, such models are not subject to interstimulus similarity influences.
Perhaps the most attractive possibility, which alas cannot encompass many of the present results, assumes some type of parallel coactive, perhaps configural, processing on the redundant-target stimulus relative to the single-target stimuli. An inference of coactivation, for many years an operationally defined concept (violate Miller's inequality and coactivation exists; satisfy it, and it does not), was the goal in a legion of studies. Nonetheless, even Miller's own early ideas focused on the notion of combining activation in a subsequent channel (e.g., Miller, 1982). More recently, quantification of the concept has also centered around the notion that activation in parallel channels is summed or nonlin early combined in a final conduit, preceding a decision structure (e.g., Colonius & Townsend, 1997; Diederich & Colonius, 1991; Townsend & Nozawa, 1995). Such models allow that Miller's inequality might be satisfied, or C(t) < 1, as a result of channel inhibition, response competition, or other capacity-limiting circumstances. For instance, Fournier and Eriksen (1990) adduced coactivation even though performance on a redundant-target stimulus was no better than on a single, isolated target, by way of hypothesizing canceling effects of coactivation and a distraction effect.
In any event, a straightforward coactivation model can predict Experiment 3 but is hard pressed on any of the others. For instance, even in Experiment 5 in which substantial super capacity was discovered, the nice triangle display is but one of a number of redundant-target displays to receive a super capacity rating. And, in Experiments 1 and 4, the triangle was the no-target stimulus but was not the most efficiently perceived pattern in either.
Although coactive models account for the faster responses on redundant-target trials by postulating some sort of channel summation (or interaction between channels) that speeds up processing, another approach attributes the RTE to the absence of distractors on redundant-target trials. Grice, Canham, and Boroughs (1984; see also Miller, 1991) suggested that the contents of dis tractor channels distract the participant on single-target trials. Therefore, on redundant-target trials the response is especially fast because of the absence of the distractor that is present on single-target trials, not because of the two targets co activating the response. This approach predicts different results on redundant-target search tasks that either use or do not use distractors. It was therefore natural to test capacity (and RTE) with our current design and targets, but without distractors (i.e., what we referred to earlier as targets and blanks).
Thus, we found a rather conclusive argument against a simple coactivation model, as well as certain other explanatory approaches, by recently conducting an auxiliary control experiment without distractors using the same basic stimuli as the other experiments. That is, on single-target trials, no nontarget was included. On redundant-target trials there were two targets and there were no stimuli at all on “no” trials (i.e., a blank screen followed the presentation of the fixation cross, until a response was given). The redundant-target display was identical to that of Experiments 1 and 3 (e.g., Figure 3A, Quadrant a), where the line and angle targets were simultaneously presented and formed a triangle. On the single-target trials however, we presented a single-target feature but no distractor. So, on one single-target display there appeared only the oblique line (Target 1); on the other, only the angle (Target 2); and on the no-target trials, no features were presented.
Four participants performed in a forced-choice target-detection task. As in the previous experiments, when presented with either target or both, they were asked to press the “yes” key; if no target appeared, that is, a blank screen (because there were no distractors), they had to press the “no” key. Four additional participants performed, with the same stimuli, in a go/no-go target-detection task. When presented with either or both targets, they were instructed to press a prescribed key; otherwise, they had to withhold their response. The results of all 8 were qualitatively similar: We found the usual ordering with a superiority of the redundant-target trials but with moderately limited capacity, just as in Experiments 2 and 4. No violations of the Miller inequality were observed, but numerous violations of the Grice bound were evident and C(t) values hovered around 0.5 to 0.6, suggesting the capacity was limited (to the extent that processing had to be serial or parallel with fixed capacity). Thus, a small but significant RTE was located [recall that an RTE will be found unless capacity is extremely limited, that is, C(t) is less than around 0.5]. Hence, the absence of high super capacity does not depend on the presence of distractors, and the presence of both targets does not guarantee super capacity.
Perhaps the closest approximation to our theoretical conclusions is the notion of response competition (e.g., see Fournier & Eriksen, 1990; Grice, Canham, & Boroughs, 1984; Van der Heijden, Schreuder, Maris, & Neerincx, 1984). And, as in Fournier and Eriksen (1990), similarity of the target and nontargets has sometimes been discussed in relation to response competition. Finally, the fact that Fournier and Eriksen found that response competition depended on a small visual presentation angle (in their study, it disappeared at around 5°) is consistent with our visual angle of 1.5°.
We do not claim to understand all aspects of the results. For instance, the fact that in Experiment 4, the “no” stimulus was very different from the positive stimuli did not render the latter much faster than in Experiment 2. The exact nature of how similarity interacts with response assignment may take some time and experimentation to figure out. And, given the large number of possible candidate models, especially if we allow much complexity, we cannot rule out all alternative explanations.
The extensive experimental terrain of both redundant-targets mechanisms and the diverse effects of similarity in perceptual and cognitive phenomena is far from well understood. Even such fundamental aspects as whether Miller's inequality is violated can differ across seemingly trivially dissimilar paradigms. Although knowledge of configural perception is growing, we are a long way from a unified theory for either. Even the exact nature of the concept of psychological similarity remains somewhat murky.
Yet the present series of experiments does indicate the power of a higher order, possibly topological, type of similarity and response assignment to overwhelm the formidable RTE. These experiments build on but also extend the work of Pomerantz and his colleagues (e.g., 2003, 1977). That work was primarily the experimental demonstration of a variety of configural superiority effects, in which the addition of certain noninformative contexts may dramatically improve the discriminability of simple, presumably basic physical features like line orientation. The present work extends these findings experimentally and theoretically. Experimentally it shows that related, noteworthy effects arise with quite a different procedure, the redundant-target paradigm. Theoretically, it brings the highly powerful techniques of systems factorial technology to bear on these configural phenomena that previously had not been modeled formally. In addition, the results continue to broadly support, to expand, and to articulate notions of context put forth over the last century and a half by a long line of psychology's pioneers.
Acknowledgments
Parts of this work were presented at the annual meeting of the Visual Science Society, Sarasota, Florida, May 2005; at the annual meeting of the International Society for Psychophysics, Traverse City, Michigan, October 2005; and at the Society of Experimental Psychologists, San Diego, California, March 2006. This research was supported by National Institutes of Health–National Institute of Mental Health Grant MH 057717 to James T. Townsend.
We thank Christi Gibson and Matthew Primeau for their assistance in collecting the data and Leslie Blaha, Mario Fific, and Chris Honey for helpful comments on earlier versions of this article. We also thank Bruce Solomon from the Indiana University Department of Mathematics for helpful comments regarding the topological properties of the stimuli we investigated.
Footnotes
Salutary effects of context were observed in many other cases, such as the recognition of a letter within the context of a word (Reicher, 1969) or the recognition of a target object preceded by the context of an appropriate scene (Palmer, 1975).
In some instances, such as scale (size) variation, a pixel-by-pixel comparison may be a biased estimate for the degree of similarity between shapes of stimuli. For example, a filled square and a filled triangle may have a higher pixel-by-pixel match than a small square and a large square, although in terms of the overall geometric shape the latter two are more similar to each other. In our study, we kept the scale invariant, so a pixel-by-pixel match is a close approximation of the geometrical (shape) similarity.
Moreover, in Experiments 1 and 2 the vertical distance between the diagonal and the angle was fixed within experiments (i.e., in each experiment separately, no display differed from the others in terms of distance between its features). Specifically, the distance between the features making up the redundant-target display was exactly the same as the distance between the features of the single- and no-target displays, in both experiments. Yet the results differ qualitatively: In Experiment 1 responses on redundant-target trials were slower than on any other condition, whereas in Experiment 2 they were the fastest. Vertical distance between the features cannot account for the different ordering of RTs, whereas topological similarity between displays does seem to provide an adequate explanation. Following the same line of reasoning in Experiments 3 and 4, we expect topological similarity to be a more pertinent factor than the distance between features.
At least some of our participants reported that they were looking for the target stimuli as wholes (i.e., looking for the overall displays that should yield a positive response), rather than looking for the features that were designated as targets, but such reports are subjective and should therefore be interpreted with caution.
Formally, mean interaction contrast is defined as MRTHH – MRTHL – MRTLH – MRTLL, where MRT indicates mean response time and the subscripts denote the salience of the features (e.g., HL indicates that the salience level is high for one feature and low for the other). Survivor interaction contrast is similarly defined for the survivor functions level rather than the means level: SHH(t) – SHL(t) – SLH(t) – SLL(t). Townsend and Nozawa (1995) showed that if selective influence holds, different models (assigned with a stopping rule) predict unique combinations of mean and survivor contrasts. Most pertinent to our case is the prediction of a parallel model with a minimum time stopping rule—positive mean interaction contrast and a survivor interaction contrast function that is positive for every t > 0—exactly the pattern exhibited by the participants of the auxiliary experiment.
Supplemental materials: http://dx.doi.org/10.1037/XXXXXXX.supp
Contributor Information
Ami Eidels, Department of Psychological and Brain Sciences, Indiana University.
James T. Townsend, Department of Psychological and Brain Sciences, Indiana University
James R. Pomerantz, Department of Psychology, Rice University
References
- Ashby FG, Townsend JT. Varieties of perceptual independence. Psychological Review. 1986;93:154–179. [PubMed] [Google Scholar]
- Chen L. The topological approach to perceptual organization. Visual Cognition. 2005;12:553–637. [Google Scholar]
- Chen L, Zhang S, Srinivasan MV. Global perception in small brains: Topological pattern recognition in honey bees. Proceedings of the National Academy of Sciences, USA. 2003;100:6884–6889. doi: 10.1073/pnas.0732090100. [DOI] [PMC free article] [PubMed] [Google Scholar]
- Clark HH, Chase WG. On the process of comparing sentences against pictures. Cognitive Psychology. 1972;3:472–517. [Google Scholar]
- Colonius H, Townsend JT. Activation-state representation of models for the redundant-signals effect. In: Marley AAJ, editor. Choice, decision and measurement: Volume in honor of R Duncan Luce. Mahwah, NJ: Erlbaum; 1997. pp. 245–254. [Google Scholar]
- Diederich A, Colonius H. A further test of the superposition model for the redundant-signals effect in bimodal detection. Perception & Psychophysics. 1991;50:83–85. doi: 10.3758/bf03212207. [DOI] [PubMed] [Google Scholar]
- Duncan J, Humphreys GW. Visual search and stimulus similarity. Psychological Review. 1989;96:433–458. doi: 10.1037/0033-295x.96.3.433. [DOI] [PubMed] [Google Scholar]
- Dzhafarov EN. Process representations and decompositions of response times. In: Marley AAJ, editor. Choice, decision and measurement: Essays in honor of R Duncan Luce. Mahwah, NJ: Erlbaum; 1997. pp. 255–278. [Google Scholar]
- Egeth HE. Parallel versus serial processing in multidimensional stimulus discrimination. Perception & Psychophysics. 1966;1:245–252. [Google Scholar]
- Egeth HE, Dagenbach D. Parallel versus serial processing in visual search: Further evidence from subadditive effects of visual quality. Journal of Experimental Psychology: Human Perception and Performance. 1991;17:550–559. doi: 10.1037//0096-1523.17.2.551. [DOI] [PubMed] [Google Scholar]
- Feintuch U, Cohen A. Visual attention and coactivation of response decisions for features from different dimensions. Psychological Science. 2002;13:361–369. doi: 10.1111/1467-9280.00465. [DOI] [PubMed] [Google Scholar]
- Forster KI, Forster JC. DMDX: A Windows display program with milliseconds accuracy. Behavior Research Methods and Instrumentation. 2003;35:116–124. doi: 10.3758/bf03195503. [DOI] [PubMed] [Google Scholar]
- Fournier LR, Eriksen CW. Coactivation in the perception of redundant targets. Journal of Experimental Psychology: Human Perception and Performance. 1990;16:538–550. doi: 10.1037//0096-1523.16.3.538. [DOI] [PubMed] [Google Scholar]
- Garner WR. Good patterns have few alternatives. American Scientist. 1970;58:34–42. [PubMed] [Google Scholar]
- Garner WR. The processing of information and structure. Potomac, MD: Erlbaum; 1974. [Google Scholar]
- Garner WR. Selective attention to attributes and stimuli. Journal of Experimental Psychology: General. 1978;107:287–308. doi: 10.1037//0096-3445.107.3.287. [DOI] [PubMed] [Google Scholar]
- Geisler WS. Ideal observer analysis. In: Chalupa L, Werner J, editors. The visual neurosciences. Boston: MIT Press; 2003. pp. 825–837. [Google Scholar]
- Grice GR, Canham L, Boroughs JM. Combination rule for redundant target information in reaction time tasks with divided attention. Perception & Psychophysics. 1984;35:451–463. doi: 10.3758/bf03203922. [DOI] [PubMed] [Google Scholar]
- Grice GR, Canham L, Gwynne JW. Absence of a redundant-signals effect in a reaction time task with divided attention. Perception & Psychophysics. 1984;36:565–570. doi: 10.3758/bf03207517. [DOI] [PubMed] [Google Scholar]
- Miller J. Multidimensional same-different judgments: Evidence against independent comparisons of dimensions. Journal of Experimental Psychology: Human Perception and Performance. 1978;4:411–422. doi: 10.1037//0096-1523.4.3.411. [DOI] [PubMed] [Google Scholar]
- Miller J. Divided attention: Evidence for coactivation with redundant signals. Cognitive Psychology. 1982;14:247–279. doi: 10.1016/0010-0285(82)90010-x. [DOI] [PubMed] [Google Scholar]
- Miller J. Channel interaction and the redundant target effect in bimodal divided attention task. Journal of Experimental Psychology: Human Perception and Performance. 1991;17:160–169. doi: 10.1037//0096-1523.17.1.160. [DOI] [PubMed] [Google Scholar]
- Mordkoff JT, Yantis S. An interactive race model of divided attention. Journal of Experimental Psychology: Human Perception and Performance. 1991;17:520–538. doi: 10.1037//0096-1523.17.2.520. [DOI] [PubMed] [Google Scholar]
- Munkres JR. Elements of algebraic topology. Cambridge, MA: Perseus Publishing; 1993. [Google Scholar]
- Palmer SE. The effects of contextual scenes on the identification of objects. Memory & Cognition. 1975;3:519–526. doi: 10.3758/BF03197524. [DOI] [PubMed] [Google Scholar]
- Palmer SE. Vision science: Photons to phenomenology. Cambridge, MA: MIT Press; 1999. [Google Scholar]
- Pomerantz JR. Wholes, holes, and basic features in vision. TRENDS in Cognitive Science. 2003;7:471–473. doi: 10.1016/j.tics.2003.09.007. [DOI] [PubMed] [Google Scholar]
- Pomerantz JR, Agrawal A, Jewell SW, Jeong M, Khan H, Lozano SC. Contour grouping inside and outside of facial contexts. Acta Psychologica. 2003;114:245–271. doi: 10.1016/j.actpsy.2003.08.004. [DOI] [PubMed] [Google Scholar]
- Pomerantz JR, Sager LC, Stoever RJ. Perception of wholes and of their component parts: Some configural superiority effects. Journal of Experimental Psychology: Human Perception and Performance. 1977;3:422–435. [PubMed] [Google Scholar]
- Raab DH. Statistical facilitation of simple reaction times. Transactions of the New York Academy of Sciences. 1962;24:574–590. doi: 10.1111/j.2164-0947.1962.tb01433.x. [DOI] [PubMed] [Google Scholar]
- Reicher GM. Perceptual recognition as a function of meaning-fulness of stimulus material. Journal of Experimental Psychology. 1969;81:275–280. doi: 10.1037/h0027768. [DOI] [PubMed] [Google Scholar]
- Rouder JN. Modeling the effects of choice-set size on the processing of letters and words. Psychological Review. 2004;111:80–93. doi: 10.1037/0033-295X.111.1.80. [DOI] [PubMed] [Google Scholar]
- Schweickert R. A critical path generalization of the additive factor method analysis of the Stroop task. Journal of Mathematical Psychology. 1978;18:105–139. [Google Scholar]
- Schweickert R, Giorgini M, Dzhafarov E. Selective influence and response time cumulative distribution functions in serial-parallel task networks. Journal of Mathematical Psychology. 2000;44:504–535. doi: 10.1006/jmps.1999.1268. [DOI] [PubMed] [Google Scholar]
- Schweickert R, Townsend JT. A trichotomy method: Interactions of factors prolonging sequential and concurrent mental processes in stochastic PERT networks. Journal of Mathematical Psychology. 1989;33:328–347. [Google Scholar]
- Simon JR. Reactions toward the source of stimulation. Journal of Experimental Psychology. 1969;81:174–176. doi: 10.1037/h0027448. [DOI] [PubMed] [Google Scholar]
- Sternberg S. Memory scanning: Mental processes revealed by reaction-time experiments. American Scientist. 1969;4:421–457. [PubMed] [Google Scholar]
- Tanaka JW, Farah MJ. Parts and wholes in face recognition. Quarterly Journal of Experimental Psychology. 1993;46(A):225–245. doi: 10.1080/14640749308401045. [DOI] [PubMed] [Google Scholar]
- Tanaka JW, Farah MJ. The holistic representation of faces. In: Peterson MJ, Rhodes G, editors. Perception of faces, objects, and scenes: Analytic and holistic processes. New York: Oxford University Press; 2003. pp. 53–74. [Google Scholar]
- Tanaka JW, Sengco JA. Features and their configuration in face recognition. Memory & Cognition. 1997;25:583–592. doi: 10.3758/bf03211301. [DOI] [PubMed] [Google Scholar]
- Townsend JT. Theoretical analysis of an alphabetic confusion matrix. Perception & Psychophysics. 1971;9:40–50. [Google Scholar]
- Townsend JT. Uncovering mental processes with factorial experiments. Journal of Mathematical Psychology. 1984;28:363–400. [Google Scholar]
- Townsend JT, Ashby FG. An experimental test of contemporary mathematical models of visual letter recognition. Journal of Experimental Psychology: Human Perception and Performance. 1982;8:834–864. doi: 10.1037//0096-1523.8.6.834. [DOI] [PubMed] [Google Scholar]
- Townsend JT, Ashby FG. The stochastic modeling of elementary psychological processes. Cambridge, England: Cambridge University Press; 1983. [Google Scholar]
- Townsend JT, Colonius H. Parallel processing response times and experimental determination of the stopping rule. Journal of Mathematical Psychology. 1997;41:392–397. doi: 10.1006/jmps.1997.1185. [DOI] [PubMed] [Google Scholar]
- Townsend JT, Landon DE. Mathematical models of recognition and confusion in psychology. Mathematical Social Sciences. 1983;4:25–71. [Google Scholar]
- Townsend JT, Nozawa G. Strong evidence for parallel processing with simple dot stimuli. Paper presented at the Annual Meeting of Psychonomic Society; Chicago. 1988. Nov, [Google Scholar]
- Townsend JT, Nozawa G. Spatio-temporal properties of elementary perception: An investigation of parallel, serial, and coactive theories. Journal of Mathematical Psychology. 1995;39:321–359. [Google Scholar]
- Townsend JT, Nozawa G. Serial exhaustive models can violate the race inequality: Implications for architecture and capacity. Psychological Review. 1997;104:595–602. [Google Scholar]
- Townsend JT, Schweickert R. Toward the trichotomy method: Laying the foundation of stochastic mental networks. Journal of Mathematical Psychology. 1989;33:309–327. [Google Scholar]
- Townsend JT, Thomas R. Stochastic dependencies in parallel and serial models: Effects on systems factorial interactions. Journal of Mathematical Psychology. 1994;38:1–34. [Google Scholar]
- Townsend JT, Wenger MJ. A theory of interactive parallel processing: New capacity measures and predictions for a response time inequality series. Psychological Review. 2004;111:1003–1035. doi: 10.1037/0033-295X.111.4.1003. [DOI] [PubMed] [Google Scholar]
- Treisman A, Gelade G. A feature integration theory of attention. Cognitive Psychology. 1980;12:97–136. doi: 10.1016/0010-0285(80)90005-5. [DOI] [PubMed] [Google Scholar]
- Treisman A, Souther J. Search asymmetry: A diagnostic for preattentive processing of separable features. Journal of Experimental Psychology: General. 1985;114:285–310. doi: 10.1037//0096-3445.114.3.285. [DOI] [PubMed] [Google Scholar]
- Van der Heijden AH, Schreuder R, Maris L, Neerincx M. Some evidence for correlated separate activation in a simple letter-detection task. Perception & Psychophysics. 1984;36:577–585. doi: 10.3758/bf03207519. [DOI] [PubMed] [Google Scholar]
- Van Zandt T, Townsend JT. Self-terminating vs. exhaustive processes in rapid visual, and memory search: An evaluative review. Perception & Psychophysics. 1993;53:563–580. doi: 10.3758/bf03205204. [DOI] [PubMed] [Google Scholar]
- Wenger MJ, Townsend JT. Basic response time tools for studying general processing capacity in attention, perception, and cognition. Journal of General Psychology. 2000;127:67–99. doi: 10.1080/00221300009598571. [DOI] [PubMed] [Google Scholar]
- Wenger MJ, Townsend JT. Faces as Gestalt stimuli: Process characteristics. In: Wenger MJ, Townsend JT, editors. Computational, geometric, and process perspectives on facial cognition: Contexts and challenges. Mahwah, NJ: Erlbaum; 2001. pp. 229–284. [Google Scholar]
- Wolfe JM. Guided search 2.0: A revised model for visual search. Psychonomic Bulletin & Review. 1994;1:202–238. doi: 10.3758/BF03200774. [DOI] [PubMed] [Google Scholar]