Abstract
Most statistical reconstruction methods for emission tomography are designed for data modeled as conditionally independent Poisson variates. In reality, due to scanner detectors, electronics and data processing, correlations are introduced into the data resulting in dependent variates. In general, these correlations are ignored because they are difficult to measure and lead to computationally challenging statistical reconstruction algorithms. This work addresses the second concern, seeking to simplify the reconstruction of correlated data and provide a more precise image estimate than the conventional independent methods. In general, correlated variates have a large non-diagonal covariance matrix that is computationally challenging to use as a weighting term in a reconstruction algorithm. This work proposes two methods to simplify the use of a non-diagonal covariance matrix as the weighting term by (a) limiting the number of dimensions in which the correlations are modeled and (b) adopting flexible, yet computationally tractable, models for correlation structure. We apply and test these methods with simple simulated PET data and data processed with the Fourier rebinning algorithm which include the one-dimensional correlations in the axial direction and the two-dimensional correlations in the transaxial directions. The methods are incorporated into a penalized weighted least-squares 2D reconstruction and compared with a conventional maximum a posteriori approach.
1. Introduction
Conventional statistical image reconstruction of tomographic data is based on the assumption that the measurements conditioned on the image are an independent random process (Hudson and Larkin 1994, Fessler and Hero 1995). Recent developments in data processing and technologies can lead to dependent data sets. For instance, basis sinogram decomposition from dual energy CT (Alvarez and Macovski 1976, Elbakri and Fessler 2003) results in two data sets with significant correlations. Also, confidence weighting used in the time-of-flight PET reconstruction (Snyder et al 1981, Lewellen 1998) can lead to correlations in the time dimension. In emission applications, detector deadtime and event pileup causes dependences amongst detection bins. In many tomographic applications, the processing or physical effect that introduces correlations into the measurements can be viewed as a linear process causing deviations to both the first-order and second-order statistics.
Improving the model of the first-order statistics, which often appear as the conditional mean term in statistical reconstructions, reduces the bias of the estimator. Multiple researchers have addressed the first-order influences in tomographic systems by improving the system model through the inclusion of effects such as detector response and attenuation (Frese et al 2003, Qi et al 1998, Stickel and Cherry 2005). These previously modeled effects in general do not introduce correlations into the data.
Knowledge of the first-order influence of a correlating process can lead to an improved model of the second-order statistics. The use of more accurate second-order statistics, which often appear in the weighting term in statistical reconstructions, reduces the variance of the estimator. Correlated data have a large non-diagonal covariance matrix which needs to be inverted for use as a weighting term. The inversion is often computationally infeasible due to the size of data sets. This work explores practical methods for including correlations in the statistical model used for iterative image reconstruction. These practical methods reduce the complexity by (a) including correlations in a subset of the dimensions of the data space and (b) adopting a computationally advantageous model for the correlation structure.
In a previous work, we presented a simplification of the correlating structure using a Markov random field (MRF) assumption and suggested a method for using this assumption in iterative reconstruction (Alessio et al 2003). In an effort to offer a comprehensive strategy for dealing with correlations, this work reiterates this MRF simplification along with a separate simplification using correlations limited to a subset of the dimensions of the data.
We test the proposed methods with a hypothetical simulation study and with fully 3D PET data after Fourier rebinning (FORE) (Defrise et al 1997). In the simulation study, we introduce a known correlation structure to tomographic data to show the validity of the proposed methods. We also build upon our previously presented models of the FORE process to highlight the bias and variance reductions in the reconstruction of FORE data. FORE reduces fully 3D PET data into a series of the 2D transaxial slices. This process changes the statistics of the data in both the transaxial and axial directions. Our past work explored the transaxial influence of FORE (Alessio et al 2003). This research builds upon previous results through its exploration of FORE’s effects in the axial direction.
We present the background and general optimization in section 2. Then, we detail the two methods for simplifying reconstruction. Finally, we discuss the evaluation methods and present results to support the efficacy of the proposed methods for other applications when there is knowledge of data correlations.
2. Statistical framework
2.1. Background
Tomographic reconstruction is an inverse boundary value problem often represented in the form
The known measurements y in the presence of noise n are used to determine the unknown image x. The system matrix P transforms the image domain into the measurement domain. Many statistical estimators have been proposed for x ranging from methods that assume a complete conditional probability density function of y and seek the maximum likelihood value of x (Shepp and Vardi 1982, Hudson and Larkin 1994), to methods that rely on only first-order statistics (the conditional mean of y) (Gordon et al 1970, Herman and Meyer 1993).
In this work, we assume knowledge of the first- and second-order statistics of the measurements conditioned on the image. This information is well incorporated into the weighted least-squares (WLS) similarity measure
| (1) |
where the system matrix P times x provides the conditional mean of the data and W is the weighting matrix, which can incorporate second-order statistics. The weighting matrix increases the influence of reliable individual values, yi, and decreases the influence of less reliable data. When dealing with independent data, W contains diagonal entries wi inversely related to the variance of the measurement yi. For this case, the WLS estimator provides a linear, minimum variance, unbiased estimator.
In actuality, it can be difficult to estimate the variance of each measurement and several options have been explored (Fessler 1994, Anderson et al 1997, Clinthorne 1992). All common variations assume conditionally independent measurements, allowing for the use of simple, diagonal weighting matrices. For correlated data, the minimizer of (1) provides the minimum variance, unbiased, linear estimate when W is the inverse of the full covariance matrix of the data (Gauss–Markov theorem (Kay 1993)). The covariance matrix offers knowledge of the second-order statistics and leads to an estimator with less variance.
Correlation in data error is typically undesirable. When correlations exist, it is beneficial to use this information as illustrated in the extreme case of two variates of identical mean, with correlation coefficient of −1. The average of the two observations as an estimate of the mean has the MSE equal to zero. For a more realistic example, assume we have a vector of measurements ye of size 10 × 1. These measurements are generated from a 10 × 1 system matrix, Pe, and contain Gaussian noise. The covariance matrix of the data, K̃e, is shown in figure 1. For comparison, the matrix using just the diagonal (variance) terms, K̂e, also appears in figure 1. The inverse of these two matrices are used in two different WLS estimators of the scalar value xe (the true value of xe is 2).
Figure 1.
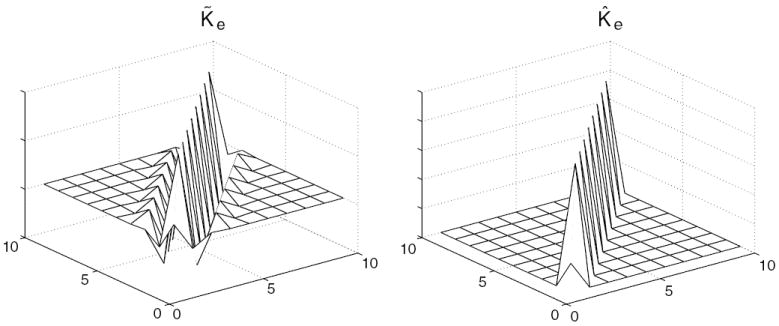
Sample covariance matrices of a simple one-dimensional example. K̃e includes correlations amongst measurements and K̂e assumes independent data.
Figure 2 plots the objective functions, ΦWLS(x), using both full covariance and the diagonal matrix. The presence of nonzero correlation information leads to a log-likelihood function with greater curvature and greater Fisher information, meaning lower variance in the estimator. The Fisher information for the full covariance matrix in this example is 500, as opposed to 200 for the independent data. This results in a Cramer–Rao lower bound, or minimum achievable variance, of 60% less with nonzero correlations.
Figure 2.
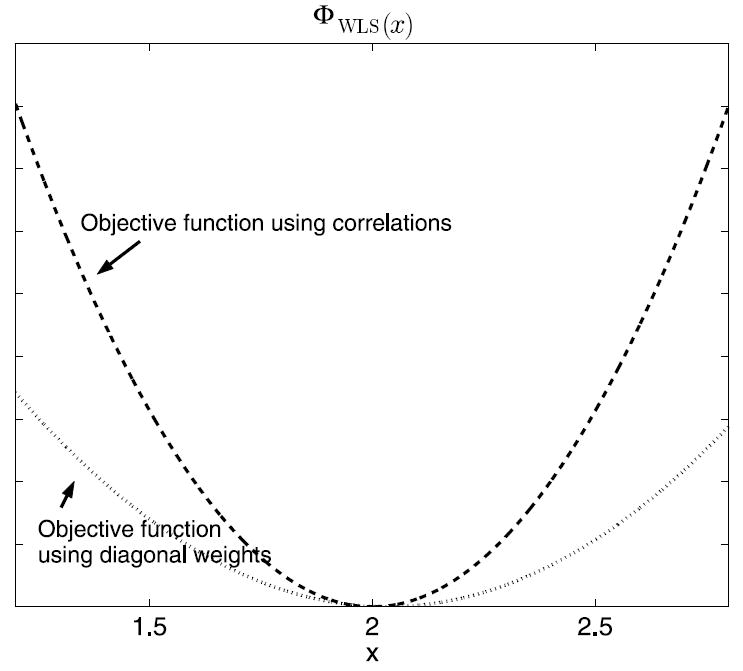
Objective functions for WLS estimators using full covariance matrix (dashed) and diagonal matrix (dotted).
The improvements illustrated in this one-dimensional example hold also in multidimensional problems. However, the magnitude of improvement realized in moving from an estimator based on the uncorrelated data to the one designed for the true covariance is a distinct issue from the improved error bound. We previously presented an argument for including correlations in iterative reconstructions (Alessio et al 2003) and showed that the mean-square error of the estimate of the entire image can be reduced appreciably as more off-diagonal correlation terms are included in the covariance matrix of the applied estimator.
2.2. Including correlations in reconstructions
Conditionally independent data, ŷ, represent a process assuming that each recorded count depends only on the originating object and is independent of all other counts. This assumption is usually parameterized such that the mean of the data conditioned on the image is the forward projection of the image,
| (2) |
Suppose some linear process, A, is responsible for changing the independent data into the dependent data, ỹ, changing the conditional mean as
| (3) |
Second-order statistics are influenced in a similar manner, with K̂ representing the diagonal covariance matrix of the independent data. The correlated data will have a covariance matrix of the form
| (4) |
Should A represent shift-invariant convolution, Fourier methods, for example, may be used to pre-whiten the data and/or facilitate computation of gradients of the objective function. In the more general case, though, this non-diagonal matrix is avoided because it poses a major challenge for inversion, leading us to the methods discussed below. In each case, we develop a computationally tractable approximation to the inverse covariance matrix, which is central to the distribution of the sinogram data.
2.3. Implementation scheme
Both of our proposed methods incorporate the modified mean (3) and covariance matrix (4) into the penalized weighted least-squares (PWLS) objective function, which is a regularized extension of (1):
| (5) |
where β is the smoothing parameter controlling the strength of the regularization term. While many optimization algorithms are viable for this objective function, we find and include the gradient terms in a Newton–Raphson algorithm customized for non-quadratic prior terms and perform ‘greedy’ updates of each pixel value (Bouman and Sauer 1996). In all cases, we use the generalized Gaussian MRF (GGMRF) model, G(x), as the regularization term, corresponding to a MRF in its more conventional application in the image domain (Bouman and Sauer 1993). The GGMRF model allows for a non-quadratic penalty term with desirable edge-preserving properties and the log of its density function can be written in the form
| (6) |
where Nj is the neighborhood of pixel xj, bj,k is the coefficient linking pixels j and k and 1 ≤ q ≤ 2 is the parameter that controls the smoothness of the reconstruction. For all of the reconstructions here, we use an 8 pixel neighborhood and set q = 1.8 (non-quadratic penalty), offering a compromise in edge preservation and image smoothness.
As discussed in Bouman and Sauer (1996), this optimization approach deviates from the conventional Newton–Raphson because we only apply the Taylor series approximation to the WLS portion of the PWLS objective and retain the exact expression of the penalty term.When θ1 and θ2 are the first and second derivatives of the WLS objective function (first half of (equation 5)) evaluated for the current pixel value , the new pixel value is given by
| (7) |
This equation is solved by analytically calculating its derivative and then numerically computing the derivative’s root. We use a half-interval search to find the root of
| (8) |
The WLS objective implicitly assumes a Gaussian distribution of the data, or, when the weighting terms are estimated from data itself, this objective uses a quadratic approximation of log-likelihood of the data. In conventional reconstruction applications, without a correlating process, the collected data is Poisson distributed, which is well approximated by this quadratic function with high count data sets. In our application, we assume only a correlating process and some understanding of the covariance structure.
The effect of a linear operation A on the first-order statistics appears in the modified system matrix, P̃. This is incorporated into the reconstruction algorithm as a convolution operation during the pre-computation of the system matrix or during each forward projection of the current image estimates.
3. Method 1: reducing dimensionality of correlations, ΦRD
The challenge of dealing with correlated data can be simplified if the correlations, introduced by A, are confined to a subset of the dimensions of the projection data. For instance, whole-body 2D PET data contain three-dimensional information, but correlations may be primarily in the axial direction (as discussed in section 5.2) or among only radial bins.
The correlating influence here will be assumed to be a linear transformation A of the conditionally independent data ỹ = Aŷ. The modified covariance matrix can be derived from the idealized weighting matrix, K̂. The matrix K̂ is diagonal with ith entry , an estimate of the variance of the ith data entry, ŷi. Provided appropriate indexing is used, with sets of correlated data grouped, A is a block diagonal matrix of the form
In this case, the inverse may be written as
| (9) |
with the inverse of K̂ trivial and inverse of A
| (10) |
If all the {Ai} are equal, K̃−1 reduces to the inverse of a diagonal matrix and a block diagonal matrix, resulting in the need to compute only the inverse of A1.
Complexity reduction is evident with an example three-dimensional data set with (N1, N2, N3) bins in each of its dimensions. If correlations exist in dimensions 1 and 2 only, the data can be reorganized such that the inversion of the full weighting matrix only requires the inversion of a single (N1 * N2) × (N1 * N2) matrix. If the correlations only exist in the first dimension, then the inversion of the weighting matrix only requires the inversion of a single N1 × N1 matrix.
The inversion of the weighting matrix often causes an intractable computational problem, particularly for multi-dimensional correlations. For example, in a relatively small 2D PET data set with 150 × 140 radial × azimuthal bins in the transaxial direction and 35 axial planes, if correlations exist amongst all entries, one would need to store and invert a 735 000 × 735 000 matrix. On the other hand, if stationary correlations existed among only radial bins, only a single 150 × 150 matrix would need to be inverted.
3.1. Implementation of reduced dimensionality of correlations simplification
When the dimensionality of the correlations can be reduced, the reconstruction requires the inversion of smaller matrices. These inversions are performed only once and then incorporated into the first and second derivative terms in (7). For WLS with the weighting matrix W equal to the inverse of the covariance matrix found from the simplification discussed in section 3, the derivatives are
| (11) |
and
| (12) |
The sum over Hi represents the sum over all nonzero entries in the inverse of the covariance matrix at row/datum i. The goal of this simplification is to make the inverse of the covariance matrix numerically feasible and to reduce the size of Hi to reduce the computation in the optimization. With the simplification of a block diagonal covariance matrix, the inverse covariance matrix will have nonzero entries only in the block diagonal terms. When this simplification is used, we denote the objective function and method as ΦRD.
4. Method 2: using Markov random fields, ΦMRF
The solution of an inverse problem involving correlated data can be simplified by employing a model which is general enough to capture the essence of the data’s statistics, but which is amenable to numerical optimization. In Bayesian image estimation, the Markov random field has been proven to possess both these attributes as an a priori model of image data (Besag 1974, Geman and Geman 1984). These processes are characterized by the independence of a given datum from all of the more distant sites, when conditioned on nearest neighbors. This property offers clear computational advantages in sequential optimization, allowing low-dimensional local vectors in calculations, regardless of the spatial extent of correlation.
In the present case, we carry this type of model and its advantages into the sinogram domain. Sinograms have previously been modeled somewhat similar to this manner (Prince and Willsky 1988), but with the goal of the Bayesian estimation of the sinogram, implicitly including the effects of an a priori distribution for the underlying image. Here, we apply the MRF model to the distribution of the correlated data, conditioned on the unknown image, x, in order to capture the effects of A. A second, distinct model may be used for x. We assume that the data, conditioned on the image, is a Markov random field with probability density f (y|x).
A fundamental property of the Markov random field model is its equivalence to a Gibbs distribution, which in our case is assumed to be expressible in the form
| (13) |
with αi and Z as normalization constants, and Ni as the spatial neighborhood of datum i of a size depending on the order of the Markov model.
For a given datum measurement yi and its neighbors Ni = {ni,1, … , ni,B}, we need to find the distribution
| (14) |
We assume the data in a datum’s neighborhood, conditioned on x, has a density which may be represented by
| (15) |
and
| (16) |
where KNi is an estimated B × B covariance matrix of the neighbors and Kv is an estimated covariance matrix of the neighbors and yi. The data may be approximated as Gaussian, in which case the K matrices are constant with respect to the data, or as Poisson, in which case K may be viewed as a function of the data in a quadratic approximation of the Poisson log-likelihood; in either case the following formulae are identical.
Substituting (15) and (16) into (14) and simplifying leads to
| (17) |
where KyiN is the B × 1 vector of the covariance of yi and its neighbors and . Under the conditional Markov assumption, ignoring constants which do not affect the estimate of x, the approximation of the likelihood function simplifies to the form
| (18) |
where is a 1 × B vector, is the forward projection to projection i of M total projections and is a B × 1 vector containing the forward projection to the neighbors of projection i. In the previous and following equations, the system matrix is referred to with the boldface letter P when it is a matrix subset of P, with P when it is a vector subset, and with p when it is a single entry from P.
This formulation reduces the inverse of a large covariance matrix to the practical problem of inverting MB × B matrices. The size of the correlated neighborhood, B, can be varied to trade off between variance in the estimate and overall computational burden. When the data conditioned on the image is a Markov random field, our expression for the data’s distribution is proportional to the true distribution when the neighborhood is at least as large as the order of the process. We have no guarantee that this approximate form of the data’s full inverse covariance matrix, as expressed implicitly in (18), converges to the precise values even as B becomes arbitrarily large. However, our hope is to make significant gain in estimator quality with this tractable approximation.
4.1. Implementation of the Markov random field simplification
When the Markov random field assumption is applied to a covariance neighborhood, the log of (18) leads to the objective function
| (19) |
Many of the terms in (19) need to be computed only once. The derivatives required to optimize (19) are
| (20) |
| (21) |
As with the WLS derivatives, these are incorporated into (7) to find image estimates in a penalized reconstruction algorithm. It should be noted that for independent data with no cross correlation, = 0, h = i and 1/Qi = Wii, the WLS and MRF simplifications lead to identical derivative terms.
5. Evaluation methods
We applied the method with reduced dimensionality (ΦRD) and the method with the MRF simplification (ΦMRF) to two applications.
5.1. Simulations with known covariance
We tested the proposed methods with a simulation study in which the exact correlation structure is known. In an effort to compare and contrast the use of a full covariance matrix, portions of the covariance matrix, and no cross-correlations, we generated relatively small data sets and reconstruct to small images. We simulated a constant activity cylindrical phantom (27.5 cm diameter in a 55 cm field of view scanner) and generated a single set of 2D projections, ys (30 radial bins × 20 angle bins) through this phantom. Poisson noise was added to the projections to generate ŷs as ŷs = Poisson{ys} with 2 × 10⁴ total counts. At this stage, the projections were an independent Poisson process.
Then, a data processing step or physical phenomena introduced correlations into the projections. We modeled the correlating step as a linear filter operation (As) which blurs in the radial bin and azimuthal angle dimension. This filter operation was a series of unique non-symmetric 2D Gaussian functions for each projection bin with full width at half maximum (FWHM) in each dimension drawn from the independent uniform distribution of values from 0 to 4 bins. The dependent projections ỹs = Asŷs. The covariance matrix of the dependent projections was formed as , where Kys was a diagonal matrix with diagonal values equal to the noise-free projections ys. Figure 3 presents a portion of the covariance matrix, Kỹs. Even with a small data set size, the covariance matrix contained 600 × 600 entries.
Figure 3.
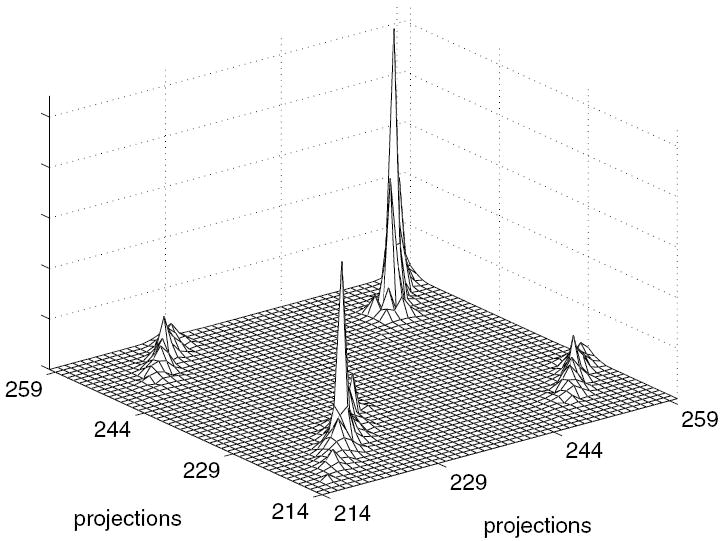
Block diagonal portion of the covariance matrix, Kŷs for the covariance known simulation study.
We present results from reconstructions that used (i) the entire covariance matrix, (ii) only correlations in the radial bins with the ΦRD(x) objective, (iii) correlations using the closest neighbors in both radial and angle bins and the ΦMRF(x) objective and (iv) no correlation information. In all cases, in order to assess the value of covariance information in the reconstruction, we used the modified system matrix (P̃ = AsP) to account for the first-order effects of the correlating process. We generated 20 independent noise realizations and analyzed the variance across multiple reconstructions of 20 × 20 pixel images.
5.2. Application to FORE
In an effort to further test the efficacy of the proposed approaches, we turn to one practical application, FORE PET data. In the conventional 2D PET acquisition, septa are positioned between adjacent rings of detectors, effectively restricting photon lines of response to single planes. In fully 3D PET data acquisition, the septa are removed and photons are collected from all oblique planes resulting in an increased sensitivity. Originally, fully 3D PET reconstruction was computationally prohibitive. Rebinning algorithms, such as FORE, were proposed to reduce high sensitivity, fully 3D data, to conventional 2D data sets prior to reconstruction. As computation power has improved, manufacturers are performing the more accurate fully 3D reconstruction to avoid the approximations taken with rebinning algorithms (Jones et al 2003, Iatrou et al 2004).
Fully 3D PET data are well modeled as conditionally independent Poisson variables. After FORE, the data is no longer Poisson because several multiplicative corrections (attenuation, efficiencies, etc) are applied in the fully 3D domain and the rebinning process consists of a scaled linear combination of oblique planes. We tested the proposed methods using the correlations in only one or two dimensions in order to simplify the correlation models.
We simulated data from the phantom shown in figure 4 containing four hot and four cold features in a torso with an activity contrast ratio of 0.5 (4:2:1, hot:background:cold). Line integrals through this phantom were organized into oblique sinogram data for a scanner with a geometry similar to the GE Advance (DeGrado et al 1994). We simulated 20 fully 3D noise realizations of 100 million counts, along with 20 noise realizations of the phantom without features, to compare contrast and noise. These data sets were Fourier rebinned into 35 2D planes prior to reconstruction.
Figure 4.
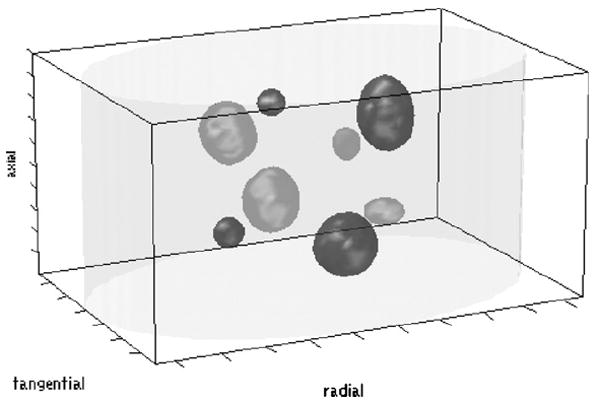
The digital phantom used for contrast and noise comparison of methods applied to FORE data.
We compared the proposed methods with a conventional 2D maximum a posteriori (MAP) algorithm. The MAP algorithm was based on an independent Poisson distribution (not weighted least-squares). The MAP method and the proposed methods used the same optimization code and the prior term. We began each reconstruction with a low-frequency initial image from a multi-resolution scheme (Frese et al 2003) and all of the methods have a similar convergence rate reaching a solution in nine iterations. In this work, a method is ‘converged’ when an estimate reduces the objective value by 0.01% of the maximum difference between objective values from prior, sequential estimates.
The contrast of feature i was defined as
| (22) |
where is the mean of the voxels in the feature reconstruction or in the background reconstruction (data simulated without features). The voxels within a given feature were fully inscribed in the boundaries of the feature. In this study, the noise metric was the standard deviation in the means of the background, (Liu et al 2001).
These methods were also applied to measured data from the IndyPETII small-animal scanner (Frese et al 2003). We imaged a Derenzo-like, hot phantom consisting of a block of Plexiglas with different size holes (4.0–1.6 mm diameter) filled with F18. The fully 3D data set contained 222 oblique planes of 279 × 360 sinograms.
5.2.1. ΦRD for the axial dimension
We first reduced the dimensionality of the correlations to just the axial direction. The FORE algorithm interpolates frequency information into rebinned planes based on their location in the frequency space. Therefore, the interpolation effect on the data, and consequently the influence on the first- and second-order statistics, would be best understood in the frequency space. Incorporating a frequency connection amongst planes into an objective function would complicate the optimization. We propose a simple method for approximating the influence of FORE in the axial dimension that states that the rebinned data are equivalent to a frequency-independent blurring of the conventional 2D data. That is, for the conventional 2D planes indexed by za, and a rebinned plane at zb, the axial approximation is expressed as
| (23) |
where s is the radial position and ϕ is the angle in the rebinned sinogram ỹ2D. This matrix, H, could also be viewed as a description of the linear blurring extent of FORE in the axial direction. ŷ2D is the ideal unblurred rebinned 2D data. In other words, ŷ2D represents data that has gone through an ideal rebinning transformation that places each 3D data point correctly in its 2D location or locations with independent errors.
In order to find this axial approximation, we use FORE kernels to express the FORE algorithm in the space domain. The axial effect is approximated by adding contributing FORE kernels to find the percentage of a given direct plane from neighboring planes. Figure 5 displays H for an 18 ring scanner. We used this approximation in the previous work to try to deconvolve the axial blurring from FORE prior to reconstruction (Alessio et al 2006).
Figure 5.
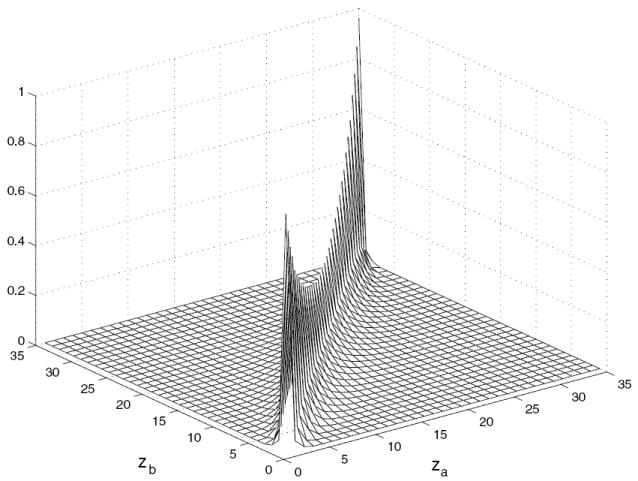
Axial relationship, H, for the 18 ring (35 plane) scanner.
We used this relationship linking rebinned plane za with rebinned plane zb in the reduced dimensionality simplification method discussed in section 3. Specifically, H can be substituted for A in (3) to find the modified projection matrix for finding the conditional mean at each iteration. The use of this modified projection matrix in the reconstruction is termed ‘Axial-Mean’. Likewise, H can be used in (4) to find the covariance matrix; the inversion of the entire covariance matrix will only require the inversion of a single smaller matrix the size of H. The use of the improved covariance matrix in ΦRD in the reconstruction is termed ‘Axial-Cov’.
5.2.2. ΦMRF for the transaxial dimensions
FORE influences the mean and covariance of measurements in each transaxial rebinned slice. In Alessio et al (2003), we presented this approach for estimating and using the transaxial correlations in FORE rebinned data. We used FORE kernels as the blurring kernel in (equation 3) to modify the projection matrix. The kernel blurs among radial and angular bins in our approach is termed ‘Trans-Mean’. We also use the FORE kernels to compute the complete covariance matrix of rebinned data, but store only neighboring entries as needed for the likelihood function (18). In essence, we assume that the FORE rebinned measurements conditioned on the image, are a Markov random field as discussed in section 4.
Figure 6 shows a portion of the complete covariance matrix for a rebinned sinogram when the data is organized first by radial bins and then angular bins effectively showing three angles worth of information. This figure reveals that the FORE data are no longer independent, containing energy at entries off the diagonal. Adjacent radial bins are negatively correlated while adjacent angular bins are positively correlated. To limit complexity, we use only the eight closest neighbors (B = 8) in the calculation of the ΦMRF-likelihood function at each step in the method termed ‘Trans-Cov’.
Figure 6.

Portion of the transaxial 2D covariance matrix for a 70 × 90 FORE rebinned sinogram. Neighboring radial bins occur directly off the diagonal, while neighboring angular bins occur 70 points away from the diagonal.
6. Results
6.1. Simulations with known covariance
Table 1 compares the methods in terms of bias and mean-square error. The per cent bias column lists the average across the 20 realizations of the spatial mean of the difference between the true phantom and each reconstructed image divided by the true phantom. The MSE columns list the average across realizations of the mean-square error of each reconstruction and incorporates both first- and second-order errors into a single figure of merit. For context, the true value in arbitrary units of the activity region is 10. The bias is influenced by first-order statistics. As expected, the use of more correlation information does not influence the first-order statistics of the estimates and therefore does not influence the bias of these estimators. The use of additional correlation information does change the second-order statistics and reduce the variance of the estimators as reflected in the MSE values.
Table 1.
Comparison of bias and mean-square error in reconstructions from simulated measurements of known covariance. Each method used a different number of correlated variables and the average (standard deviation) was evaluated over 20 realizations
| Method | % Bias in entire image | MSE in entire image | MSE in activity region |
|---|---|---|---|
| ΦRD: full covariance matrix | 1.7 (1.3) | 12.4 (1.9) | 31.5 (8.0) |
| ΦRD: radial bins only | 3.3 (2.1) | 12.6 (2.0) | 31.8 (12.2) |
| ΦMRF: 48 closest neighbors | 2.8 (2.4) | 17.0 (2.4) | 97.7 (24.3) |
| ΦMRF: 8 closest neighbors | 2.9 (1.8) | 18.4 (2.8) | 108.4 (31.0) |
| No correlation information | 3.6 (3.0) | 33.6 (5.4) | 218.6 (76.1) |
6.2. FORE reconstructions of simulated data
The values of the objective functions for each iteration of the proposed algorithms appear in figure 7. All methods converge within nine iterations. The comparison of the contrast versus noise for each method appears in figures 8 and 9. The curves are plotted for varying smoothing parameter values, β = [100, 20, 10, 5, 2, 0.5], and each datum point is generated from the mean contrast from 40 independent reconstructions.
Figure 7.
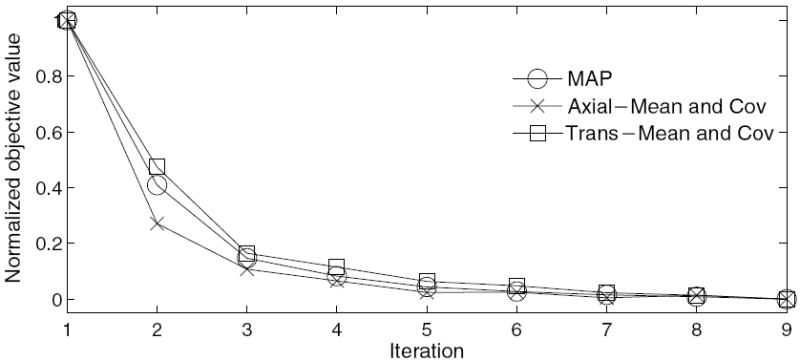
Normalized value of objective function at each iteration of the proposed algorithms.
Figure 8.
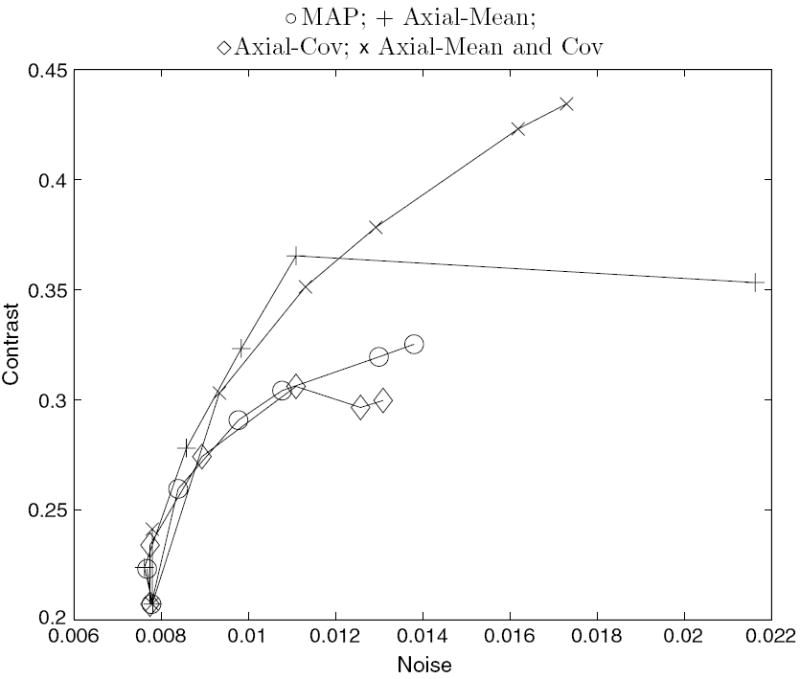
Average contrast versus noise of all features in the simulated phantoms for the axial-modified reconstructions using ΦRD. The curve is formed from varying the smoothing parameter.
Figure 9.
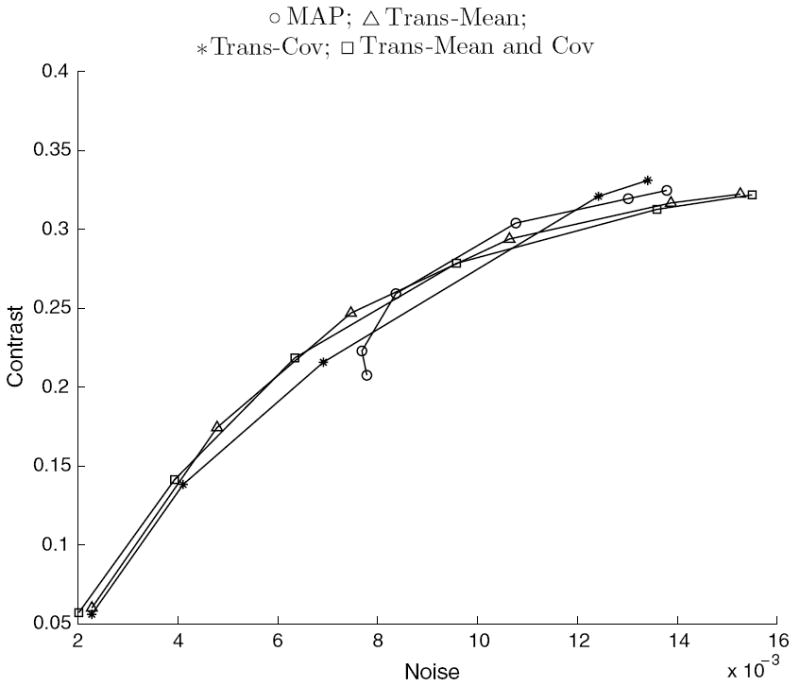
Average contrast versus noise of all features in the simulated phantoms for the transaxial-modified reconstructions using ΦMRF.
The curves for the reduced dimensionality method applied to the axial dimension appear in figure 8. The combination of the first-order influence in the Axial-Mean method and the second-order influence in the Axial-Cov method yields better contrast than all of the other methods at some matched noise levels. The MRF method applied to the transaxial dimensions appear in figure 9, revealing that on average all of the methods perform similarly.
6.3. FORE reconstructions of measured data
Figure 10 displays the reconstructions of measured Derenzo data from one transaxial slice. All methods were run for nine iterations and reached convergence. It is difficult visually to discern differences between the methods. Profiles along a single line in these reconstructions appear in figure 11. Reconstruction using the ΦMRF method which includes transaxial correlations offers slightly less contrast than MAP. On the other hand, the ΦRM method with axial correlations provides increased contrast as expected from the simulation trials.
Figure 10.

A transaxial slice of reconstructions of the Derenzo phantom.
Figure 11.
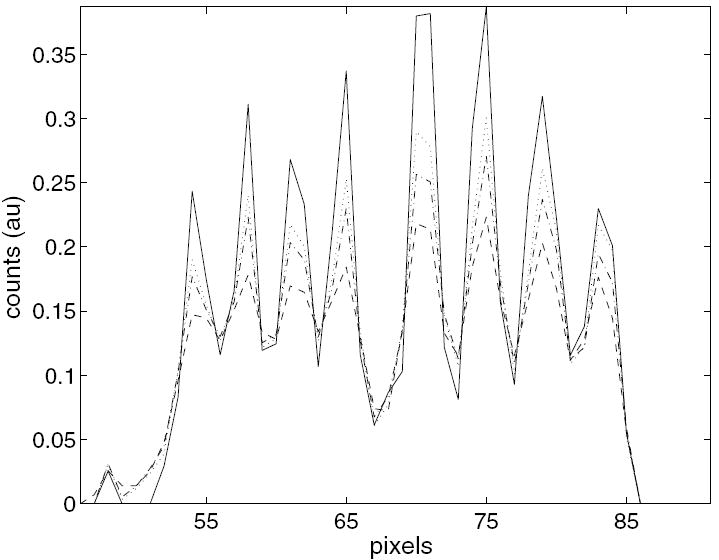
Profile of the horizontal line through reconstructions comparing proposed methods with conventional FBP and MAP. FBP (dashed); MAP (dotted); ΦRD Axial (solid); ΦMRF Trans (dash-dot).
7. Discussion
We proposed and tested two methods for incorporating correlations in statistical reconstruction. Our hypothetical simulation study showed a factor of 7 reduction in the mean-square error in the activity region when the entire covariance matrix is included in the reconstruction. This complete approach is not currently feasible with typical data set sizes; the proposed methods offered reduced computational demands and led to a factor of 2 reduction in variance when only eight correlated neighbors were included. These results showed that using accurate correlation information leads to a more efficient estimator and supports the efficacy of the proposed approaches.
We further tested the methods with dependent FOREPET measurements. Approximations of the one-dimensional correlations in the axial direction provide improvements in terms of contrast for both the empirical and simulated measurements, with gains as much as 23% at matched noise levels. Approximations of the two-dimensional correlations in the transaxial direction applied in the MRF method did not offer any improvements over the conventional 2D iterative reconstruction. This is most likely due to the limited influence of FORE in the transaxial planes. Further inspection of the transaxial approximation showed that FORE introduces little correlation in the transaxial direction because its response is basically flat over the appropriate ‘bowtie’ region in the frequency space of the Radon transform. That is, the transaxial effect of FORE is minimal and using this approximation has little influence on reconstructions. Another explanation for the zero benefit in the transaxial case and the only minor gains in the axial case, is that we had to make several, potentially flawed, assumptions to approximate the correlation structure of FORE data. Given that Fourier rebinning is being overtaken by more accurate fully 3D reconstruction, an exploration of a more accurate correlation model is probably not useful for this application.
Future work will explore methods for finding data covariance matrices in promising PET applications, such as time-of-flight or kinetic parameter imaging (Kamasak et al 2005). In general, it is often challenging to find the covariance structure of data in inverse problems. One possible approach for the above applications is to employ accurate Monte Carlo simulations of the imaging process over multiple realizations to approximate the second-order statistics. Also, linear approximations of the imaging process can be used to find approximate covariance matrices.
8. Conclusion
Methods for incorporating correlations into statistical reconstructions were proposed and successfully implemented. When the correlating process is a linear operation, the first-order influence should be incorporated in the conditional mean term of the projections to reduce the bias of reconstructions. We presented two methods for including the second-order influence to reduce the variance of reconstructions. The first method offers an approach for including correlations in a reduced number of dimensions, effectively reducing the necessary inversion of a large, non-diagonal covariance matrix into the inversion of smaller matrices the size of the number of correlated variables. The second variation assumes a conditionally Markov model for the measurements and reduces the large inversion problem to multiple inversions of smaller matrices. When the correlations are accurately known, these methods offer feasible approaches to improve the efficiency of reconstruction estimators with computational burdens directly related to the number of correlating variables included.
Acknowledgments
This work was supported by the Arthur J Schmitt Foundation, the State of Indiana 21st Century Fund and the National Institutes of Health grants CA74135 and CA115870. We thank the reviewers for constructive comments.
References
- Alessio A, Sauer K, Bouman CA. MAP reconstruction from spatially correlated PET data. IEEE Trans Nucl Sci. 2003;50:1445–51. [Google Scholar]
- Alessio A, Sauer K, Kinahan P. Analytical reconstruction of deconvolved Fourier rebinned PET sinograms. Phys Med Biol. 2006;51:77–93. doi: 10.1088/0031-9155/51/1/006. [DOI] [PubMed] [Google Scholar]
- Alvarez RE, Macovski A. Energy-selective reconstructions in x-ray computerised tomography. Phys Med Biol. 1976;21:733–44. doi: 10.1088/0031-9155/21/5/002. [DOI] [PubMed] [Google Scholar]
- Anderson JM, Mair BA, Rao M, Wu CH. Weighted least-squares reconstruction methods for PET. IEEE Trans Med Imaging. 1997;16:159–65. doi: 10.1109/42.563661. [DOI] [PubMed] [Google Scholar]
- Besag J. Spatial interaction and the statistical analysis of lattice systems. J R Stat Soc B. 1974;36:192–236. [Google Scholar]
- Bouman CA, Sauer K. A generalized Gaussian image model for edge-preserving map estimation. IEEE Trans Image Process. 1993;2:296–310. doi: 10.1109/83.236536. [DOI] [PubMed] [Google Scholar]
- Bouman CA, Sauer K. A unified approach to statistical tomography using coordinate descent optimization. IEEE Trans Image Process. 1996;5:480–92. doi: 10.1109/83.491321. [DOI] [PubMed] [Google Scholar]
- Clinthorne NH. Constrained least-squares vs. maximum likelihood reconstructions for Poisson data. Proc IEEE Nucl Sci Symp and Med Imaging Conf. 1992;2:1237–9. [Google Scholar]
- Defrise M, Kinahan P, Townsend DW, Michel C, Sibomana M, Newport DF. Exact and approximate rebinning algorithms for 3D PET data. IEEE Trans Med Imaging. 1997;16:145–58. doi: 10.1109/42.563660. [DOI] [PubMed] [Google Scholar]
- DeGrado T, Turkington T, Williams J, Stearns C, Hoffman J, Coleman R. Performance characteristics of a whole-body PET scanner. J Nucl Med. 1994;35:1398–406. [PubMed] [Google Scholar]
- Elbakri IA, Fessler J. Segmentation-free statistical image reconstruction for polyenergetic x-ray computed tomography with experimental validation. Phys Med Biol. 2003;48:2453–77. doi: 10.1088/0031-9155/48/15/314. [DOI] [PubMed] [Google Scholar]
- Fessler J. Penalized weighted least-squares image reconstruction for positron emission tomography. IEEE Trans Med Imaging. 1994;13:290–9. doi: 10.1109/42.293921. [DOI] [PubMed] [Google Scholar]
- Fessler J, Hero A. Penalized ML image reconstruction using space-alternating generalized EM algorithms. IEEE Trans Image Process. 1995;4:1417–29. doi: 10.1109/83.465106. [DOI] [PubMed] [Google Scholar]
- Frese T, Rouze N, Bouman CA, Sauer K, Hutchins GD. Quantitative comparison of FBP, EM, and Bayesian reconstruction algorithms for the IndyPET scanner. IEEE Trans Med Imaging. 2003;22:258–76. doi: 10.1109/TMI.2002.808353. [DOI] [PubMed] [Google Scholar]
- Geman S, Geman D. Stochastic relaxation, Gibbs distributions and the Bayesian restoration of images. IEEE Trans Pattern Anal Mach Intell. 1984;6:721–41. doi: 10.1109/tpami.1984.4767596. [DOI] [PubMed] [Google Scholar]
- Gordon R, Bender R, Herman GT. Algebraic reconstruction techniques (ART) for three-dimensional electron microscopy and x-ray photography. J Theor Biol. 1970;29:471–81. doi: 10.1016/0022-5193(70)90109-8. [DOI] [PubMed] [Google Scholar]
- Herman GT, Meyer LB. Algebraic reconstruction techniques can be made computationally efficient. IEEE Trans Med Imaging. 1993;12:600–9. doi: 10.1109/42.241889. [DOI] [PubMed] [Google Scholar]
- Hudson HM, Larkin RS. Accelerated image reconstruction using ordered subsets of projection data. IEEE Trans Med Imaging. 1994;13:601–9. doi: 10.1109/42.363108. [DOI] [PubMed] [Google Scholar]
- Iatrou M, Ross SG, Manjeshwar RM, Stearns CW. A fully 3D iterative image reconstruction algorithm incorporating data corrections. Proc IEEE Nucl Sci Symp and Med Imaging Conf. 2004;4:2493–7. [Google Scholar]
- Jones JP, et al. SPMD cluster-based parallel 3D OSEM. IEEE Trans Nucl Sci. 2003;50:1498–502. [Google Scholar]
- Kamasak ME, Bouman CA, Morris ED, Sauer K. Direct reconstruction of kinetic parameter images from dynamic PET data. IEEE Trans Med Imaging. 2005;24:636–50. doi: 10.1109/TMI.2005.845317. [DOI] [PubMed] [Google Scholar]
- Kay SM. Fundamentals of Statistical Signal Processing: Estimation Theory (Signal Processing Series) Englewood Cliffs, NJ: Prentice-Hall; 1993. [Google Scholar]
- Lewellen TK. Time-of-flight PET. Semin Nucl Med. 1998;28:268–75. doi: 10.1016/s0001-2998(98)80031-7. [DOI] [PubMed] [Google Scholar]
- Liu X, Comtat C, Michel C, Kinahan P, Defrise M, Townsend D. Comparison of 3-D reconstruction with 3D-OSEM and with FORE + OSEM for PET. IEEE Trans Med Imaging. 2001;20:804–14. doi: 10.1109/42.938248. [DOI] [PubMed] [Google Scholar]
- Prince J, Willsky AS. A projection space MAP method for limited angle reconstruction. Proc IEEE Int Conf on Acoust Speech and Sig Proc; New York. 1988. pp. 1268–71. [Google Scholar]
- Qi J, Leahy R, Cherry S, Chatziioannou A, Farquhar T. High-resolution 3D Bayesian image reconstruction using the microPET small-animal scanner. Phys Med Biol. 1998;43:1001–13. doi: 10.1088/0031-9155/43/4/027. [DOI] [PubMed] [Google Scholar]
- Sauer K, Bouman CA. A local update strategy for iterative reconstruction from projections. IEEE Trans Signal Process. 1993;41:534–48. [Google Scholar]
- Shepp L, Vardi Y. Maximum likelihood reconstruction for emission tomography. IEEE Trans Med Imaging. 1982;1:113–22. doi: 10.1109/TMI.1982.4307558. [DOI] [PubMed] [Google Scholar]
- Snyder DL, Thomas LJ, Ter-Posgossian MM. A mathematical model for positron-emission tomography systems having time-of-flight measurements. IEEE Trans Nucl Sci. 1981;28:3575–81. [Google Scholar]
- Stickel JR, Cherry SR. High-resolution PET detector design: modelling components of intrinsic spatial resolution. Phys Med Biol. 2005;50:179–95. doi: 10.1088/0031-9155/50/2/001. [DOI] [PubMed] [Google Scholar]


