Abstract
Time-of-flight secondary ion mass spectrometry (ToF-SIMS) can be utilized to map the distribution of various molecules on a surface with sub-micrometer resolution. Much of its biological application has been in the study of membrane lipids, such as phospholipids and cholesterol. Cholesterol is a particularly interesting molecule due to its involvement in numerous biological processes. For many studies, the effectiveness of chemical mapping is limited by low signal intensity from various bio-molecules. Due to the high energy nature of the SIMS ionization process, many molecules are identified by detection of characteristic fragments. Commonly, fragments of a molecule are identified using standard samples, and those fragments are used to map the location of the molecule. In this work, MS/MS data obtained from a prototype C60+/ quadrupole time-of-flight mass spectrometer was used in conjunction with indium LMIG imaging to map previously unrecognized cholesterol fragments in single cells. A model system of J774 macrophages doped with cholesterol was used to show that these fragments are derived from cholesterol in cell imaging experiments. Examination of relative quantification experiments reveals that m/z 147 is the most specific diagnostic fragment and offers a 3-fold signal enhancement. These findings greatly increase the prospects for cholesterol mapping experiments in biological samples, particularly with single cell experiments. In addition, these findings demonstrate the wealth of information that is hidden in the traditional ToF-SIMS spectrum.
INTRODUCTION
There has been considerable interest in imaging mass spectrometry because of its potential to offer insight into countless biological processes.1 Time-of-flight secondary ion mass spectrometry imaging is a powerful analytical tool for mapping the distribution of biologically relevant small molecules (<1000 Da) on a surface.2–7 Briefly, a pulsed beam of primary ions is directed at the analysis surface. The impact of the ions causes the sputtering of ions and molecules, which are then extracted into a TOF mass analyzer and a mass spectrum is generated. To obtain an image, the primary beam is raster scanned across the surface recording a mass spectrum for each pixel. Molecules of interest can be selected from the spectrum and their unique distributions mapped simultaneously across the imaging area.
Due to the surface sensitivity of the technique, much of its biological application has been in the study of the cell membrane lipids, such as phospholipids and cholesterol.2, 6, 8, 9 Cholesterol is a major constituent of nearly all mammalian cell membranes where its’ concentration is tightly controlled. In the membrane, cholesterol modifies the physical properties of the membrane as well as interacting differentially with various lipids and proteins in the formation of specialized microdomains.10–12 ToF-SIMS combines submicron spatial resolution, high chemical specificity and surface sensitivity, making it an excellent tool for the study of lipid domains within cellular membranes. The capability of ToF-SIMS to image sub-cellular features has been demonstrated in the literature2, 6.
In the brain, cholesterol is involved in many important processes namely synaptogenesis and myelin formation. Improper regulation of cholesterol in the brain has been implicated in multiple human brain diseases including Alzheimer’s disease13. Improper cholesterol homeostasis is also implicated in atherosclerosis which can lead to myocardial infarction and stroke, as well as other disorders14. Therefore, being able to detect and identify the distribution of cholesterol in biological samples has vast implications in medical science.
Due to the high-energy nature of the SIMS ionization process, several larger molecules are identified by the detection of characteristic fragments. Commonly, fragments of the molecule of interest are identified using standard samples, and those fragments are used to map the location of the molecule. However, even single constituent samples can produce fairly complex spectra. Many factors can affect the fragmentation pattern in a SIMS experiment including primary ion, matrix effects, molecular orientation, and surface contamination.4, 15–17 These factors complicate analysis and can make identification of characteristic fragments challenging.
In this work, we present the novel application of MS/MS methodology to identify characteristic fragment ions for use in imaging SIMS. A commercially available MALDI instrument, the QSTAR® XL manufactured by Applied Biosystems MDS Sciex, has been modified to incorporate a C60+ primary ion source. This combination produced several advantages that can be utilized for improving biological SIMS.18, 19 Most notable for these experiments, was greatly increased mass resolution, mass accuracy, and MS/MS capability. Currently, the spatial resolution of this prototype instrument is limited to approximately 10 μm, limiting its use for many single-cell imaging experiments. However, it can provide valuable information to be used in conjunction with sub-micron resolution SIMS instrumentation. In SIMS experiments, cholesterol is seen as [M-OH]+ at m/z 369.35 and [M-H]+ at m/z 385.4.20 Collision-induced dissociation of this ion revealed several candidate fragments whose intensities may make them more suitable for mapping experiments than the pseudomolecular ion. While the relationship between CID fragments and primary ion impact fragments is only just now being explored, initial experiments in this lab show that they are often similar. The main advantage of using fragments generated by CID is that they have unambiguous origins. In addition, the MS/MS spectrum generated is often less complex.
The presence of the fragments in a single component spectrum using In+ as the primary ion, was verified using pure cholesterol films. To validate the usefulness of the CID fragments for single cell imaging experiments, J774 macrophage cells were imaged before and after doping with cholesterol. The relative increases obtained were then compared with results using the pseudomolecular ion.
EXPERIMENTAL SECTION
Hybrid Quadrupole Time-of-Flight Mass Spectrometer
The front end of a QSTAR® XL system, a hybrid LC/MS/MS instrument originally designed for MALDI and electrospray ionization mass spectrometry (Applied Biosystems / MDS Sciex) was modified to fit a 20 keV C60+ source by Ionoptika Ltd. Details of the QSTAR® XL system and the 20 keV C60+ source can be found elsewhere.21, 22 Briefly, the QSTAR® XL system is a tandem quadrupole orthogonal time-of-flight mass spectrometer. In this instrument, nitrogen gas is used for collisional cooling and collisional focusing. The pressure of N2, on the order of 5 mTorr near the sample and collisional focusing quadrupole region (Q0), is critical for efficient operation.23–25 With this configuration, m/Δm resolution exceeding 12,000 has been obtained.
The C60+ ion source for these experiments was operated with 10–15 pA current on the sample in DC mode. MS/MS experiments were carried out using N2 collision gas with a residual gas pressure of 4 x 10⁻⁵.
Imaging is accomplished through movement of the sample stage up to 50 mm in either direction either in a stepped motion down to 10 μm or in a continuous motion. During stepped stage motion, the ion source beam is pulsed off with each stage movement. Data analysis is handled by Analyst® QS 2.0 software and sample stage motion is controlled by oMALDI™ Server 5.0 software, both by Applied Biosystems / MDS Sciex. Further image processing was completed with BIOMAP version 3.7.5.4 software.
In+ SIMS
Spectra using In+ primary ions was acquired using a Kratos Prism ToF-SIMS spectrometer (Manchester, U.K.) equipped with an In+ liquid metal ion source (FEI, Beaverton, OR). The pulsed primary ion source was operated at an anode voltage of 15kV angled at 45° to the sample. The beam was focused to approximately 200 nm in diameter, and delivered 1 nA of DC current in 50 ns pulses. An extraction lens, biased at −4.7 kV, collected the secondary ions which then traveled along a 4.5-m flight path and were detected at a microchannel plate (MCP) detector (Galileo Co., Sturbridge, MA). Mass resolution for these experiments was m/Δm 500.
C60+ SIMS
data using C60+ primary ions was acquired using a BioToF ToF-SIMS spectrometer, described in detail elsewhere.26 The spectrometer was equipped with a 40 KeV C60+ primary ion source21, 27, 28 (Ionoptika Ltd., Southampton, U.K.). The source was operated with a 300 pm diameter beam defining aperture, yielding approximately 20 pA of DC current.
Preparation of cholesterol films
Physical vapor deposition (PVD) films were prepared by subliming cholesterol (Sigma-Aldrich, St. Louis, MO) contained in a crucible by resistive heating of a tungsten filament followed by deposition onto a LN2-cooled sample stage. The film thickness was monitored using a quartz crystal microbalance (QCM), and subsequently characterized using AFM. Films used for this study had a thickness of 100 nm ± 10 nm.
Polydimethylsiloxane (PDMS) films were prepared by soaking a 1 cm x 1 cm Sil-Tec silicone sheet (Technical Products, Inc.) in 5 mL Hexane. The solution was then drop dried onto a stainless steel substrate.
Relative Quantification
J774 macrophage cells were cultured to confluence and subsequently separated into two populations. To label the two different cell populations as well as identify the outer leaflet of J774 cells after fracture, two fluorescent dyes 1,1’-dioctadecyl-3,3,3’,3’-tetramethylindodicarbocyanine (DiD) and 1,1’-dioctadecyl- 3,3,3’,3’-tetramethylindocarbocyanine (DiI), (Molecular Probes, Eugene, OR) were used. Cholesterol loading was achieved by adding cholesterol-β-cyclodextrin (chol-BCD) (CDT, Inc., High Springs, FL) to the DiD labeled flask. The populations were incubated for 1 hr, then rinsed in serum-free media to remove excess dye, and plunge frozen for freeze fracture.29 Fluorescence was monitored using a vertical illuminator microscope (Olympus, Melville, NY) that was previously incorporated into the SIMS instrumental design.30 A detailed description of methods used for relative quantification experiments can be found elsewhere.31
RESULTS AND DISCUSSION
Cholesterol Fragmentation in SIMS Analysis
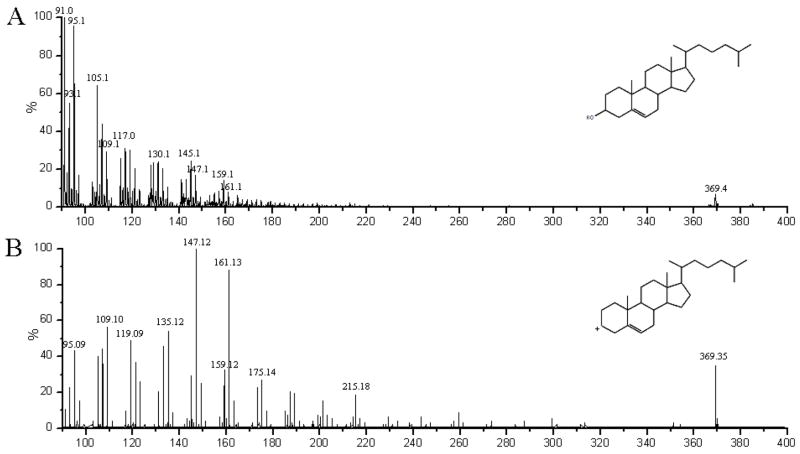
For biological mapping experiments, SIMS spectra are first obtained from single component standards, generally in the form of thin films. These analyses identify characteristic ions that can be used to map the location of these molecules in complex systems, such as biological cells. When using highly energetic primary ions to generate secondary ions from biological samples for analysis, complex spectra are obtained. A spectrum obtained from a pure film of cholesterol induced by 15 keV In+ bombardment is shown in Figure 1A. The lack of PDMS contamination is evidenced by the absence of other common contamination fragments at m/z 133, 207 and 221.
Figure 1.
Mass spectra of cholesterol films. (A) In+ induced spectrum of a PVD cholesterol film. (B) MS/MS spectrum of [M-OH]+ ion derived from pure cholesterol film using N2 as a collision gas. All spectra are standardized to largest peak in the viewing area.
The QSTAR® XL instrumentation allows the utilization of MS/MS methodology to probe the fragmentation of cholesterol ions created by primary ion bombardment. The resultant MS/MS spectrum from the [M-OH]+, generated by C60+ bombardment, is shown in Figure 1B. Collision-induced fragmentation produces two species in high quantity at m/z 147.12 and m/z 161.13. These species are nearly absent in the cholesterol spectrum obtained using C60+, but are found in the In+ spectrum with higher intensity than the m/z 369 pseudomolecular ion traditionally used for cholesterol imaging using SIMS. The molecular ion is seen at m/z 385.4 in standard samples, but the pseudomolecular ion (m/z 369) is most commonly used due to its higher intensity. This suggests that these species may be useful for mapping cholesterol, particularly when limited ions are available for collection, as is the case in high resolution cell imaging experiments.
To quantify the signal intensity obtained for the various fragments, PVD cholesterol films were analyzed using In+ and C60+. The intensity was calculated by dividing the peak area for the fragment by the peak area for m/z 369, Results are shown in Table 1. This analysis suggests that the mapping of fragments should be most beneficial in the case of atomic projectiles. These analyses also demonstrate the decrease in fragmentation that occurs when utilizing cluster ion sources. This indicates the value of identifying characteristic fragments, even when employing cluster primary ions. It should also be noted that the absolute intensities (ions/primary ion) of fragments obtained using C60+ as the primary ion were 50–110 fold higher than those obtained employing In+. However, when imaging with a high-spatial resolution C60+ beam, primary ion currents are typically 100 fold lower than In+ resulting in prohibitive data collections times to reach the static limit.
Table 1.
Signal intensity of fragments reported as percentage of pseudomolecular ion intensity.
| (m/z)+ |
|||||
|---|---|---|---|---|---|
| Material | Projectile | 161 | 147 | 109 | 95 |
| PVD Film | C60+ | 21 ± 7% | 30 ± 9% | 51 ± 9% | 149 ± 5% |
| In+ | 155 ± 11% | 310 ± 10% | 538 ± 9% | 1645 ± 9% | |
| J774 Cells | In+ | 177 ± 16% | 260 ± 16% | 443 ± 16% | 1352 ± 9% |
The reported numbers are the mean of 5 independent measurements of different areas of the surface from the same film. The reported cell numbers are the mean of 6 independent macrophage images. Errors reported are standard deviation.
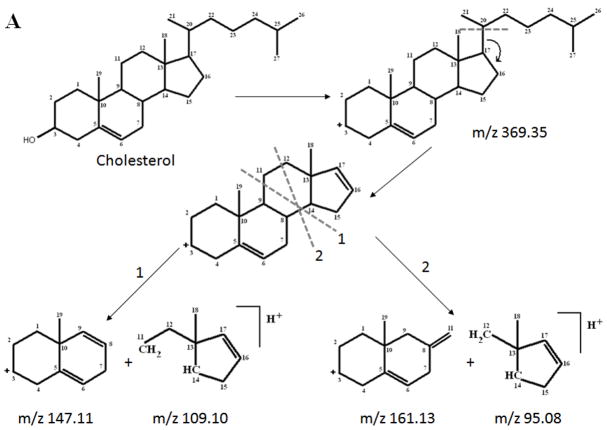
The [M-OH]+ ion has been used extensively in biological imaging experiments5, 9, 20, 31, 32, as it can be unambiguously attributed to cholesterol. For this reason and its high intensity, it was analyzed by MS/MS. It has been suggested in the literature33 that the first step in the fragmentation is the disconnection of the aliphatic side chain. Direct evidence for this was not observed, as our experiments did not detect the side chain fragment or the intact sterol ring system. However, the fragments detected are derived from the sterol ring system, as was reported. The mass resolution of the QSTAR® XL allowed us to very accurately identify the elemental formulas of the fragment ions.
The major fragments can be explained by identifying two key fragmentation sites, shown in Figure 2. The complexity of the spectrum obtained suggests that fragmentation occurs at many sites, but to a much lesser extent. The stability of these fragments indicates that they would be good ions to measure in SIMS.
Figure 2.
Proposed fragmentation scheme for cholesterol from MS/MS analysis.
Isobaric Interferences and Contamination
The nominal mass 147 has long been known to be indicative of PDMS, a prevalent contaminant in SIMS analysis34. We believe that the existence of this contaminant has prevented the identification of this major fragment.
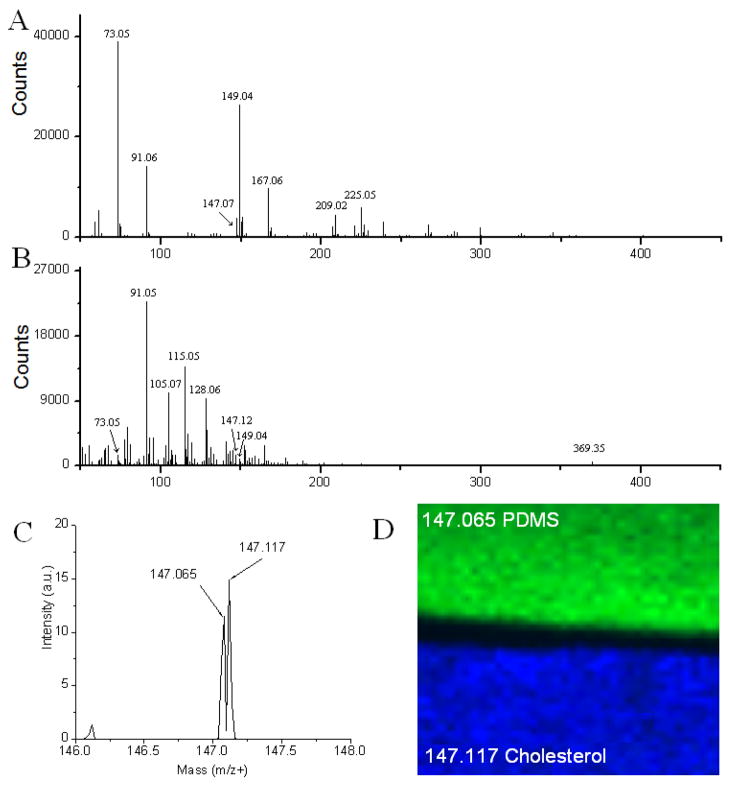
To demonstrate that the 147 fragment in the MS/MS spectrum is not the result of contamination, a thin film of pure cholesterol was placed next to a thin film of PDMS. Figure 3A shows a mass spectrum obtained from the PDMS film. The m/z 147.065 peak is easily identified along with other characteristic fragments seen with PDMS: m/z 73.05, m/z 149.04, and m/z 209.02. When a mass spectrum is obtained from the cholesterol film, these fragments are nearly absent, indicating little or no contamination. A spectrum of a cholesterol film induced by 20 keV C60+ cluster ion bombardment can be seen in Figure 3B. This analysis yields a simpler spectrum than In+ with a larger contribution coming from the [M-OH]+. However, significant fragmentation is observed resulting in a different pattern when compared to that obtained with In+. This suggests that when employing other primary ion sources, fragments other than those observed with In+ may be more valuable.
Figure 3.
Discriminating contaminant peaks. (A) Mass spectrum generated from the PDMS coated sample. (B) Mass spectrum generated from the cholesterol coated sample. (C) Orthogonal ToF-SIMS imaging of the junction of two sample plates; one coated with cholesterol (m/z 147.117 = blue), and one coated with PDMS (m/z 147.065 = green). (D) Resulting mass spectrum with m/Δm resolution of 8000.
To further demonstrate the difference between the two species obtained around m/z 147, an image of the junction of these two plates was obtained. Figure 3C shows a blow-up of the 147 mass region; the peaks at m/z 147.065 and m/z 147.117 are fully resolved. In Figure 3D, a mass specific SIMS image of the two masses shows that 147.065 localizes to the PDMS covered sample and the 147.117 localizes to the cholesterol-coated sample. In combination with MS/MS data, this decisively shows that m/z 147.117 is derived from cholesterol. These experiments also demonstrate the value of improved mass resolution for ToF-SIMS imaging experiments.
Isobaric Interferences in Cell Imaging
In a standard ToF- SIMS experiment, the ToF region is coupled to the secondary ion ejection process. The energy spread inherent to the sputtering process limits the attainable mass resolution for our imaging experiments. Hence, the mass resolution shown above is not currently available to single cell imaging experiments. To determine if the m/z 147 observed in these experiments was derived from cholesterol, relative quantification experiments measuring cholesterol were examined.
A J774 cell population was split, half were incubated with DiD and chol-BCD, and the other with DiI, as previously reported31. The chol-BCD complex is water soluble and facilitates cholesterol loading. Therefore, the treated cell population is expected to have a higher concentration of cholesterol in the outer membrane. The DiI and DiD are fluorophores that preferentially intercalate into the outer leaflet of the cell membrane, creating a marker to differentiate the two cell populations. After incubation, the cells were rinsed, mixed together and allowed to settle on Si substrates.
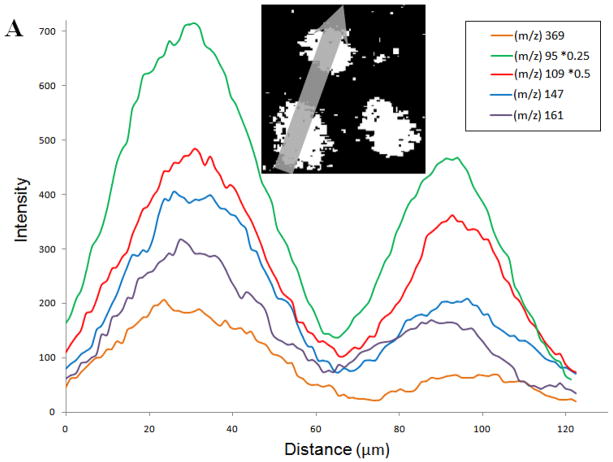
The samples were prepared for imaging using freeze-fracture methodology3. Treated and non-treated populations were differentiated using in situ fluorescence microscopy. By imaging the two different cell populations in the same field of view, the cholesterol content could be compared. Quantification was performed by analyzing line scans across the images; a plot of the signal intensity for a given ion as a function of its lateral position on the line shown on the image (inset). By drawing the line across 2 cells from different populations, as demonstrated in Figure 4A inset, the signal intensities are displayed on a single plot. For the image shown, the line scan begins in the lower left.
Figure 4.
Cholesterol fragment ion intensity versus distance. Line scans of cholesterol fragment ion intensity across two cells demonstrates the uniformity of the internal standard use for quantification. The inset shows the path of the line scan which begins in the bottom left. The cell to the bottom left was treated with cholesterol vs. the cell above which was control.
Figure 4A shows the line scans for each individual fragment from the image. It is clear from these scans that signal intensity is greater in the first cell, and the fluorescence measurement indicates this cell was from the chol-BCD treated population. A rise in fragment signal was observed for all of the fragments after incubation with chol-BCD. It can be seen in the Figure 4A inset that the size of the two cells appears to be different. This disparity is accounted for in relative quantification experiments through the use of m/z 69 as an internal standard.2, 6, 31 Additionally, the ratio of the peak areas from treated cell to control cell are appreciably different for some of the fragments analyzed, m/z 109 and m/z 95. This suggests that these fragments are less discriminatory indicators of cholesterol concentration.
To better understand why some fragment ions are better indicators of cholesterol, the relative quantification data was analyzed using the fragments characterized in this work. The results are summarized in Table 2. Cholesterol molecular ion is shown in the last column as a comparison. Since m/z 369 appears in a region of the spectrum with few other peaks, it is hypothesized that isobaric interference is least for this ion. For this reason, results obtained for the fragment ions were statistically compared to the measurement from the pseudomolecular ion (Student’s t-test). The p-values obtained for each fragment are shown in the bottom row of the table. It can be seen from this analysis that m/z 109 is significantly different than the molecular ion, and that difference for m/z 95 tends toward significance. We hypothesize that this discrepancy is due to other species present in these complex samples that we are unable to differentiate due to a lack of mass resolution. This implies that these masses are not very selective diagnostic peaks for cholesterol. Despite the interference, cholesterol undoubtedly contributes to the signal intensity observed at these two masses, indicating that these fragments can still be useful for imaging cholesterol distribution.
Table 2.
Relative cholesterol increase in treated cells utilizing the identified fragments
| (m/z)+ | |||||
|---|---|---|---|---|---|
| 161 | 147 | 109 | 95 | 369 | |
| % Increase | 146 ± 44 | 178 ± 34 | 134 ± 17 | 149 ± 8 | 187 ± 45 |
| p-value | 0.14 | 0.69 | 0.02 | 0.07 | |
The relative cholesterol increase in treated cells calculated for various cholesterol fragments. Errors reported are standard deviations, n=6 for all measurements. The p-values are reported from a t-test comparing the calculated increase using the fragment, to the increase found using the pseudomolecular ion.
The best correlation for these measurements is obtained from the m/z 147 fragment. This fragment also shows a much smaller standard deviation than m/z 369, likely due to the gain in signal to noise ratio. This analysis suggests this fragment would give the most accurate measure of cholesterol concentration. Moreover, this fragment appears with the largest intensity in the MS/MS spectrum which is indicative of its stability.
Imaging with Fragments
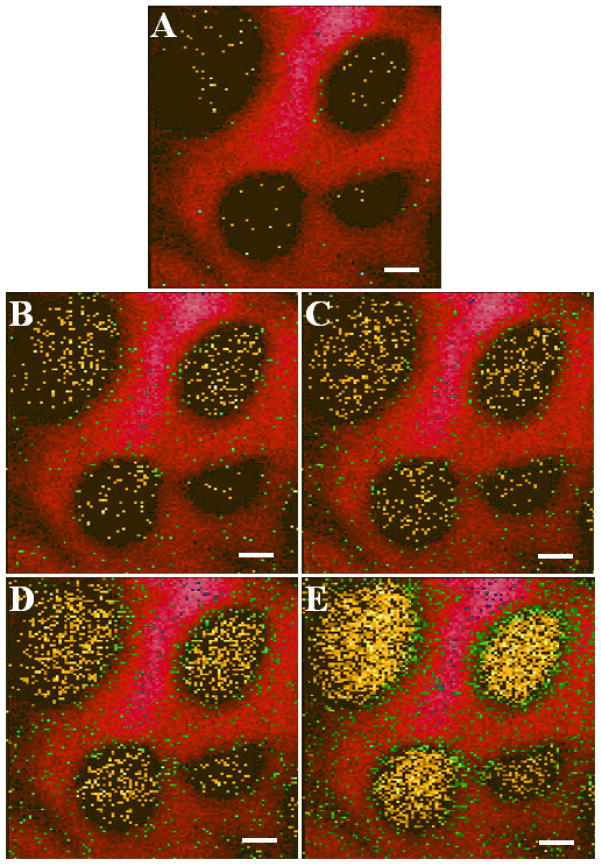
These fragments are useful to single cell imaging experiments. An example of this is shown in Figure 5. The Indium ion source was employed as it provides higher spatial resolution required for imaging single cells. These images illustrate the increase in signal that is obtained when fragment peaks are used to map cholesterol on the surface. Although employing m/z 369 provides enough signal to compare concentrations, little or no information is obtained about the sub-cellular distribution of cholesterol on the cells surface. However, when higher intensity fragments are mapped a much more detailed description of the surface is obtained, allowing us to probe cholesterol concentration at discrete locations on the cell surface.
Figure 5.
SIMS imaging of macrophage cells. SIMS overlay images of the Cholesterol fragment ions (Yellow) vs. Na m/z 23(Red), green pixels denote the presence of both ions on macrophages. All scale bars are 10 μm. A.) m/z 369 B.) m/z 161 C.) m/z147 D.) m/z 109 E.) m/z 95.
Table 1 shows the intensity increase when compared to the m/z 369 ion, as shown above for the different projectiles. These images were obtained using In+ primary ion. When compared to Figure 2B, these numbers resemble those obtained from the cholesterol standard. The decrease in relative intensity is likely due to the lower concentration of cholesterol at the surface of the membrane when compared to the surface of a PVD film. This indicates that under these well controlled sample conditions, matrix effects play a limited role in the ionization process and further supports the proposition that these fragments are derived from cholesterol. The strong localization of the m/z 147 ion to the surface of the cell shows that there is little PDMS contamination with this sample. With a contaminated sample, a more dispersed signal would be expected. The low values for standard deviation demonstrate the utility of m/z 69 as an internal standard for single cell imaging experiments; and further validates the rigorous protocols developed in this lab for making relative quantification measurements31. Moreover, this demonstrates that relative intensity measurements are sensitive to surface concentrations.
CONCLUSIONS
New diagnostic fragments have been uncovered for the analysis of cholesterol using ToF-SIMS imaging using MS/MS methodology. The m/z 147 fragment of cholesterol has been resolved from that for PDMS using the higher resolution QSTAR® XL instrument. The use of these fragments improves the capability of SIMS to quantify and image cholesterol, particularly in single cells.
Relative quantification experiments reveal that increasing the content of cholesterol in cells results in a corresponding increase in cholesterol fragments. When analyzing a complex biological sample with low mass resolution, isobaric interferences are unavoidable. For the lower mass fragments, these interferences were shown to be problematic for relative quantification experiments and could be misleading in imaging experiments with low signal to noise ratios. Comparison of fragments with [M-OH]+ reveal that m/z 147 most closely resembles the molecular ion, indicating the least isobaric interference. Moreover, this fragment appears with the largest intensity in the MS/MS spectrum which is indicative of its stability.
These findings demonstrate the potential for the application of MS/MS methodology to ToF-SIMS bioimaging. The identification of novel and useful diagnostic fragments of biomolecules is central to the advancement of the technique. In this particular case, characteristic fragments of an extensively analyzed molecule have been overlooked. This new knowledge, along with TOF data sets, allows for past analyses to be re-evaluated. This illustrates the value of retrospective imaging capabilities permitted by using ToF-MS. Furthermore, these findings reveal the need for improved mass resolution in SIMS imaging experiments. When analyzing an incredibly complex system such as the cellular membrane, improved mass resolution is crucial to the identification of unknown peaks and elimination of isobaric interference. It is probable that substantial biological complexity is being lost in the noise, due to a lack of mass resolution.
Acknowledgments
This work was supported by a grant from the National Institutes of Health and additional instrumentation funding provided by the National Science Foundation. The authors thank Applied Biosystems / MDS Sciex for supplying the QSTAR® XL used for fragment identification.
References
- 1.McDonnell LA, Heeren RMA. Mass Spectrom Rev. 2007;26:606–643. doi: 10.1002/mas.20124. [DOI] [PubMed] [Google Scholar]
- 2.Monroe EB, Jurchen JC, Lee J, Rubakhin SS, Sweedler JV. J Am Chem Soc. 2005;127:12152–12153. doi: 10.1021/ja051223y. [DOI] [PubMed] [Google Scholar]
- 3.Colliver TL, Brummel CL, Pacholski ML, Swanek FD, Ewing AG, Winograd N. Anal Chem. 1997;69:2225–2231. doi: 10.1021/ac9701748. [DOI] [PubMed] [Google Scholar]
- 4.Pacholski ML, Donald M, Cannon J, Ewing AG, Winograd N. J Am Chem Soc. 1999;121:4716–4717. [Google Scholar]
- 5.McDonnell LA, Piersma SR, Altelaar AFM, Mize TH, Luxembourg SL, Verhaert PDEM, Minnen Jv, Heeren RMA. J Mass Spectrom. 2005;40:160–168. doi: 10.1002/jms.735. [DOI] [PubMed] [Google Scholar]
- 6.Ostrowski SG, Bell CTV, Winograd N, Ewing AG. Science. 2004;305:71–73. doi: 10.1126/science.1099791. [DOI] [PMC free article] [PubMed] [Google Scholar]
- 7.Rubahkin SS, Jurchen JC, Monroe EB, Sweedler JV. Drug Discov Today. 2005;10:823–837. doi: 10.1016/S1359-6446(05)03458-6. [DOI] [PubMed] [Google Scholar]
- 8.Nygren H, Malmberg P. Trends Biotechnol. 2007;25:499–504. doi: 10.1016/j.tibtech.2007.07.010. [DOI] [PubMed] [Google Scholar]
- 9.Altelaar AFM, Klinkert I, Jalink K, Lange RPJ, Adan RAH, Heeren RMA, Piersma SR. Anal Chem A. 2005 doi: 10.1021/ac0513111. [DOI] [PubMed] [Google Scholar]
- 10.Mukherjee S, Maxfield FR. Annu Rev Cell Dev Biol. 2004;20:839–866. doi: 10.1146/annurev.cellbio.20.010403.095451. [DOI] [PubMed] [Google Scholar]
- 11.Mukherjee S, Zha XH, Tabas I, Maxfield FR. Biophys J. 1998;75:1915–1925. doi: 10.1016/S0006-3495(98)77632-5. [DOI] [PMC free article] [PubMed] [Google Scholar]
- 12.Davey AM, Walvick RP, Liu YX, Heikal AA, Sheets ED. Biophys J. 2007;92:343–355. doi: 10.1529/biophysj.106.088815. [DOI] [PMC free article] [PubMed] [Google Scholar]
- 13.Valenza M, Cattaneo E. Prog Neurobiol. 2006;80:165–176. doi: 10.1016/j.pneurobio.2006.09.005. [DOI] [PubMed] [Google Scholar]
- 14.Hansson GK, Robertson AKL, Soderberg-Naucler C. Annu Rev Pathol Mech Dis. 2006;1:297–329. doi: 10.1146/annurev.pathol.1.110304.100100. [DOI] [PubMed] [Google Scholar]
- 15.Piehowski PD, Kurczy ME, Willingham D, Parry S, Heien ML, Winograd N, Ewing AG. Langmuir. 2008;24:7906–7911. doi: 10.1021/la800292e. [DOI] [PMC free article] [PubMed] [Google Scholar]
- 16.Prinz C, Hook F, Malm J, Sjovall P. Langmuir. 2007;23:8035–8041. doi: 10.1021/la7004634. [DOI] [PubMed] [Google Scholar]
- 17.Luxembourg SL, McDonnell LA, Duursma MC, Guo XH, Heeren RMA. Anal Chem. 2003;75:2333–2341. doi: 10.1021/ac026434p. [DOI] [PubMed] [Google Scholar]
- 18.Carado A, Kozole J, Passarelli M, Winograd N, Loboda A, Bunch J, Wingate J, Hankin J, Murphy R. Appl Surf Anal. 2008 [Google Scholar]
- 19.Carado A, Kozole J, Passarelli M, Winograd N, Loboda A, Wingate J. Appl Surf Anal. 2008 doi: 10.1021/ac801712s. [DOI] [PMC free article] [PubMed] [Google Scholar]
- 20.Sostarecz AG, McQuaw CM, Ewing AG, Winograd N. J Am Chem Soc. 2004;126:13882–13883. doi: 10.1021/ja0472127. [DOI] [PubMed] [Google Scholar]
- 21.Weibel D, Wong S, Lockyer N, Blenkinsopp P, Hill R, Vickerman JC. Anal Chem. 2003;75:1754–1764. doi: 10.1021/ac026338o. [DOI] [PubMed] [Google Scholar]
- 22.Cotter RJ, Gardner BD, Iltchenko S, English RD. Anal Chem. 2004;76:1976–1981. doi: 10.1021/ac0349431. [DOI] [PubMed] [Google Scholar]
- 23.Douglas DJ, French JB. J Am Soc Mass Spectrom. 1992;3:398–408. doi: 10.1016/1044-0305(92)87067-9. [DOI] [PubMed] [Google Scholar]
- 24.Krutchinsky AN, Chernushevich IV, Spicer VL, Ens W, Standing KG. J Am Soc Mass Spectrom. 1998;9:569–579. [Google Scholar]
- 25.Loboda AV, Krutchinsky AN, Bromirski M, Ens W, Standing KG. Rapid Commun Mass Spectrom. 2000;14:1047–1057. doi: 10.1002/1097-0231(20000630)14:12<1047::AID-RCM990>3.0.CO;2-E. [DOI] [PubMed] [Google Scholar]
- 26.Braun RM, Blenkinsopp P, Mullock SJ, Corlett C, Willey KF, Vickerman JC, Winograd N. Rapid Commun Mass Spectrom. 1998;12:1246-+. doi: 10.1002/(SICI)1097-0231(19980930)12:18<1246::AID-RCM316>3.0.CO;2-C. [DOI] [PubMed] [Google Scholar]
- 27.Wong SCC, Hill R, Blenkinsopp P, Lockyer NP, Weibel DE, Vickerman JC. App Surf Sci. 2003;203:219–222. [Google Scholar]
- 28.Fletcher JS, Conlan XA, Jones EA, Biddulph G, Lockyer NP, Vickerman JC. Anal Chem. 2006;78:1827–1831. doi: 10.1021/ac051624w. [DOI] [PubMed] [Google Scholar]
- 29.Cannon DMJ, Pacholski ML, Winograd N, Ewing AG. J Am Chem Soc. 2000;122:603–610. [Google Scholar]
- 30.Roddy TP, Donald M, Cannon J, Meserole CA, Winograd N, Ewing AG. Anal Chem. 2002;74:4011–4019. doi: 10.1021/ac0255734. [DOI] [PubMed] [Google Scholar]
- 31.Ostrowski SG, Kurczy ME, Roddy TP, Winograd N, Ewing AG. Anal Chem. 2007;79:3554–3560. doi: 10.1021/ac061825f. [DOI] [PMC free article] [PubMed] [Google Scholar]
- 32.Nygren H, Eriksson C, Malmberg P, Sahlin H, Carlsson L, Lausmaa J, Sjovall P. Colloid Surface B. 2003;30:87–92. [Google Scholar]
- 33.Rossmann B, Thurner K, Luf W. Monatsh Chem. 2007;138:436–444. [Google Scholar]
- 34.Vickerman JC, Briggs D, editors. ToF-SIMS: Surface Analysis by Mass Spectrometry. IM Publications and Surface Spectra Limited; West Sussex: 2001. [Google Scholar]


