Abstract
To examine underlying mechanisms of urodele lens regeneration we have employed a proteomic analysis of 650 proteins involved in several signaling pathways. We compared expression of these proteins between the regeneration-competent dorsal iris and the regeneration-incompetent ventral iris in the newt. After a series of screenings we selected several proteins to evaluate their expression quantitatively on immunoblots. We then used these selected proteins to compare their expression between the dorsal iris of the newt and the iris of the axolotl, another urodele, which does not regenerate the lens. In the newt we find that most proteins are expressed in both dorsal and ventral iris, even though there is differential regulation. Moreover, several of these proteins are expressed in the axolotl iris as well and for some of them their expression is consistent with the regeneration potential.
Although many animals can regenerate different tissues, the newt stands alone in its ability to regenerate body parts and organs throughout adulthood [1-4]. An interesting aspect of this ability is that even among urodeles regeneration potency varies. For example the axolotl, a neonate salamander, is not able to regenerate its eye tissues, while it shows impressive regeneration of limbs and tail (including spinal cord) [5]. To understand this we study lens regeneration in the newt, which shows another interesting pattern. Regeneration always occurs via transdifferentiation of the pigmented epithelial cells (PECs) of the dorsal iris only, but never from the same cells residing in the ventral iris [6, 7].
Over the past few years our laboratory has examined expression and role of several genes during the process of lens regeneration in the newt. The general conclusion was that the ventral iris is quite active after lentectomy and it readily expresses regulatory and tissue remodeling genes [8-13]. This was quite surprising and might indicate that after lentectomy there must be a global gene repression event in the ventral iris. To further investigate this issue we explored the possibility of using a commercially available microarray analysis of 650 proteins involved in signaling pathways. This array has been successfully used in several animals from starfish to human. Given the lack of any such study in the newt and the sparse resources available for urodeles we thought that this presented an excellent opportunity for experimentation.
Thus, we compared expression between the newt dorsal iris and the ventral iris. From the microarray data we selected several proteins and we verified quantitatively their expression using western blot analysis. Then we examined expression of these proteins in the axolotl iris as well in order to obtain some insight about possible differences. Our protein data indicate that similarly to the gene expression data, the newt ventral iris is quite active during regeneration. At the same time our data indicated that the axolotl iris does not show identical patterns with the newt ventral iris.
Methods
Microarray
Newts (Notophthalmus viridescens) or axolotls (Ambystoma mexicanum) were anesthetized in 0.1% ethyl 3-aminobenzoate methsulfonic acid in phosphate buffer. Newts were obtained by Amphibia of North America, TN and axolotls from the axolotl colony, University of Kentucky. The animals were lentectomized and 8 days later the dorsal and ventral iris tissue was and placed on dry ice for rapid freezing. Next, a special lysis buffer (supplied by Kinexus) was added to the tubes and the samples were homogenized. The proteins were tagged with a fluorescent dye and used to probe Kinex™ Reverse Lysate Microarray, which contains 650 antibodies (in duplicates) for profiling cell signaling and phosphorylation. For analysis the treated spot (in our analysis this is the dorsal iris sample) average intensity and the control spot (ventral iris sample) average intensity are considered and, using a statistical program, the fold change between the ventral control and dorsal experimental sample was determined. There are 9 factors which determine the significance of a particular protein's change. This includes; control average, control error range, treated average, treated error range, log2 (treated average/control average), and the flag and signal to noise ratio for both control and treated. In the end, a negative number represented up-regulation of a target protein in the control ventral sample and a positive number represented up-regulation in the dorsal sample. For details please go to www.kinexus.ca
Immunoblots
In order to validate the protein microarray, immnoblotting was performed. For this set of experiments, Kinexus' Kinetworks Multi-Immunoblotting was performed using antibodies we selected based on the protein microarray results. From a pool of 36 antibodies we selected 16 that showed on a western analysis bands of the expected size (see below for identification of bands). This protocol is an adaptation of the traditional Western Blotting technique. Samples were run on a SDS-PAGE gel followed by electronic transfer to a nitrocellulose membrane. The membrane is loaded into a company-designed apparatus that separates the membrane into 18 lanes in which the antibodies are loaded. With this design, one membrane can be probed with up to 18 antibodies. Bands were identified based on the molecular weight range of a target protein. If a band falls within that range, it is recognized as a classified signal (crossed red lines in Figures 2 and 3). Any bands that appear at random in a lane is referred to as “unclassified”, meaning undetermined. This service has been optimized to work in human, mouse, rat, primate, pig, chick, dog, cow, xenopus, and sea star. Quantitation of the bands visualized using the Kinexus ECL Detection System was performed using enhanced chemiluminescence. An imaging system with a 16-bit camera and a quantitation software program was used to analyze the chemiluminescent samples. The scanner was used to capture an image of the samples and covert the light intensity into digital data. From this, an intensity profile for each band is established. Graphical representation depicted the percent change of target proteins from the control samples and experimental samples. Normalization was used to correct systematic errors during Western Blots analysis. Usually, a normalization protocol requires a comparison of intensity of the band for a protein of interest to be compared to a control protein, like actin or GADPH. Here, normalization was accomplished by summing the trace quantity of all bands detected on the Immunoblot, finding the average total intensity per screen in a group, then using the coefficient (scaling) factor to multiply the counts per minute of each trace quantity in each sample.
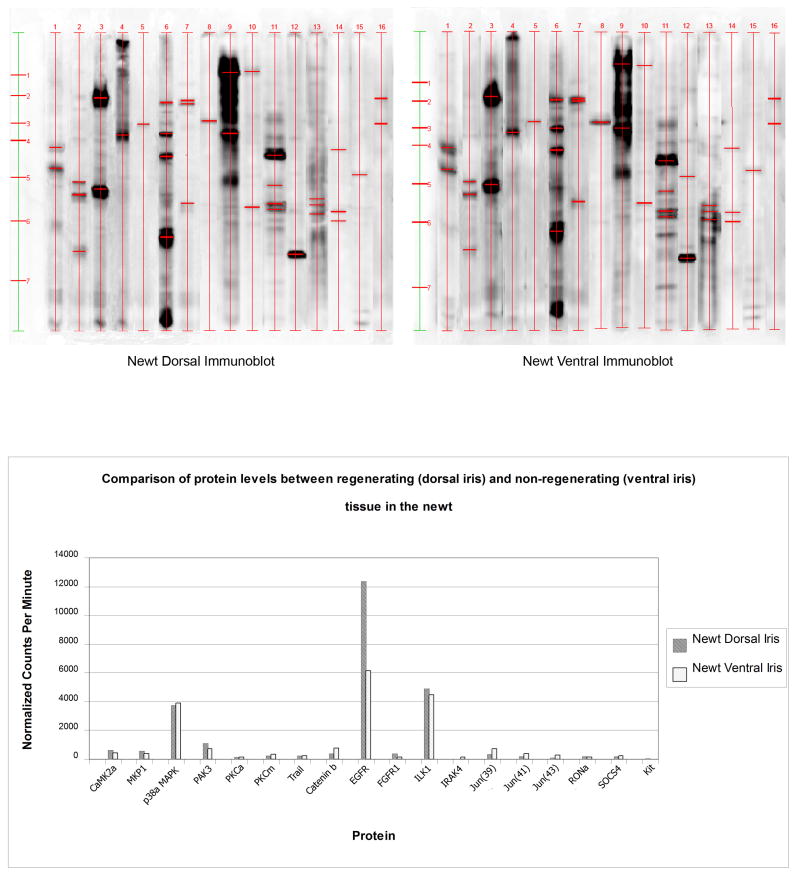
Figure 2.
Immunoblot analysis of 16 selected proteins. Expression in the newt dorsal and ventral iris. Quantitation of the expressed proteins is shown in the graph at the lower panel.
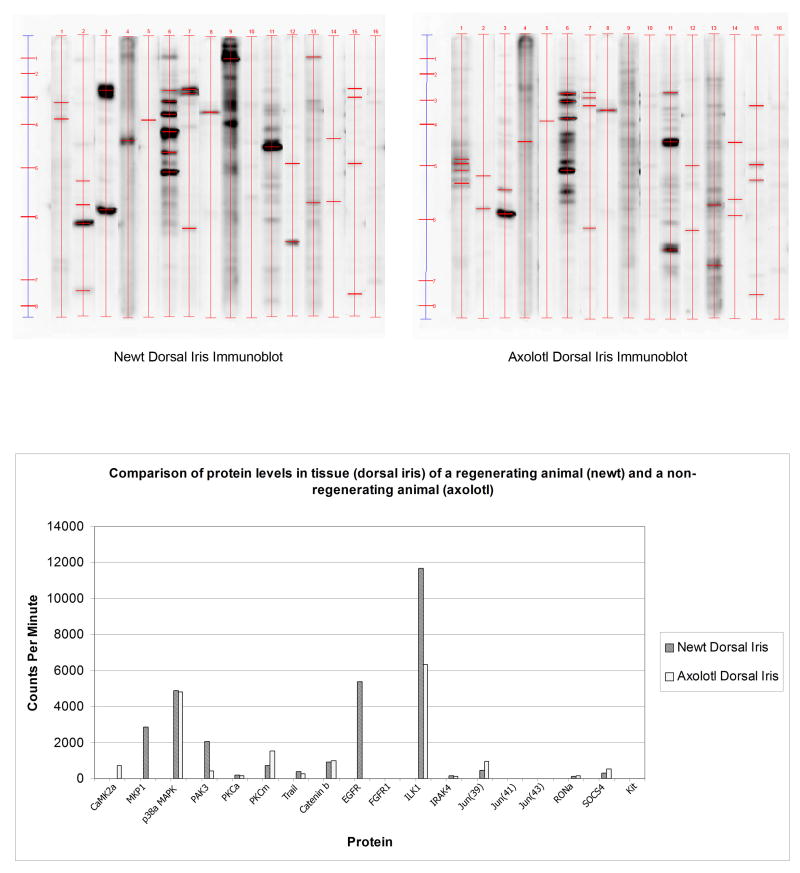
Figure 3.
Immunoblot analysis of 16 selected proteins. Expression in the newt dorsal and the axolotl dorsal iris. Quantitation of the expressed proteins is shown in the graph at the lower panel.
The first set of experiments was carried out to validate and quantitate the microarray data from the comparison of the newt dorsal and ventral iris. After we evaluated these results we repeated the western analysis using protein extracts from newt dorsal and axolotl dorsal iris.
Results and discussion
Microarray-Newt dorsal vs ventral iris
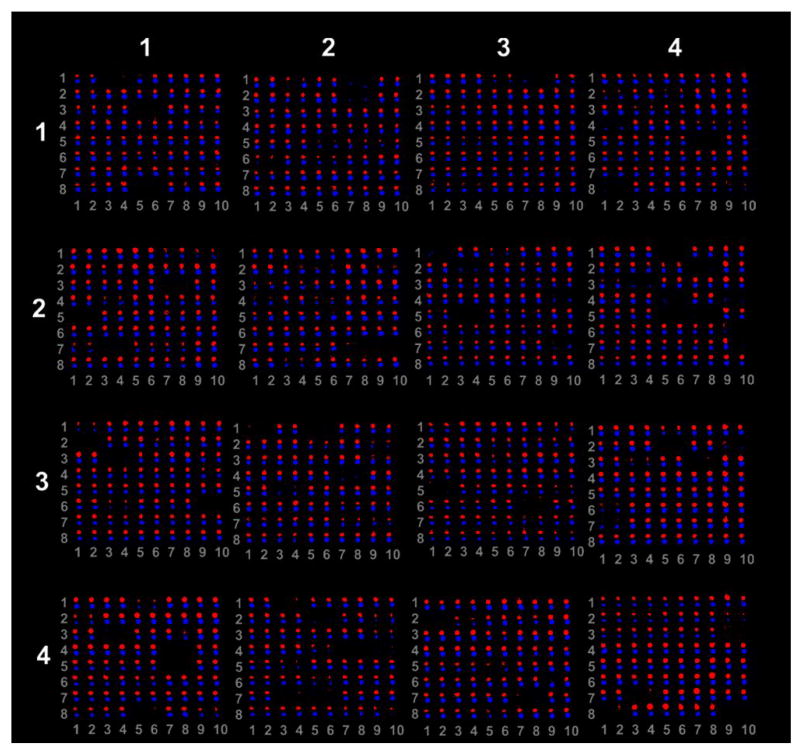
After hybridization, the microarray chip (Figure 1) was analyzed by Kinexus software. Red spots on the chip represent the dorsal (considered as the treated sample), regenerating iris tissue and blue spots the ventral non-regenerating iris tissue (considered the control sample). When one spot is shown larger than the other in one location, this means that the target protein can be found in both samples, but is up-regulated in the sample which is represented by the larger spot and down-regulated in the tissue represented by the smaller spot. Therefore, when only one spot is shown at the chip, that would indicate that the target protein is expressed solely in the sample whose spot is present. As can be seen in Figure 1 most of the antibodies cross-reacted with the newt proteins. It is interesting to note that the majority of proteins were present in both dorsal and ventral iris despite some degree of differential expression. Very few were found to be specific to dorsal or ventral iris. The list of all antibodies and their location on the chip can be found at www.kinexus.ca/pdf_list_antibody_kinex.xls
Figure 1.
Microarray analysis of protein expression in dorsal iris (red dots) vs ventral iris (blue dots). The array is divided in 4 meta rows and 4 meta columns. Each meta row is divided to 8 rows and 10 columns. The antibodies are arrayed in duplicates along the columns. In this arrangement column 1 and 2, 3 and 4 and so on contain the same series of antibodies. The intensity of the dot shows the degree of regulation. When the spot is larger between the two samples it indicated up-regulation. Overall, most of the antibodies show interaction with newt proteins and differential regulation between the dorsal and the ventral irises.
Immunoblots-Newt dorsal vs ventral iris
After microarray analysis, it was important to obtain some validation of the results. Kinexus advises that when dealing with cross-species hybridizations only 35-45% of the microarray data can be validated. Thus, in our experiments the microarray experiment was the starting point to see the general pattern and estimate the degree of antibody reactivity. Then we initially selected 36 antibodies to validate our data. Following the analysis that was described in the Methods section we decided to continue with 16 of them that showed signal and bands of expected size(s). Figure 2 shows the results of the western analysis and the comparison between dorsal and ventral iris. The histogram at the bottom of the figure represents the quantitation for each protein, based on normalized counts. From this analysis we can see the striking up-regulation of EGFR in the dorsal iris. Other proteins that show some up-regulation in the dorsal iris include the p21-activated serine kinase (PAK3), the MAP kinase phosphatase1 (MKP1) and the calcium/calmodulin-dependent protein serine kinase 2 alpha (CaMK2α). Likewise we found some proteins with higher expression in the ventral iris. These include catenin β1, the jun proto-oncogene and the suppressor of cytokine signaling 4 (SOCS4).
Immunoblots-Newt vs Axolotl
Having probed successfully several proteins from the newt we decided to extend our analysis by comparing the newt with the axolotl. Here we wanted to test the hypothesis whether the axolotl dorsal iris (unable for regeneration) has identical or similar signatures with the newt ventral iris (unable for regeneration). Thus, we selected the 16 antibodies that worked with the newt and indeed the majority of them worked with the axolotl as well. EGFR, PKCα, MPK1 and PAK3 (dorsally up-regulated in the newt) were either absent or down regulated in axolotl. Catenin β1, jun and SOCS4 (ventrally up-regulated in the newt) were up-regulated in the axolotl (Figure 3). In these instances the profiling of the newt and axolotl iris was consistent with the regeneration potential (7 out of 13 proteins in Table 1). Others (4 out of 13 showed equal pattern were somewhat consistent). Only 2 out of the 13 examined proteins showed inconsistency. In Table 1 we have summarized these patterns and correlated them with the ability for regeneration.
Table 1.
Expression of proteins and its association with regenerative capabilities in the newt and the axolotl
| Protein | Abbrev. | Newt Dorsal vs Ventral iris (higher) | Newt Dorsal vs Axolotl (higher) | Consistent with Regeneration potential |
|---|---|---|---|---|
| Calcium/calmodulin-dependent protein serine kinase 2α | CaMK2a | D | axolotl | NO |
| Catenin beta 1 | Catenin β1 | V | axolotl | YES |
| Epidermal growth factor receptor | EGFR | D | newt | YES |
| Integrin-linked protein-serine kinase 1 | ILK1 | equal | newt | Maybe |
| Interleukin 1 receptor-associated kinase 4 | IRAK4 | V | equal | Maybe |
| Jun proto-oncogene | jun | V | axolotl | YES |
| Macrophage-stimulating protein receptor α chain | RONa | D | axolotl | NO |
| MAP kinase phosphatase 1 | MKP1 | D | newt | YES |
| Mitogen-activated protein serine kinase p38 α | P38aMAPK | equal | equal | Maybe |
| p21 activated serine kinase 3 | PAK3 | D | newt | YES |
| Protein-serine kinase C α | PKCa | D | newt | YES |
| Suppressor of cytokine signaling 4 | SOCS4 | V | axolotl | YES |
| TNF-related apoptosis-inducing ligand | Trail | equal | newt | Maybe |
Several useful conclusions can be drawn from our analysis. First, as had been largely suggested by RNA expression analysis, the ventral iris expresses in its majority many of the proteins that are expressed in the dorsal iris after lentectomy. This confirms that the ventral iris becomes quite active and most likely initiates the early events of regeneration. In this case the lack of regeneration might lie in a global gene repression, specific to the ventral iris as well. Second, the axolotl dorsal iris showed a molecular signature (similar to the newt ventral iris) that correlates well with its regenerative inability. This might bear significance in efforts to induce regeneration in other species. Our studies suggest that we should direct our efforts in genes whose regulation show consistency between the newt and the axolotl. Even better we should concentrate in pathways that show consistency. For example, EGFR is up-regulated in the regeneration-competent dorsal iris of the newt and is not present in its axolotl counterpart. SOCS4 on the other hand is higher in the regeneration incompetent newt ventral and axolotl dorsal iris. SOCS4 is a negative regulator of EGFR and cytokine signaling (such as interleukin 1) [14] and, therefore, the expression for both of them in the ventral iris of the newt and the axolotl is the expected one. In all, the present study shows that despite the obstacles posed by cross-species antibody microarray usage, subsequent experimentation with immunoblotting seems to accurately depict differences, in our case those related to the ability of lens regeneration in urodeles.
Acknowledgments
This work was supported by grant EY10540 to PAT.
Footnotes
Publisher's Disclaimer: This is a PDF file of an unedited manuscript that has been accepted for publication. As a service to our customers we are providing this early version of the manuscript. The manuscript will undergo copyediting, typesetting, and review of the resulting proof before it is published in its final citable form. Please note that during the production process errors may be discovered which could affect the content, and all legal disclaimers that apply to the journal pertain.
References
- 1.Tsonis PA. Limb Regeneration. Cambridge University Press; 1996. [Google Scholar]
- 2.Tsonis PA. Regeneration in vertebrates. Dev Biol. 2000;221(2):273–284. doi: 10.1006/dbio.2000.9667. [DOI] [PubMed] [Google Scholar]
- 3.Alvarado AS, Tsonis PA. Bridging the regeneration gap: genetic insights from diverse animal models. Nat Rev Genet. 2006;7(11):873–884. doi: 10.1038/nrg1923. [DOI] [PubMed] [Google Scholar]
- 4.Muneoka K, Han M, Gardiner DM. Sci Am. 2008;298(4):56–63. doi: 10.1038/scientificamerican0408-56. [DOI] [PubMed] [Google Scholar]
- 5.McHedlishvili L, Epperlein HH, Telzerow A, Tanaka EM. A clonal analysis of neural progenitors during axolotl spinal cord regeneration reveals evidence for both spatially restricted and multipotent progenitors. Development. 2007;134(11):2083–2093. doi: 10.1242/dev.02852. [DOI] [PubMed] [Google Scholar]
- 6.Del Rio-Tsonis K, Tsonis PA. Eye regeneration at the molecular age. Dev Dyn. 2003;226(2):211–224. doi: 10.1002/dvdy.10224. [DOI] [PubMed] [Google Scholar]
- 7.Tsonis PA, Del Rio-Tsonis K. Lens and retina regeneration: transdifferentiation, stem cells and clinical applications. Exp Eye Res. 2004;78(2):161–172. doi: 10.1016/j.exer.2003.10.022. [DOI] [PubMed] [Google Scholar]
- 8.Hayashi T, Mizuno N, Owaribe K, Kuroiwa A, Okamoto M, Kondoh H. FGF2 triggers iris-derived lens regeneration in newt eye. Mech Dev. 2004;121:519–526. doi: 10.1016/j.mod.2004.04.010. [DOI] [PubMed] [Google Scholar]
- 9.Tsonis PA, Vergara MN, Spence JR, Madhavan M, Kramer EL, Call MK, Santiago WG, Vallance JE, Robbins DJ, Del Rio-Tsonis K. A novel role of the hedgehog pathway in lens regeneration. Dev Biol. 2004;267(2):450–461. doi: 10.1016/j.ydbio.2003.12.005. [DOI] [PubMed] [Google Scholar]
- 10.Grogg MW, Call MK, Okamoto M, Vergara MN, Del Rio-Tsonis K, Tsonis PA. BMP inhibition-driven regulation of six-3 underlies induction of newt lens regeneration. Nature. 2005;438(7069):858–862. doi: 10.1038/nature04175. [DOI] [PMC free article] [PubMed] [Google Scholar]
- 11.Madhavan M, Haynes TL, Frisch NC, Call MK, Minich CM, Tsonis PA, Del Rio-Tsonis K. The role of Pax-6 in lens regeneration. Proc Natl Acad Sci USA. 2006;103(40):14848–14853. doi: 10.1073/pnas.0601949103. [DOI] [PMC free article] [PubMed] [Google Scholar]
- 12.Makarev E, Call MK, Grogg MW, Atkinson DL, Milash B, Odelberg SJ, Tsonis PA. Gene expression signatures in the newt irises during lens regeneration. FEBS Lett. 2007;581(9):1865–1870. doi: 10.1016/j.febslet.2007.03.082. [DOI] [PMC free article] [PubMed] [Google Scholar]
- 13.Tsonis PA, Call MK, Grogg MW, Sartor MA, Forge A, Fyffe R, Goldenberg R, Cowper-Sallari R, Tomlinson CR. microRNAs and regeneration: let-7 members as potential regulators of dedifferentiation in lens and inner ear hair cell regeneration of the adult newt. Biochem Biophys Res Commun. 2007;362(4):940–9455. doi: 10.1016/j.bbrc.2007.08.077. [DOI] [PMC free article] [PubMed] [Google Scholar]
- 14.Kario E, Marmor MD, Adamsky K, Citri A, Amit I, Amariglio N, Rechavi G, Yarden Y. Suppressors of cytokine signaling 4 and 5 regulate epidermal growth factor receptor signaling. J Biol Chem. 2005;280:7038–7048. doi: 10.1074/jbc.M408575200. [DOI] [PubMed] [Google Scholar]


