Abstract
Rationale and Objectives:
To convert and optimize our previously developed computerized analysis methods for use with images from full-field digital mammography (FFDM) for breast mass classification in order to aid in the diagnosis of breast cancer.
Materials and Methods:
An institutional review board approved protocol was obtained, with waiver of consent for retrospective use of mammograms and pathology data. Seven hundreds and thirty-nine full-field digital mammographic images, which contained 287 biopsy-proven breast mass lesions, of which 148 lesions were malignant and 139 lesions were benign, were retrospectively collected. Lesion margins were delineated by an expert breast radiologist and were used as the truth for lesion-segmentation evaluation. Our computerized image analysis method consisted of several steps: 1) identified lesions were automatically extracted from the parenchymal background using computerized segmentation methods; 2) a set of image characteristics (mathematical descriptors) were automatically extracted from image data of the lesions and surrounding tissues; and 3) selected features were merged into an estimate of the probability of malignancy using a Bayesian artificial neural network classifier. Performance of the analyses was evaluated at various stages of the conversion using receiver operating characteristic (ROC) analysis.
Results:
An AUC value of 0.81 was obtained in the task of distinguishing between malignant and benign mass lesions in a round-robin by case evaluation on the entire FFDM dataset. We failed to show a statistically significant difference (P value=0.83) as compared with results from our previous study in which the computerized classification was performed on digitized screen-film mammograms (SFMD).
Conclusion:
Our computerized analysis methods developed on digitized screen-film mammography can be converted for use with FFDM. Results show that the computerized analysis methods for the diagnosis of breast mass lesions on FFDM are promising, and can potentially be used to aid clinicians in the diagnostic interpretation of FFDM.
Keywords: Computer-aided diagnosis, Full-field digital mammography, Breast mass classification
INTRODUCTION
Breast cancer is the most frequently diagnosed cancer in women in the United States (1). An estimated 178,480 new cases of invasive breast cancer and 62,030 new cases of in situ breast cancer are expected to occur among women during 2007. An estimated 40,460 breast cancer deaths are expected in 2007 (1). Screening mammography has been the most effective tool for early cancer detection over the past several decades (2, 3), and it has been shown to reduce the cancer mortality by as much as 40% (4, 5). In addition, computer-aided detection (CADe) methods have been shown to improve the detection of more cancers in mammography screening (6, 7).
Once a lesion is detected, diagnostic imaging workup is performed in order to determine if a biopsy is warranted. Computer-aided diagnosis (CADx) has been proposed to aid the radiologist during diagnostic mammography interpretation (8). Most of the computerized analysis methods have been developed using databases of digitized screen-film mammograms (SFMD) (9-13). In recent years, full-field digital mammography (FFDM) has been approved by the Food and Drug Administration (FDA) for clinical use. There were 13,559 mammography units, in which 13.8% were FFDM units, as of October 1 of 2006 in the United States (14). Because of the digital nature of FFDM, it offers many advantages such as image storage, image transmission and retrieval, and digital image processing. With the easy access to digital images, computerized image analyses can be directly applied to FFDM without the need for film digitization, as is needed with screen-film mammography.
We have previously developed computerized analysis CADx methods for the interpretation of mammographic mass lesions in order to aid clinicians in the diagnosis of breast cancer (9, 15-19). Our initial development and evaluation were performed on digitized screen-film mammograms (20). It is important to note that the purpose of our current study is not to report on novel computerized analysis methods, but rather to convert and optimize our previously developed methods for the analysis of SFMD to those for FFDM. At the various stages of our conversion to FFDM, we evaluated the performance of the computerized methods in the task of distinguishing between malignant and benign mass lesions.
MATERIALS AND METHODS
Database
An institutional review board (IRB) approval was obtained for retrospective collection of mammograms and pathology data at the University of Chicago Hospitals. Data collection and usage were compliant with the Health Insurance Portability and Accountability Act (HIPAA) regulations. The full-field digital mammograms used in this study were acquired with a GE (Waukesha, WI) Senographe 2000D FFDM system in the Department of Radiology at the University of Chicago Medical Center. The FFDM images were acquired at 12-bit quantization with a pixel size of 100 μm.
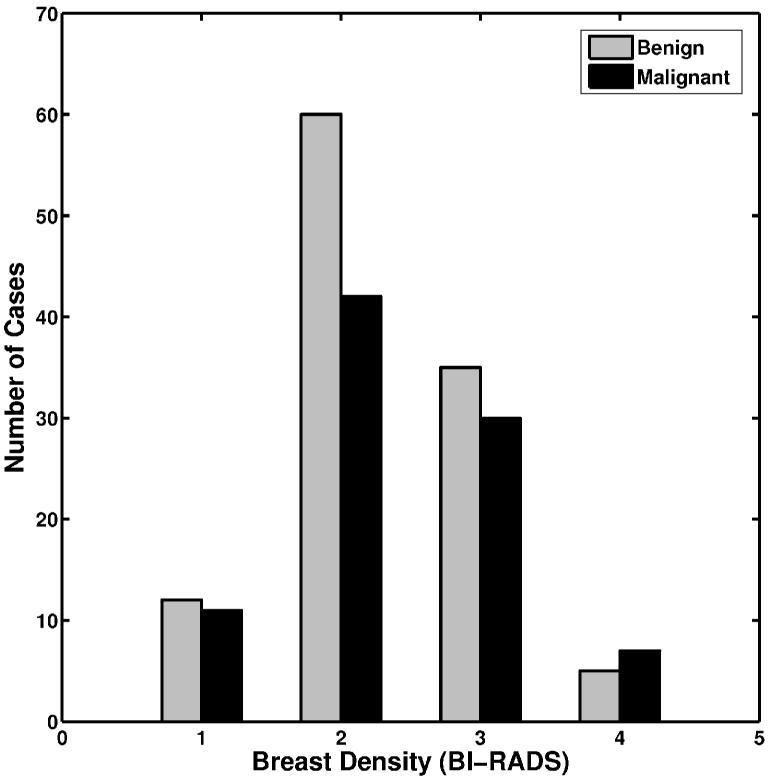
A total of 739 FFDM images were obtained. There were 287 biopsy-proven mass lesions, of which 148 lesions (412 images) were malignant and 139 lesions (327 images) were benign. These FFDM images were diagnostic exams and performed between 2002 and 2005 from 190 patients. The number of images per lesion varied from one to thirteen, including both standard views and special views. Most lesions had two to three images available for the study. All lesions were outlined by an expert breast imaging radiologist. The distribution of breast density for these cases in terms of Breast Imaging Report and Data System (BI-RADS) is shown in Figure 1.
Figure 1.
The distribution of breast density in terms of BI-RADS for the lesions in the entire dataset.
Computerized classification methods
The computerized analysis method for mammographic lesions was initially developed and evaluated on digitized screen film mammograms, and has been reported elsewhere (9,16,18-20). The method consists of several steps: (a) automated extraction of the lesion from the surrounding parenchymal background; (b) automatic lesion feature extraction in terms of mathematical descriptors; and (c) merging of lesion features into an estimate of the probability of malignancy (PM).
For a given lesion, the analysis proceeds as follows. First, the center of the lesion is manually indicated, and then automatic lesion segmentation is performed. The automatic lesion segmentation method is based on a multi-transition-point, gray-level, region-growing technique, and has been described in detail elsewhere (9). It is important to note that the same segmentation parameters from our previous SFMD study were applied on the FFDM images. Segmentation performance is assessed using an area overlap measure (21), which is calculated by the ratio of the area within the intersection of the human-delineated margin and the computer-determined margin to the union of these two regions. Once segmented, various features (mathematical descriptors) are then automatically extracted to quantify the characteristics of the lesion and its local environment (surrounding tissue). The detailed descriptions of these features can be found elsewhere (16,22). The features are then merged using a Bayesian artificial neural network (BANN) classifier to generate an estimate of probability of malignancy (23).
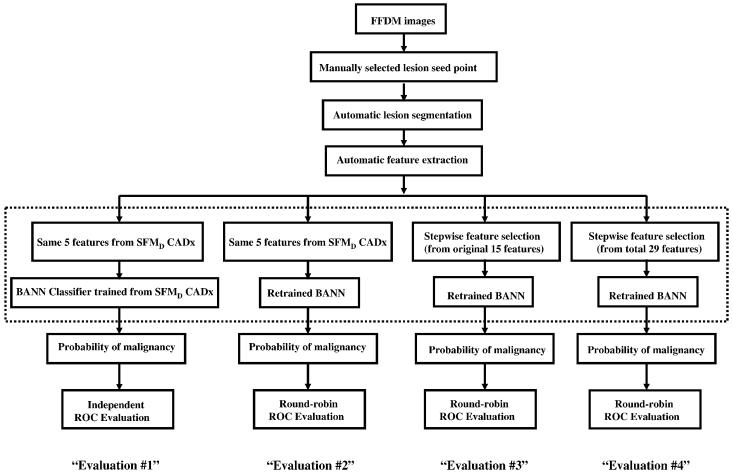
In this study, we investigated the computerized image analysis scheme at various stages in the conversion from SFMD to FFDM, as shown in Figure 2. The first evaluation (Evaluation #1) was performed on FFDM images without any retraining and/or calibration of the computerized image analysis method that was previously developed using digitized screen-film mammograms (SFMD). The same five image features used in our previous SFMD study (20) were extracted. These features were used to quantify spiculation, margin sharpness, texture, shape, and gray level in the mammographic lesions and surrounding tissues. The same neural network classifier weights generated with the previous SFMD training database were applied in this FFDM evaluation. Basically, this was an independent testing of the SFMD-developed CADx on the FFDM dataset. The next evaluation (Evaluation #2) consisted of retraining the BANN using FFDM images. The only difference from Evaluation #1 was the classifier weights. In this approach, the same five features used in the SFMD study were extracted from the FFDM images, and the neural network classifier was retrained with these five features to generate new classifier weights. The third evaluation (Evaluation #3) included both reselecting features and using these reselected features to retrain the BANN on the FFDM images. In this approach, all fifteen features that were previously developed on SFMD were extracted. Stepwise feature selection was employed using the Wilks lambda criterion (24,25) to select a subset of features for the classification task. The selected features were merged with a BANN classifier.
Figure 2.
Evaluations of the computerized analysis at various stages of conversion from SFMD to FFDM.
To further optimize the computerized image analysis method, fourteen new image features (22) were also extracted from the FFDM images. Linear stepwise feature selection was performed on all twenty-nine features including both previously developed features on SFMD (16) and new image features (22). The BANN was retrained with the selected features to generate an estimate of probability of malignancy (Evaluation #4).
Performance evaluation and statistical analysis
The performance of each classifier, in the task of distinguishing between malignant and benign mass lesions, was evaluated using receiver operating characteristic (ROC) analysis (26-29), with the area under the ROC curve (AUC) used as a figure of merit. The leave-one-out (round-robin) by lesion method (30) was used in the performance evaluation for each classifier. Leave-one-out by lesion requires all images of a lesion to be removed while training with all other images. The trained classifier is then run on images of the lesion removed. The level of statistical significance among different classifiers was calculated using the ROCKIT computer program (31).
RESULTS
The performance of lesion segmentation in terms of percentage of lesion images accurately segmented at an overlap threshold cutoff of 0.4, are 68.9%, 66.0%, and 72.5% for all lesions, malignant lesions, and benign lesions, respectively.
Performance results of the CADx method at various stages of conversion are given in Table 1. As expected, due to the difference acquisition detectors for SFMD and FFDM, in Evaluation #1, a low AUC value of 0.74 was obtained in the task of differentiating between malignant and benign lesion on the FFDM dataset. It is important to emphasize that in this independent evaluation, the five lesion features used and the trained neural network classifier weights were obtained on a prior SFMD training dataset, i.e., without any retraining or recalibration.
Table 1.
Performances for the CADx method at various stages of conversion in the task of distinguishing between malignant and benign lesions. Here, “by case” round-robin analysis was performed on the FFDM dataset (N= 287 breast mass lesions). “SFMD” refers to features or classifier weights obtained previously with the screen-film trained method.
| Classifiers | Training Cases |
Feature Selection |
Classifier Weights |
Testing Cases |
Testing Methods |
AUC ± SE | 95 % C.I. |
|---|---|---|---|---|---|---|---|
| Evaluation #1 | SFMD | SFMD | SFMD | FFDM | independent | 0.74 ± 0.03 | [0.69, 0.80] |
| Evaluation #2 | FFDM | SFMD | FFDM | FFDM | round-robin by case |
0.77 ± 0.03 | [0.72, 0.82] |
| Evaluation #3 | FFDM | FFDM (15 features) |
FFDM | FFDM | round-robin by case |
0.78 ± 0.03 | [0.73, 0.83] |
| Evaluation #4 | FFDM | FFDM (29 features) |
FFDM | FFDM | round-robin by case |
0.81 ± 0.03 | [0.76, 0.86] |
| Prior Evaluation for comparison* |
SFMD | SFMD | SFMD | SFMD | independent | 0.81 ± 0.05 | [0.69, 0.88] |
reference #20
For Evaluation #2, an AUC value of 0.77 were obtained from ROC analyses in the task of differentiating between malignant and benign lesions on FFDM dataset from the leave-one-out by case analysis. Recall that only the artificial neural network was retrained on the FFDM images, but the features were those selected from our previous SFMD study. Classifier retraining is necessary for the conversion of our computerized image analysis methods from SFMD to FFDM, since there are intrinsic differences in the physical image quality between SFMD and FFDM systems (32).
For Evaluation #3, three features were selected from all fifteen previously developed image features. These features were shape, texture, and contrast and they were used to quantify the characteristics of the lesions and local environment. The neural network classifier was retrained with these three lesion features. An AUC value of 0.78 was obtained from ROC analyses for the leave-one-out by case evaluation method.
For Evaluation #4, from the 29 features, five image features were selected from the feature selection. These five features were margin sharpness, shape, size, texture, and gray level that were used to characterize mass lesions and local tissues. The BANN was retrained with these five features. An AUC value of 0.81 was obtained from ROC analyses with the leave-one-out by case analysis.
In our previous study on SFMD with an independent set of 97 lesions (20), an AUC value of 0.81 was achieved from the ROC analysis in the task of distinguishing between malignant and benign lesions.
Statistical assessments were performed on the differences in the performance measures in terms of AUC values obtained from the classifiers at the various conversion steps. The results are given in Table 2. Interestingly, we failed to show a statistically significant difference (overall αT = 0.05) between the independent testing (Evaluation #1) and the retrained methods on FFDM (Evaluation #2, #3, #4) and our prior evaluation on SFMD in the task of distinguishing between malignant and benign lesions.
Table 2.
Statistical analysis results for differences in the performance among different neural network classifiers that were used in SFMD and FFDM studies. From ROCKIT, P values were calculated for differences in the classification performance for a pair of neural network classifiers. The significance level α for the individual test was calculated using Holm's procedure (overall αT =0.05) for multiple tests of significance.42
| Evaluation #1 (FFDM) |
Evaluation #2 (FFDM) |
Evaluation #3 (FFDM) |
Evaluation #4 (FFDM) |
Prior evaluationa (SFMD) |
|
|---|---|---|---|---|---|
| Evaluation #1 (FFDM) | – | 0.20 | 0.17 | 0.016 (α = 0.005) |
0.32 |
| Evaluation #2 (FFDM) | – | – | 0.70 | 0.09 | 0.66 |
| Evaluation #3 (FFDM) | – | – | – | 0.16 | 0.77 |
| Evaluation #4 (FFDM) | – | – | – | – | 0.83 |
| Prior evaluation* (SFMD) | – | – | – | – | – |
Reference #20
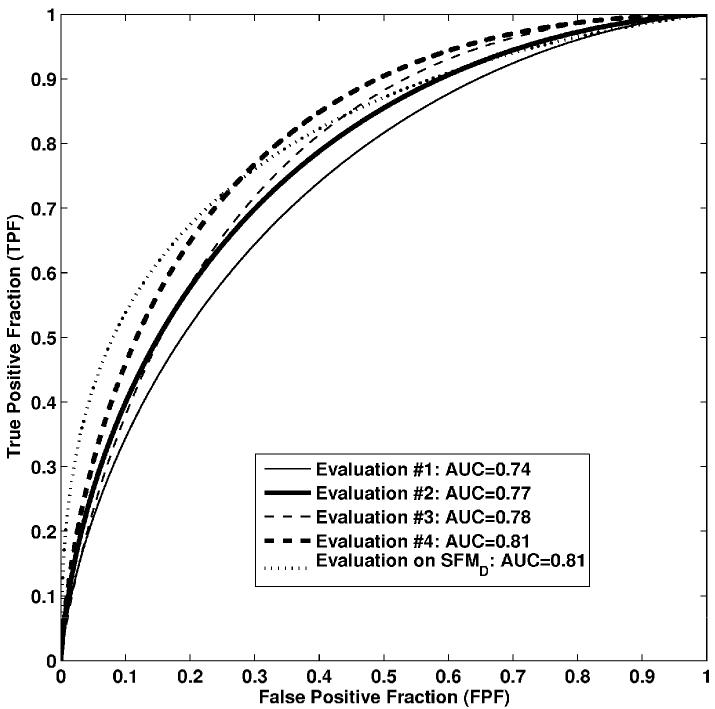
The low classification performance with Evaluation #1 on FFDM was expected since there were no retraining and recalibration for this approach. However, we failed to show a statistically significant difference between the reoptimization approach (Evaluation #4) and the SFMD method (Evaluation #1) applied to FFDM in the task of distinguishing between malignant and benign lesions (p-value = 0.016 and α = 0.005). It is very encouraging that by just retraining the previous developed SFMD classifier on FFDM, a similar classification performance was achieved. The classification performance comparison of computerized image analysis methods performed on FFDM in this study and our prior evaluation on SFMD (20) in terms of ROC curves is shown in Figure 3.
Figure 3.
ROC curves of computerized image analysis methods performed on FFDM in this study and on SFMD from previous study. Evaluation on SFMD was reported in reference #20. Confidence intervals are given in Table 1.
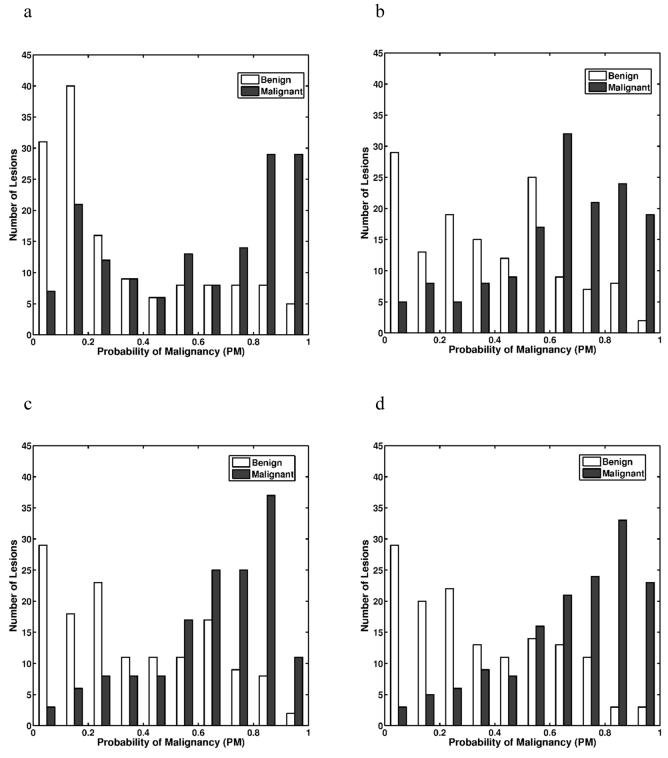
The probability of malignancy distributions from various BANN classifiers at the various stages of conversion is shown in Figure 4. The separation between malignant and benign lesion gradually increased from Evaluation #1 to Evaluation #4, showing a trend towards improved classification performance.
Figure 4.
The distributions of the output PMs (probability of malignancy) obtained with the various Bayesian artificial neural network classifiers: (a) Evaluation #1; (b) Evaluation #2; (c) Evaluation #3; and (d) Evaluation #4. Output PMs are those from round-robin by case analyses.
DISCUSSION
In this study, we progressively evaluated our computer-aided diagnosis method on FFDM images in the classification of mammographic mass lesions. Our computerized image analysis methods were previous developed and evaluated on digitized screen-film mammograms. However, by retraining and recalibrating those existing computerized methods, similar classification performance was achieved on FFDM images. Hence, the results from this study are encouraging. It is very important to note that by simply retraining the previous developed CADx, we can achieve a similar classification performance on FFDM as on SFMD. Our results indicate that computer-aided diagnosis methods developed for SFMD can be converted for analysis of FFDM. It is apparent from this study that computerized image analysis techniques for SFMD and FFDM are similar. However, with our database of 287 actual lesions, the statistical power for demonstrating the statistical significance of the difference between the AUC values for Evaluation #1 (AUC = 0.74) and for Evaluation #4 (AUC = 0.81) is 76% at α = 0.05, so we believe that reoptimization is still necessary to warrant the high classification performance. Other studies have also found that reoptimization is necessary for converting computer image analysis methods from SFMD images to FFDM images (33, 34). However, one study showed similar performance in classifying calcifications in FFDM as malignant or benign without requiring optimizing from its initial development on SFMD (35). Also, we want to point out here that similar breast mass lesion classification performance was achieved both on FFDM and SFMD images in our study, the similar results were also reported by several other groups (36-41), no statistically significant difference in diagnostic performances between FFDM and SFMD were detected. We believe that further research is needed on the assessment of CAD system performance on both SFMD and FFDM images.
The results from this study are very similar to those that we found previously on SFMD. This is very exciting and important since the prior results were on screen-film mammography and these are on FFDM. By simply retraining the previously developed computerized classification methods, we can achieve a similar classification performance on FFDM as on screen-film mammograms. The results from this study demonstrate the robustness of our breast mass lesion classification method, and move CADx for FFDM one step closer to clinical incorporation.
The lower classification performance from Evaluation #1 is expected, since there are differences in the physical image quality between the SFMD and FFDM systems. The SFMD exhibits higher spatial resolution, increased noise, and lower contrast as compared to FFDM system (32). In addition, there was no retraining and recalibrating on previous developed computerized image analysis methods from SFMD study for Evaluation #1. However, we failed to show a statistically significant difference between Evaluation #1 and our prior evaluation on SFMD. This may due to the small dataset in our previous SFMD study, which resulted in larger standard error from ROC analysis. We expect to observe a statistically significant difference if the larger dataset was used.
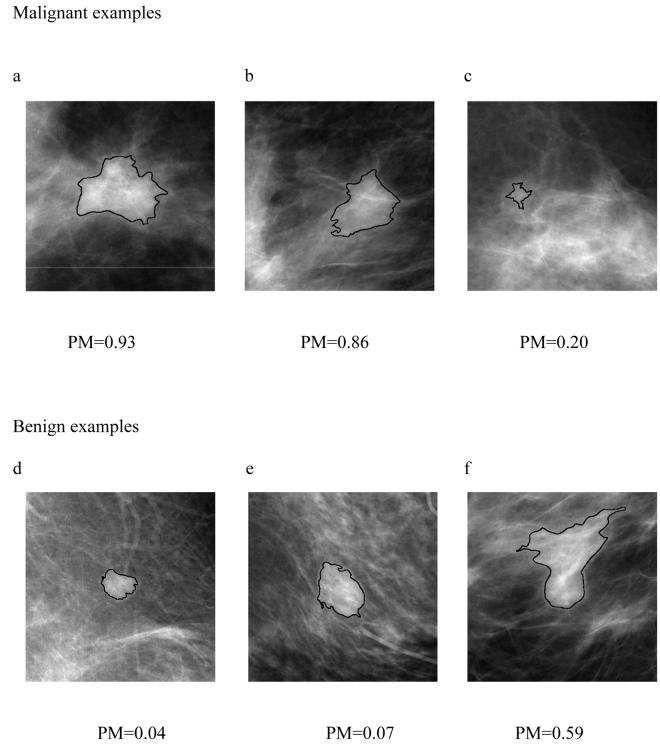
Several ROI examples are shown in Figure 5. The computer-generated lesion contours are superimposed on mammographic lesions. The estimate of the probability of malignancies (PM) for each individual lesion was generated from the neural network classifier in Evaluation #4. The correctly-segmented malignant or benign lesions contours yield correct lesion features (mathematical descriptors), and thus reliable PM values (Figure 5a, 5b, 5d, 5e). On the other hand, the overlap of mammographic lesion and background parenchyma resulted in an under-segmented contour (Figure 5c) and an over-segmented lesion contour (Figure 5f), thus yielding erroneous computer-extracted features and unreliable PM values. Further improved computerized lesion segmentation methods may improve our computerized lesion classification performance.
Figure 5.
Selected ROI examples with computer generated lesion contours. PM values are the estimate of probability of malignancies generated from computerized image analysis methods used in Evaluation #4.
The digital nature of FFDM allows us to manage digital data more efficient, as for screen-film mammograms, digitization is needed before any computerized methods can be applied. Thus, computerized image analysis methods may be easily incorporated into existing FFDM systems in the diagnostic breast imaging area. Further research work will be needed to perform extensive training and independent testing on an even larger dataset to ensure the robustness of our computer-aided diagnosis methods.
ACKNOWLEDGEMENTS
This work was supported in parts by USPHS Grants R01-CA89452, R21-CA113800, and P50-CA125183. M. L. Giger is a shareholder in R2/Hologic, Inc. (Sunnyvale, CA). It is the policy of the University of Chicago that investigators disclose publicly actual or potential significant financial interests that may appear to be affected by the research activities.
Footnotes
Publisher's Disclaimer: This is a PDF file of an unedited manuscript that has been accepted for publication. As a service to our customers we are providing this early version of the manuscript. The manuscript will undergo copyediting, typesetting, and review of the resulting proof before it is published in its final citable form. Please note that during the production process errors may be discovered which could affect the content, and all legal disclaimers that apply to the journal pertain.
REFERENCES
- 1.Jemal A, Siegel R, Ward E, et al. Cancer statistics, 2007. CA Cancer J Clin. 2007;57:43–66. doi: 10.3322/canjclin.57.1.43. [DOI] [PubMed] [Google Scholar]
- 2.Chlebowski RT. Breast cancer risk reduction Strategies for women at increased risk. Ann Rev Med. 2002;53:519–540. doi: 10.1146/annurev.med.53.082901.103925. [DOI] [PubMed] [Google Scholar]
- 3.Boyd NF, Lockwood GA, Martin LJ, et al. Mammographic densities and breast cancer risk. Breast Disease. 1998;10:113–126. doi: 10.3233/bd-1998-103-412. [DOI] [PubMed] [Google Scholar]
- 4.Kerlikowske K, Grady D, Rubin SM, et al. Efficacy of screening mammography: A meta-analysis. JAMA. 1995;273:149–154. [PubMed] [Google Scholar]
- 5.Hendrick RE, Smith RA, Rutledge JH, III, et al. Benefit of screening mammography in women aged 40-49: a new meta-analysis of randomized controlled trials. J Natl Cancer Inst Monogr. 1997;22:87–92. doi: 10.1093/jncimono/1997.22.87. [DOI] [PubMed] [Google Scholar]
- 6.Ciatto S, Rosselli DTM, Burke P, et al. Comparison of standard and double reading and computer-aided detection (CAD) of interval cancers at prior negative screening mammograms: blind review. Br J Cancer. 2003;89:1645–1649. doi: 10.1038/sj.bjc.6601356. [DOI] [PMC free article] [PubMed] [Google Scholar]
- 7.Nishikawa RM. Current status and future directions of computer-aided diagnosis in mammography. Comput Med Imaging Graph. 2007;31:224–235. doi: 10.1016/j.compmedimag.2007.02.009. [DOI] [PubMed] [Google Scholar]
- 8.Giger ML. Computerized analysis of images in the detection and diagnosis of breast cancer. Semin Ultrasound CT MRI. 2004;25:411–418. doi: 10.1053/j.sult.2004.07.003. [DOI] [PubMed] [Google Scholar]
- 9.Huo Z, Giger ML, Vyborny CJ, et al. Analysis of speculation in the computerized classification of mammographic masses. Med Phys. 1995;22:1569–1579. doi: 10.1118/1.597626. [DOI] [PubMed] [Google Scholar]
- 10.Hadjiiski L, Sahiner B, Helvie MA, et al. Breast masses: computer-aided diagnosis with serial mammograms. Radiology. 2006;240:343–56. doi: 10.1148/radiol.2401042099. [DOI] [PubMed] [Google Scholar]
- 11.Lo JY, Baker JA, Kornguth PJ, Floyd CE., Jr Computer-aided diagnosis of breast cancer: artificial neural network approach for optimized merging of mammographic features. Acad Radiol. 1995;2:841–50. doi: 10.1016/s1076-6332(05)80057-1. [DOI] [PubMed] [Google Scholar]
- 12.Zheng B, Chang YH, Gur D. Adaptive computer-aided diagnosis scheme of digitized mammograms. Acad Radiol. 1996;3:806–14. doi: 10.1016/s1076-6332(96)80270-4. [DOI] [PubMed] [Google Scholar]
- 13.Veldkamp WJH, Karssemeijer N, Otten JDM, Hendriks JHCL. Automated classification of clustered microcalcifications into malignant and benign types. Med Phys. 2000;27:2600–2608. doi: 10.1118/1.1318221. [DOI] [PubMed] [Google Scholar]
- 14.Update on Accreditation of Screen-Film and Digital Mammography. :RC221. American College of Radiology web site. http://www.acr.org/accreditation/mammography/documents/2006_map_update.pdf. Published November 27, 2006. Accessed December 4, 2006.
- 15.Giger ML, Huo Z, Kupinski MA, Vyborny CJ. In: Handbook of Medical Imaging. Sonka M, Fitzpatrick MJ, editors. SPIE; Bellingham, WA: 2000. pp. 915–1004. [Google Scholar]
- 16.Huo Z, Giger ML, Vyborny CJ, et al. Automated computerized classification of malignant and benign masses on digitized mammograms. Acad Radiol. 1998;5:155–168. doi: 10.1016/s1076-6332(98)80278-x. [DOI] [PubMed] [Google Scholar]
- 17.Huo Z, Giger ML, Metz CE. Effect of dominant features on neural network performance in the classification of mammographic lesions. Phys Med Biol. 1999;44:2579–2595. doi: 10.1088/0031-9155/44/10/315. [DOI] [PubMed] [Google Scholar]
- 18.Huo Z, Giger ML, Vyborny CJ, et al. Computerized classification of benign and malignant masses on digitized mammograms: a study of robustness. Acad Radiol. 2000;7:1077–1084. doi: 10.1016/s1076-6332(00)80060-4. [DOI] [PubMed] [Google Scholar]
- 19.Huo Z, Giger ML, Vyborny CJ. Computerized analysis of multiple-mammographic views: potential usefulness of special view mammograms in computer-aided diagnosis. IEEE Trans Med Imaging. 2001;20:1285–92. doi: 10.1109/42.974923. [DOI] [PubMed] [Google Scholar]
- 20.Horsch K, Giger ML, Vyborny CJ, et al. Classification of breast lesions with multimodality computer-aided diagnosis: observer study results on an independent clinical data set. Radiology. 2006;240(2):357–368. doi: 10.1148/radiol.2401050208. [DOI] [PubMed] [Google Scholar]
- 21.Kupinski MA, Giger ML. Automated seeded lesion segmentation on digital mammograms. IEEE Trans Med Imaging. 1998;17:510–517. doi: 10.1109/42.730396. [DOI] [PubMed] [Google Scholar]
- 22.Chen W, Giger ML, Li H, et al. Volumetric texture analysis of breast lesions on contrast-enhanced magnetic resonance images. Magnetic Resonance Medicine. 2007;58:562–571. doi: 10.1002/mrm.21347. [DOI] [PubMed] [Google Scholar]
- 23.Bishop C. Neural network for pattern recognition. Oxford University Press; Oxford: 1995. [Google Scholar]
- 24.Huberty CJ. Applied discriminant analysis. Wiley; New York: 1994. [Google Scholar]
- 25.Lachenbruch PL. Discriminant analysis. Hafner; London, England: 1975. [Google Scholar]
- 26.Metz CE. ROC methodology in radiographic imaging. Invest Radiol. 1986;21:70–733. doi: 10.1097/00004424-198609000-00009. [DOI] [PubMed] [Google Scholar]
- 27.Metz CE. Some practical issues of experimental design and data analysis in radiological ROC studies. Invest Radiol. 1989;24:234–245. doi: 10.1097/00004424-198903000-00012. [DOI] [PubMed] [Google Scholar]
- 28.Metz CE, Herman BA, Shen J. Maximum-likelihood estimation of receiver operating characteristic (ROC) curves from continuously distributed data. Stat Med. 1998;17:1033–1053. doi: 10.1002/(sici)1097-0258(19980515)17:9<1033::aid-sim784>3.0.co;2-z. [DOI] [PubMed] [Google Scholar]
- 29.Pesce LL, Metz CE. Reliable and computationally efficient maximum-likelihood estimation of “proper” binormal ROC curves. Acad Radiol. 2007;14:814–829. doi: 10.1016/j.acra.2007.03.012. [DOI] [PMC free article] [PubMed] [Google Scholar]
- 30.Lachenbruch PA, Mickey MR. Estimation of error rates in discriminant analysis. Technometrics. 1968;10:1–11. [Google Scholar]
- 31.ROC software. University of Chicago web site. http://www-radiology.uchicago.edu/krl/roc_soft6.htm. Accessed February 23, 2007.
- 32.Li H, Giger ML, Yuan Y, et al. Comparison of computerized image analyses for digitized screen-film mammograms and full-field digital mammography images. Digital Mammography IWDM. 2006;LNCS 4046:569–575. [Google Scholar]
- 33.Li L, Clark RA, Thomas JA. Computer-aided diagnosis of masses with full-field digital mammography. Acad Radiol. 2002;9:4–12. doi: 10.1016/s1076-6332(03)80290-8. [DOI] [PubMed] [Google Scholar]
- 34.Ge J, Sahiner B, Hadjiiski LM, et al. Computer aided detection of clusters of microcalcifications on full field digital mammograms. Med Phys. 2006;33:2975–2988. doi: 10.1118/1.2211710. [DOI] [PubMed] [Google Scholar]
- 35.Rana RS, Jiang Y, Schmidt RA, et al. Independent evaluation of computer classification of malignant and benign calcifications in full-field digital mammograms. Acad Radiol. 2007;14:363–370. doi: 10.1016/j.acra.2006.12.012. [DOI] [PMC free article] [PubMed] [Google Scholar]
- 36.Sun X, Qian W, Song X, Qian Y, Song D, Clark RA. Computer-aided detection (CAD) of breast cancer on full field digital and screening film mammograms. Proc SPIE. 5032:930–939. [Google Scholar]
- 37.Wei J, Hadjiiski LM, Sahiner B, et al. Computer-aided detection system for breast masses: comparison of performances on full-field digital mammograms and digitized screen-film mammograms. Acad Radiol. 2007;14:659–669. doi: 10.1016/j.acra.2007.02.017. [DOI] [PMC free article] [PubMed] [Google Scholar]
- 38.Pisano E, Gatsonis C, Hendrick E, et al. Diagnostic performance of digital versus film mammography for breast-cancer screening. N Engl J Med. 2005;353:1773–1783. doi: 10.1056/NEJMoa052911. [DOI] [PubMed] [Google Scholar]
- 39.Cole E, Pisano ED, Brown M, et al. Diagnostic accuracy of Fischer SenoScan digital mammography versus screen-film mammography in a diagnostic mammography population. Acad Radiol. 2004;11:879–886. doi: 10.1016/j.acra.2004.04.003. [DOI] [PubMed] [Google Scholar]
- 40.Seo K, Pisano ED, Kuzmiak CM, et al. The positive predictive value for diagnosis of breast cancer: full-field digital mammography versus film-screen mammography in the diagnostic mammographic population. Acad Radiol. 2006;13:1229–1235. doi: 10.1016/j.acra.2006.07.007. [DOI] [PubMed] [Google Scholar]
- 41.Lewin JM, D'Orsi CJ, Hendrick RE, et al. Clinical comparison of full-field digital mammography and screen-film mammography for detection of breast cancer. AJR. 2002;179:671–677. doi: 10.2214/ajr.179.3.1790671. [DOI] [PubMed] [Google Scholar]
- 42.Holm S. A simple sequentially rejective multiple test procedure. Scand J Stat. 1979;6:65–70. [Google Scholar]


