

Abstract
Kinesin-5 inhibitors (K5Is) are promising anti-mitotic cancer drug candidates. They cause prolonged mitotic arrest and death of cancer cells, but their full range of phenotypic effects in different cell types has been unclear. Using time-lapse microscopy of cancer and normal cell lines, we find that a novel K5I causes several different cancer and non-cancer cell types to undergo prolonged arrest in monopolar mitosis. Subsequent events, however, differed greatly between cell types. Normal diploid cells mostly slipped from mitosis and arrested in tetraploid G1, with little cell death. Several cancer cell lines either died during mitotic arrest, or following slippage. Contrary to prevailing views, mitotic slippage was not required for death, and the duration of mitotic arrest correlated poorly with the probability of death in most cell lines. We also assayed drug reversibility, and long-term responses after transient drug exposure in MCF7 breast cancer cells. While many cells divided after drug washout during mitosis, this treatment resulted in lower survival compared to washout after spontaneous slippage, likely due to chromosome segregation errors in the cells that divided. Our analysis shows that K5Is cause cancer-selective cell killing, provides important kinetic information for understanding clinical responses, and elucidates mechanisms of drug sensitivity versus resistance at the level of phenotype.
Keywords: experimental therapeutics, mitotic drugs, Kinesin-5, live-cell imaging
Introduction
Anti-mitotic drugs that directly target microtubules, like taxanes and the Vinca alkaloids, have been used extensively to treat cancers (1, 2). These drugs cause programmed cell death directly from mitotic arrest, or death following ‘slippage’ from mitotic arrest (3). Slippage appears to require proteolysis of cyclin-B1 (3, 4), but whether slippage influences death directly is unclear. In addition to tubulin, many proteins are required for successful mitosis, and small molecule inhibitors have been developed for some of these. Currently, druggable targets in the mitotic spindle include the kinases AuroraA, AuroraB, and PLK1, the kinesin family molecular motor Kinesin-5 (Kif11, HsEg5, KSP1) and CenpE (5, 6). The hope in targeting these proteins was to develop anti-mitotic drugs as effective as taxanes and vincas, but lacking their neurotoxicity and other side effects on non-proliferating tissues. Here, we focus on inhibitors of Kinesin-5 (K5Is). Several K5Is have been reported; they are effective at treating xenograft cancers in mice, and have shown promise in clinical trials, mainly in slowing disease progression (5).
Kinesin-5 is a tetrameric, plus-end directed motor that pushes the duplicated centrosomes apart during assembly of the bipolar mitotic spindle. K5Is arrest cells in mitosis with the centrosomes located at the central focus of a monopolar microtubule array (7, 8). The fate of cells following monopolar mitotic arrest has only recently begun to be explored. KSP-1A, a dihydropyrrole K5I that binds to an allosteric site, caused death of several cancer cell lines (9, 10). Experiments with synchronized cells suggested that prolonged mitotic arrest and slippage were both required for induction of caspase-3 dependent apoptosis by the mitochondrial pathway. A requirement for slippage to trigger death would make K5Is different from anti-microtubule drugs, that can also kill cells directly within mitosis (3). A study using the low-affinity allosteric K5I monastrol also reported apoptosis in HeLa cells, but in this case neither a normal checkpoint nor slippage were required (11). This would imply even larger differences from anti-microtubules drugs, but monastrol is a low affinity K5I, and may well have toxic off-target effects. A concern with published studies is their reliance on thymidine synchronization that could induce DNA damage, and their use of immunoblotting to score responses, which averages cell populations. Because the timing of events is likely highly variable between individual cells, this averaging tends to obscure the kinetics of cell cycle transitions and cell death and it is not possible using blotting to directly test relationships between mitotic arrest and death.
To resolve these issues, we systematically investigated the effects of a novel, high-affinity K5I in tumor xenografts and multiple cell lines in culture using long-term time-lapse microscopy to score the response of individual cells. Solid tumor-derived HeLa, HT29, MCF7, and Colo 205 as well as telomerase-immortalized, non-transformed N/TERT-1 and RPE1 cells were used due to their potential range of death sensitivity - HeLa and HT29 are death responsive whereas MCF7 lack caspase 3 and are death resistant. HL60 were used as a leukemia cell line (acute promyelocytic leukemia) and because they are promyeloblasts that can be induced to differentiate into neutrophils (12), potentially recapitulating the response of dividing pre-neutrophils. Because anti-mitotic drugs are usually administered periodically in the clinic, we also addressed effects of drug washout on phenotypic response and survival.
Material and Methods
Cell lines
Colo 205, HeLa H2b-GFP, HL60, HT29, U-2 OS, and RPE1 were grown according to ATCC in medium from Mediatech, Inc. N/TERT-1 (Jim Rheinwald, Brigham and Womens Hospital) were grown in KerSFM medium supplemented with 25 μg/ml bovine pituitary extract (GIBCO), 0.2 ng/ml EGF (GIBCO) and 0.3 mM CaCl2.
Immunofluorescence microscopy
Cells on glass coverslips were fixed in −20°C methanol for 5 min, washed in PBS, blocked in 4% BSA fraction V in PBS for 30 min, and labeled with α-tubulin (Sigma, DM1A), phospho-histone H3 (Upstate Biotech), centrin (Groen and Mitchison) and/or CREST antibodies at 1 μg/ml. Cells were washed in PBS and labeled with secondary antibodies conjugated to Alexa488, 594 or 647 (Invitrogen). After washing in PBS, DNA was stained with 1 μg/ml TO-PRO3 (Invitrogen) for 2 min. Cells were mounted on glass microscope slides (ProlongGold, Invitrogen). Cells were imaged using MetaMorph (Molecular Devices) and a Nikon 90i epifluorescent or TE2000 spinning disc confocal microscope with Hamamatsu ORCAII or ORCA-ER CCD cameras and 100X 1.4NA lenses. Cells recovering from drug treatment were washed 5X in medium and fixed 2h or 4h later.
Live-cell imaging and analysis
Adherent cells were in growth medium containing 20mM HEPES pH7.6 or CO2-independent medium (Invitrogen) with 10% FBS, P/S and 4mM glutamine in glass-bottom dishes (MatTek). 100,000 HL60 cells in 200 μl PBS were immobilized by binding to CellTak coated (3.5 μg/cm2 for 1 h, Bectin Dickinson) MatTek dishes for 5 min. A Nikon TE2000 microscope with a heated stage, humidified 5% CO2 chamber, and motorized X, Y and Z stage was used. Movies were acquired using a Hamamatsu ORCAII camera and 20X Ph2 or 20X DIC, NA0.75 lens at 1 frame per 10 min, bin 2 × 2. Mineral oil (Sigma) further prevented evaporation. For cells recovering from drug, cells were treated for 24h or 48h, washed 5X in normal medium and imaged. Time-lapses were viewed using MetaMorph or ImageJ and phenotypes were scored and analyzed using Excel (Microsoft), MatLab and Intercooled Stata 8.0.
Colony growth assay
After live-imaging 48h of recovery, cells were seeded at 50,000 per dish into 35mm gridded glass-bottomed dishes (MatTek). 14 random positions in the grids, from three separate experiments for each condition, were imaged with a 10X Ph1 NA0.4 lens daily for 8 days and the cells at each position were scored.
Results
A novel K5I causes monopolar mitotic arrest in culture and cancer xenografts
We used three structurally distinct K5Is. Two were novel chemical scaffolds from Merck Serono (Darmstadt, Germany), a hexahydropyranoquinoline (EMD534085), and an indane hydrochloride (EMD596414). The structures of these compounds will be published elsewhere (Zenke et al., in preparation). As a control we used the known K5I S-trityl-L-cysteine (stlc) (13). To measure dose-response we performed titration experiments on solid tumor cell lines, scoring for monopolar mitotic arrest. Figure 1 shows data from U-2 OS osteosarcoma cells. All three K5Is caused mitotic arrest with a monopolar phenotype. EMD534085 was the most potent, with an EC50 (50% of mitotic cells at 4h drug treatment were monopolar) for monopolarity of ∼70nM (Fig. 1C). The EC50 for EMD596414 and stlc were ∼200 and ∼500nM, respectively. EC50 values were found to vary by only ∼2-fold for EMD534085 in HeLa, HT29, MCF7, HL60, Colo 205, N/TERT-1 and RPE1 cells (ref 17 and data not shown). Unless otherwise stated, in all subsequent in vitro experiments we used 500nM EMD534084 in order to evaluate the maximum achievable drug response for each cell line. Because the EC50 values vary little between cell lines for EMD534085, 500nM is essentially equipotent for all cell lines.
Figure 1. EMD534085 and EMD596414 are potent K5Is, resulting in monopolar mitotic arrest.

Control or K5I-treated U-2 OS cells were fixed and stained with antibodies against -tubulin and centrin. DNA was stained with Hoecsht. A) Normal bipolar mitotic spindle. B) Monopolar mitotic spindle in a cell treated with 500nM EMD534085 for 4h. C) Non-synchronized cells treated for 4h with 0, 1, 10, 100, 500, 1,000 and 10,000nM EMD534085, EMD596414 or S-trityl-L-cysteine (stlc). All drugs induced mitotic arrest and EMD534085 was the strongest, EC50 for monopoles = ∼70nM, EMD596414 EC50 = ∼200nM, and stlc EC50 = ∼400nM. EMD534085, EMD596414 and stlc were saturating at ∼500nM, ∼500nM, and ∼1,000nM, respectively. All K5Is showed dose-dependence and worked on all cell types tested (not shown). A, B scale bar is 10 μm.
To test if EMD534085 caused monopolar arrest in tumors, we used Colo 205 (human colon adenocarcinoma) xenografts. Mice bearing subcutaneous tumors were injected with a single bolus of EMD534085 at 10 or 20mg/kg or with vehicle alone. Tumors were harvested at different time points, sectioned, and immunostained for mitotic cells (phospho-histone H3) and nuclei (haematoxylin). A dose-dependent increase in mitotic index at 8h following drug was evident (Fig. 2A versus B, D). The phospho-histone H3 positive cells showed monopolar chromosomes, confirming the expected mechanism of mitotic arrest (Fig. 2B, arrows, C). After peaking at 8h, the mitotic index declined to normal levels by 48-72h, suggesting loss of mitosis-arrested cells by either slippage or death. The anti-tumor efficacy and induction of apoptotic death in tumor cells has been confirmed for EMD534085 and will be published elsewhere (Zenke et al). These data demonstrated that EMD534085 was active in tumors, and caused prolonged, monopolar mitotic arrest, similar to its effect in cell culture.
Figure 2. EMD534085 treatment results in dose-dependent mitotic arrest of cells in Colo 205 tumor xenografts.

Nude mice bearing COLO 205 tumors were treated with vehicle alone or with EMD534085 via bolus, interperitoneal injection. A, D) Tumor from a vehicle-injected mouse at 8h, stained with haematoxylin (blue nuclei) and anti-phospho-histone H3 (mitotic marker, brown). Mitotic arrest (see methods) was constant over time at ∼7%. B, C) Tumors treated with 20 mg/kg for 8h showed a 25.2% mitotic index and numerous monopolar phospho-histone H3 profiles (arrows). D) Mitotic arrest is dose-dependent and is greatest at ∼8h post-injection of drug. Mitotic arrest was again normal at 48-72h post-injection. Scale bar in A and B is 50 μm, C is 10 μm.
Time-lapse microscopy reveals highly dynamic and variable responses to K5Is
Before performing time-lapse microscopy, we used flow cytometry to evaluate 4N (G2, mitotic arrest, or post-mitotic G1) and sub-2N (apoptotic) accumulation in the tumor-derived and non-transformed cell lines at 8, 16, 24, 48, 72 and 96h of EMD534085 (Fig. S1). Increases of 4N cells up to 24h are largely indicative of mitotic arrest as the cells displayed a mitotic phenotype. Importantly, all of these cell lines have similar average doubling times of ∼20h, allowing for comparison. These data, together with immunofluorescence (not shown), indicated strong mitotic arrest in all cell lines but the timing of maximal arrest and the rate and extent of death varied across cell lines. HL60 were unusual in that they did not accumulate a large 4N peak before the sub-2N increased. The reason for this became apparent from time-lapse imaging experiments.
To measure drug responses of single cells, cells were followed using a microscope for ≥60h, collecting images every 10 min. To image the normally non-adherent HL60 line, we immobilized them by coating coverslips with CellTak (see methods). They retained a rounded morphology, and their proliferation and drug response were not significantly altered compared to non-adherent HL60, as judged by comparing time-lapse to flow cytometry data. Mitotic arrest and death were easily scored by phase-contrast or DIC imaging in all lines (Fig. 3). In the adherent lines, mitotic entry was signaled by cell rounding, and slippage by flattening. GFP imaging in HeLa-H2b-GFP confirmed that rounded, non-blebbing cells in drug were always in monopolar mitotic arrest. For HL60, mitotic entry was scored from dissolution of the nucleus and nucleolus in DIC images, and a monopolar chromosome arrangement. Without drug, normal mitoses lasted ∼1h and very little cell death occurred in any of the lines. In 500nM EMD534085, >95% of cells that entered mitosis, arrested (Table S1). Mitotic arrest terminated in one of two ways: cells slipped from mitosis without cytokinesis, re-spread, and reformed a nucleus, with micronuclei evident in some cases or cells died while still in mitosis, with blebbing and eventual lysis. Cells that slipped either died later, re-entered mitosis after a delay, or simply remained in interphase, often growing larger, which we interpret as cell cycle arrest in 4N G1. The duration of mitotic arrest, and subsequent behavior, differed profoundly between cell lines, as detailed in Figure 3 (movies of HeLa, MCF7 and HL60 are online) and Table S1. However, mitotic arrest was required for death in all cell lines.
Figure 3. Live-cell imaging identifies phenotypic responses and kinetic relationships between mitotic arrest and death.

HeLa, MCF7 and HL60 cells were treated with 500nM EMD534085. A-E) HeLa cells were stably expressing histone H2b-EGFP (insets). Times are for cell 1. B) Cell 1 just arrested as a monopolar spindle (inset). C) At 24h 20min, cell 1 slipped from mitosis. When the cell slipped the chromosomes coalesced and decondensed rapidly (inset). Cell 2 has already slipped to interphase. D, E) Cells 1 and 2 are interphase and cell 1 dies at 32h 10min, 7h 50min post-slippage. F-J) Two MCF7 cells undergo mitotic arrest. Times are for cell 1. G) Cells 1 and 2 are arrested in mitosis; cell 1 has just arrested. H) Cell 1 slipped at 4h 30min, cell 2 left the field. I, J) Cell 1 remains arrested in post-slippage interphase at >56h. K-O) HL60 cells; times are for cell 1. n=nucleoli, which are absent during mitosis. L) Cell 1 has just arrested. M) Cells 1 and 2 are arrested. N, O) Cells 1 and 2 died while arrested, by 5h 45min, and cell 3 is arrested. All movies are available online. P) Monopolar arrested cells proceed through 3 major pathways: death in mitosis, slip from mitosis into aberrant G1 with 4N DNA, or cytokinesis resulting in two G1 cells that are probably aneuploid. Cells that slip may proceed to death, remain arrested or proliferate.
In most of the lines, the behavior of individual cells was unpredictable; individual cells followed the different paths in Figure 3P, often with very different kinetics. However, in each cell line, one or two of the responses were most frequent, and could be said to represent the characteristic behavior of that line (Table S1). Summarizing, the epithelial cancer cell lines showed long mitotic arrests, and a variable extent of cell death in mitosis and after slippage. The non-transformed, diploid N/TERT-1 keratocyte cell line showed short mitotic arrest and the least cell death. HL60, a pro-myelocytic leukemia line, showed the shortest mitotic arrest time, terminated by death in mitosis for ∼100% of the cells. The short mitotic arrest was evident in the flow cytometry data (Fig. S1) and HL60 showed a similar response to paclitaxel (not shown), so this rapid initiation of cell death in mitosis is a characteristic of the cell type, not the particular drug or conditions.
To compare death sensitivity in the different lines, we plotted Kaplan-Meier survival curves, conceptually synchronizing the cell cycle timing of the response by taking t0 as the point a given cell entered mitosis. This analysis also removes any effect of cell doubling time on the timing of the death response. First, we pooled death in mitosis and after slippage (Fig. 4A). This analysis revealed impressive differences in the rate and extent of cell death, with HL60 the most sensitive, and N/TERT-1 the least. Average duration of mitotic arrest was similar in HeLa and HT29 (Table S1), but HeLa died faster overall because the interval between slippage and death was shorter (Table S2 and Fig. S6). Since death is scored only for cells that entered monopolar mitotic arrest, this analysis reports on differential tendencies to initiate a cell death program, and not differences in sensitivity of the mitotic spindle to becoming monopolar. In this respect, time-lapse imaging is much more informative than conventional cell survival assays, which lump these factors together.
Figure 4. Kaplan-Meier survival analysis reveals multiple modes and timing of death within a single population.
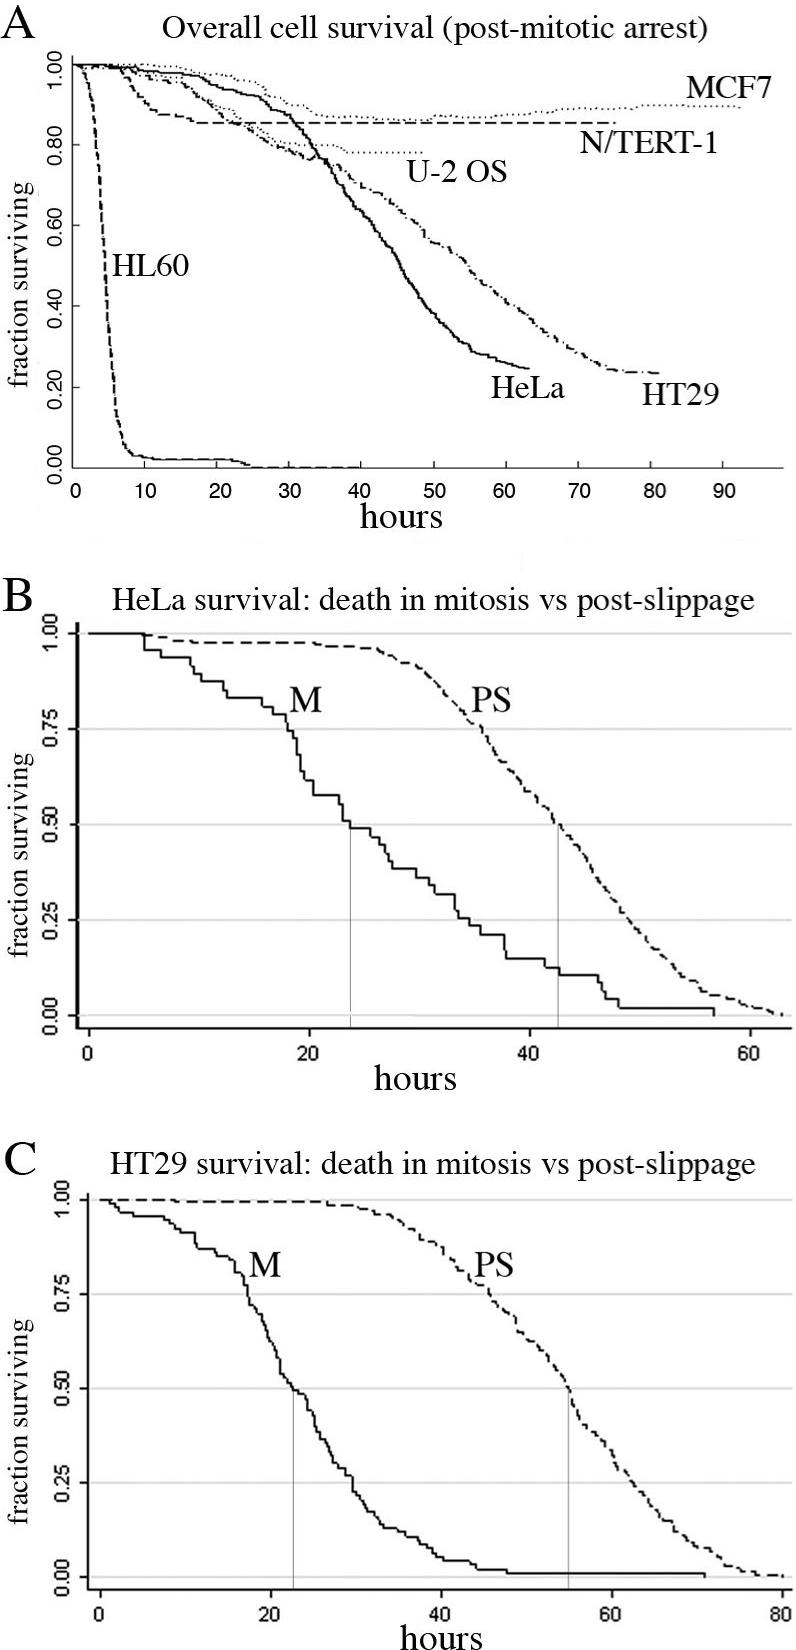
A) Overall population survival; t0=time of mitotic arrest. As a population, HL60 died rapidly and completely by 24h. Both HT29 and HeLa died significantly after 24h. For MCF7, N/TERT-1 and U-2 OS most death occurs before 40h. B, C) HeLa and HT29 survival was compared for death within mitosis and post-slip. The HeLa 0.5 survival is 23h for mitotic death and 42.5h for death post-slip. For HT29 the 0.5 survival is 22.5h for mitotic death and 55h for death post-slip. There is a clear temporal separation of the two modes of death. Also, in HeLa, cell loss from death post-slip appears modestly faster than for cell loss during mitosis. M=mitotic death, PS=post-slip death. Note: cell death from mitosis for MCF7 (n=9) and U-2 OS (n=11) was too rare for this comparative analysis. Overall survival curves are based on 212, 355, 331, 348, 185 and 178 HL60, HeLa-H2bGFP, HT29, MCF7, N/TERT-1 and U-2 OS cells, respectively.
To study kinetics of death in mitosis versus after slippage, we plotted them separately for HeLa and HT29 (Fig. 4B,C). For HeLa, the slopes indicate increased death rates post-slippage, while in HT29 the two rates were similar. A different K5I and Kinesin-5 siRNA resulted in comparable survival curves for HeLa (Fig. S2), indicating that arrest and death timing is inherent to the cells and not the specific structure of the K5I. Comparison of survival curves showed that death in mitosis largely occurred earlier than death after slippage, as one might expect. In HeLa, the increased rate of dying post-slippage suggests that slippage or the duration of arrest may contribute to pro-apoptotic signaling and/or reflects the asymmetric distribution of slip to death times for HeLa and not HT29 (Fig. S6).
Arrest duration and its relationship to the probability and timing of death
It has been hypothesized that the probability of cell death during or after drug induced mitotic arrest increases with the duration of arrest (3). If true, this might imply that cells accumulate some lethal signal during arrest that eventually crosses a threshold for triggering death. To test this concept for arrest with EMD534085, we measured the timing of mitotic entry, slippage and death for hundreds of cells in each line and analyzed the resulting population distributions. These data are shown in Figures S3-8 and Table S2. The variability in kinetics between individual cells is evident from the broad histograms (Figs. S3-8). This was true even for neighboring cells, so it reflects intrinsic differences between individual cells, not local environment effects. Given these broad distributions, limited conclusions could be drawn from population averages, and we further analyzed the distributions by quartile, and also calculated cell-to-cell correlations for arrest duration and death.
Comparing between cell lines in our panel, excepting HL60, average mitotic arrest time (Table S2) correlated positively with overall probability of death (Table S1) where HeLa and HT29 arrested longer and died more than MCF7, U-2 OS or N/TERT-1, which arrested for shorter. This correlation broke down in a larger panel of solid tumor derived cell lines using fixed time point analysis (14).
There are several ways to compare arrest duration to death probability for individual cells within a single line. We first measured arrest durations for populations of cells that progressed down different paths in Figure 3P (Fig. S5A, Table S2). For death post-slippage, cells that did and did not die showed similar average arrest times before slippage for all lines except MCF7, and to a lesser extent N/TERT-1, where dying cells had arrested longer in mitosis (columns 1 and 2 in Table S2B). For death directly from mitotic arrest, cells with long mitotic arrests (HeLa, HT29) spent a shorter time in mitosis if they died in mitosis than if they slipped without dying (columns 2 and 3 in Table S2B). However, this was not true for the lines with short arrests, where mitosis lasted approximately the same time whether cells died or slipped. A quartile analysis (Fig. 5B) indicated that the average arrest durations do not hide unusual behavior of sub-populations. For death post-slippage, and also for all deaths combined, duration of arrest was uncorrelated with probability of death, except in MCF7, where cells that arrested longer in mitosis died more often (Fig. S5C, D).
Figure 5. Long-term recovery of MCF7 cells is poorest when K5I is removed during mitotic arrest.

MCF7 were treated with 500nM EMD534085 for 24 or 48h before drug removal and then followed for 48h using time-lapse. A-E) At 30min, ∼50% of the cells were mitotic. B-E) Mitotic cells either slipped (s) or divided (d). F, G) >70% of mock cells divided and showed little death. For 24h, recovery cells, ∼37% of arrested cells slipped and ∼51% divided and ∼7% of cells divided from interphase. The 24h, recovery cells also showed a ∼4-fold increase in death. For 48h, recovery there were very few mitotic cells that slipped or divided and ∼10% cells divided from interphase. 48h, recovery cells died as much as mock. H, I) Cells at 14 positions from three experiments were scored daily and the fraction with a≥5-fold increase in cell number was plotted. Mock-treated cells recovered completely by day 7. At day 8 the 48h-treated cells showed a recovery of 0.6 (± 0.14) while the 24h-treated cells showed only 0.2 (± 0.04). I) Mean fold-recovery at day 8 was 16.5 for mock (13/14 ≥5-fold recovery), 3.9 for 24h, recovery (2/14 ≥5-fold recovery), and 9.4 for 48h, recovery (9/14 ≥5-fold recovery). Bracketed line=90% confidence interval.
Accumulation of some lethal signal during mitotic arrest might alter the timing of death, but not its overall probability, so we also analyzed that correlation. Correlograms of arrest times versus slip to death times for individual cells showed considerable scatter, but an overall negative slope for HeLa, HT29 and MCF7 (regression coefficients, rc = −0.17 to −0.36), implying that longer arrest does modestly correlate in this analysis with shorter slip to death time (Figs. S7, S8). U-2 OS showed no correlation (Fig. S8, rc = 0.0007). We further tested this relationship by plotting the distributions of slip to death times for each arrest quartile (Fig. S7D). For HeLa and MCF7, mean slip to death times for quartile 2-4 arrestors were shorter than for quartile 1 arrestors (TTESTs <0.02). Interestingly, HT29 are different than HeLa and MCF7, and only the longest arrestors comprising quartile 4 showed a decreased average slip to death time that was different than quartile 1-3 arrestors (TTESTs <0.02). These analyses suggest a relationship whereby longer arrest doesn't necessarily increase the probability of death, but instead tends to shorten slip to death times.
Transient treatment with K5I is sufficient to inhibit subsequent proliferation
Cytotoxic chemotherapy must be administered intermittently to prevent unacceptable toxicity. Thus, for anti-mitotics the questions of what happens when drug is washed out before a treated cell has died, and whether it matters if a cell is mitotic or not when the drug is washed out, become paramount. We investigated the consequence of washout in MCF7 cells, where mitotic arrest was strong but death responses were minimal. Cells were treated with 500nM EMD534085 for 24 or 48h, and then washed extensively to remove drug. Time-lapse after drug washout showed∼50% of the 24h-treated cells were in mitotic arrest (Fig. 5A) while <2% of 48h-treated cells were, indicating they had slipped before drug removal. Cells were tracked for the first 48h of recovery. Mock-treated cells divided normally (Fig. 5F) and only∼1.4% died (Fig. 5G). For the 24h-treated cells (24, recovery),∼37% of arrested mitotics slipped without cytokinesis (Fig. 5B-F), while∼51% recovered and underwent cytokinesis (Fig. 6B-F). Thus, EMD534085 was reversible with respect to spindle assembly and cytokinesis, though not all arrested cells were able to complete cytokinesis before slippage. Of the 166 initially arrested cells in the 24h-treated sample that either slipped or underwent cytokinesis, only three went on to divide again over ∼48h. This indicated a strong delay in cell cycle progression. For the∼37% of cells that slipped into 4N G1, this arrest was expected. MCF7 are p53 positive, and should exhibit the “tetraploidy checkpoint” (15, 16). Unexpectedly, the∼51% of cells that recovered after washout were also blocked in cell cycle progression, despite apparently normal divisions. For the 48h-treated cells (48, recovery), slip or divide events were rare, but there were∼10% divisions from interphase cells (Fig. 5F). It is not clear if these were cells that have escaped the tetraploidy checkpoint, were drug resistant, or had never arrested. Interestingly, 48h-treated cells died only at the same rate as mock, while 24h-treated cells died at a∼4-fold higher rate (Fig. 5G) during the first 48h of recovery.
Figure 6. MCF7 cells dividing after K5I removal show chromosome attachment and segregation errors.

MCF7 cells treated for 24h with 500nM EMD534085 were washed into recovery, fixed and stained with α-tubulin, DNA and sometimes CREST. Chromosome alignment and mis-segregations were scored at 4h recovery. A, A′, E) Control MCF7 cell in metaphase; ∼20% of control MCF7 or RPE1 cells show unaligned chromosomes (abnormal metaphase). B, B′, E) After 4h recovery, ∼60% of the preanaphase spindles show non-congressed, mono-oriented chromosome pairs (arrow); ∼60% of RPE cells at 4h recovery also show these alignment defects (not shown). C-D′, E) ∼55% of anaphase MCF7 cells at 4h recovery showed lagging (C′, arrow) or incorrectly attached (D′, arrow, inset) chromosomes. D′ shows a chromosome pair (inset). Anaphase cells in mock, 4h recovery MCF7 and RPE1 showed ≤5% with lagging or incorrectly attached chromosomes (abnormal anaphase). (F) ∼20% of interphase MCF7 cells at 4h recovery contained micronuclei with 2 or 1 CREST spots and ∼5% contained micronuclei with no CREST spots; RPE1 interphase cells showed essentially no micronuclei.
To monitor longer-term proliferation, cells were treated with drug, washed, and replated into gridded, glass-bottom imaging dishes. A total of 14 separate positions from three separate experiments were then imaged once daily for 8 days, and cell numbers at each position were scored. To compare proliferation, we plotted the fractions of positions with a 5-fold increase in cell number (Fig. 5H). To illustrate the extent of final recovery the fold-increase in cell number for each location at day 8 was plotted (Fig. 5I). Mock-treated cells recovered completely and proliferated an average of 16-fold. Both the 24- and 48h-treated cells showed delayed recovery, especially the 24h-treated cells. In both cases some cells productively proliferated, and this fraction of cells was smallest for the 24h drug treatment. The larger effect on proliferation of the 24h-treated sample, rather than 48h, was unexpected, since most of the 48h cells are 4N and abnormal, while many of the 24h cells completed an apparently normal division after drug washout (Fig. 5). These data, together with time-lapse imaging of the first 48h of recovery, reveal a novel and important aspect of the drug response for MCF7: daughters from an apparently normal cytokinesis of mother cells that were arrested in drug when it was washed out, were rarely able to divide again. Thus, K5Is can largely sterilize MCF7 daughter cells following washout and cytokinesis, as well as those cells that slip into 4N G1 in the presence of drug.
Divisions in MCF7 cells after drug washout show increased chromosome segregation defects
We used high-resolution imaging to explore mechanisms that could account for the poor recovery of MCF7 cells following drug washout during mitotic arrest. Cells were treated with 500nM EMD534085 for 24h, washed into normal medium for 4h recovery, fixed and stained. Untreated metaphase spindles were always bipolar with well-aligned chromosomes (Fig. 6A). Four hours after washout, some cells were still preanaphase. In these cells, most chromosomes were aligned at the metaphase plate, but some were still mono-oriented toward the poles (Fig. 6B, B′). Late-attaching, mono-oriented chromosomes were observed in∼60% of pre-anaphase washout cells and only∼20% of mock (Fig. 6E). Many cells were already in anaphase-telophase after 4h recovery. Anaphase in mock-treated cells showed∼5% with unattached or lagging chromosomes (Fig. 6E). However,∼55% of anaphases at 4h recovery cells showed lagging chromosomes (Fig. 6C, C′) or kinetochore pairs nearer one of the poles that were separated from the main chromosome mass, presumably corresponding to improperly or unattached chromosomes (Fig. 6D, D′). Further suggestive of segregation errors,∼20% of interphase MCF7 present at 4h recovery had micronuclei that contained one or two centromeres (Fig. 6F), indicating the cell had divided with unattached or improperly attached chromosome pairs. An additional∼7% of interphase MCF7 had micronuclei with no centromeres, suggesting chromosome breakage (Fig. 6F and data not shown). Mock-treated MCF7 cells had a total of only 1.8% of cells with micronuclei. Results for 2h recovery were comparable to 4h, but with more pre-anaphase cells and fewer anaphases-telophases. These data indicated that MCF7 cells washed out of drug while in mitotic arrest often progressed into anaphase and cytokinesis with chromosome segregation errors, which may well account for the reduced viability observed in Figure 6 for the 24h recovery condition.
We also performed drug-washout experiments in normal diploid RPE1 cells and found that, in contrast to MCF7, these cells aligned and corrected observable errors after drug washout from mitotic arrest. In this case there were only∼5% of anaphases showing mis-segregation (Fig. 6E) and essentially no cells with micronuclei following 24h treatment and 4h recovery (Fig. 6F). Thus the chromosome instability (CIN) tumor cell line, MCF7 showed a high rate of chromosome mis-segregation in recovery from 24h EMD534085, while normal RPE1 cells did not.
Discussion
In this study we provide novel quantitative data on cell responses to K5Is using time-lapse microscopy. Initially we confirmed that the K5I used here, EMD534085, causes monopolar mitotic arrest in cell culture and cancer xenografts (Figs. 1, 2). Pharmacology and anti-tumor efficacy of this clinical candidate compound will be discussed in more detail elsewhere (Zenke, et al, in preparation). Flow cytometry, long-term time-lapse and fluorescent microscopy were used to quantify phenotypic responses (Figs. 3-6 and supplementary data). In all adherent cell lines, K5Is promoted prolonged mitotic arrest, followed by slippage, with variable amounts of death occurring either in mitosis or after slippage. We found no relationship between EMD534085 concentration and the duration of mitotic arrest for cells that arrested as monopoles at 100nM (at or near the EC50 for all cell lines), 500nM, 1 μM and 10 μM (not shown). Furthermore, increasing concentrations above 500nM did not alter the mode of death, i.e. from mitotic arrest or after slippage, or the extent and timing of death (not shown), indicating this is a saturating condition that yields a full drug response. Cell responses to K5Is are broadly similar to anti-microtubule drugs, as discussed in Reider and Maiato (2004). In HL60 cells and another lymphoblastic, erythroleukemia cell line, TF1a (not shown), mitotic arrest was short, and terminated in death without slippage. The HL60 difference is not due to its non-adherent phenotype, since HeLa S3 cells adapted to suspension growth responded like adherent HeLa S3 cells in flow cytometry assays (not shown). It is more likely due to higher apoptosis sensitivity in HL60. Our observations, most notably in HL60 cells, contradict those of Tao et al (2005), who concluded that death in cells exposed to K5Is only occurred post-slippage, though we do see a predominance of that phenotype in solid-tumor derived lines. Tao et al, concluded apoptosis by the mitochondrial pathway was the major death pathway for a different K5I (9, 17), and we recently confirmed this for EMD534085 in a panel of 10 solid tumor derived lines (14). We are less clear about the mechanism of rapid death in HL60 cells. In preliminary experiments (data not shown) HL60 cells are not significantly protected by the pancaspase inhibitor, zVAD-FMK or by Bcl2 overexpression, but they do show evidence for release of cytochrome-C from mitochondria while arrested in mitosis.
The two non-cancer lines we examined, N/TERT-1 and RPE1, exhibited shorter average mitotic arrest durations than HeLa-H2bGFP and HT29, and also less death than all but MCF7. Hartwell (1994) predicted cancer cells would have weaker spindle assembly checkpoints than normal cells. Using the measure of mitotic arrest duration, this appears not to be the case in our cell lines. However, arrest duration is not the only possible measure of checkpoint strength. For example, the ability to detect chromosome alignment errors may differ between cell lines - in this case MCF7 cells would have an effectively weaker checkpoint than RPE1. Comparing MCF7 (cancer) and RPE1 (normal) in their ability to re-build a spindle after drug washout (Fig. 6), we found that the cancer line made more errors in chromosome alignment and segregation than the normal line. MCF7 have a CIN phenotype (18, 19), which may explain why they do a poorer job of segregation after drug washout.
The larger death effect we observed for EMD534085 in cancer lines, especially HL60, compared with two normal lines is encouraging, and suggests K5Is may have more selectivity in their cytotoxic action than one might expect simply from their ability to block mitotic spindle assembly. Cancer cells appear more likely to die following mitotic arrest, while non-cancer cells often slip and arrest in 4N G1 without dying. The origin of this selectivity is unclear. Cancer cells may be primed for apoptosis at the level of the Bcl-2 related protein family that regulate mitochondrial permeabilization (20), but exactly how spindle damage and mitotic arrest trigger apoptosis is unresolved.
Although previous data were fragmented and sometimes contradictory, it is widely believed that cells in mitotic arrest gradually accumulate some damage that eventually kills them, so increased duration of arrest leads to more death (3). In support of the damage-accumulation hypothesis, inhibiting the mitotic checkpoint tends to both shorten arrest and decrease death (21-23). Overall, our data fail to strongly validate this hypothesis, though we do find some support in MCF7 cells (Figs. S3C, C′ and S6) that have shorter average arrest duration than HeLa and HT29 (Fig. S6, Table S3) - this correlation was not observed in U-2 OS, that also have short average arrest. We do find in HeLa, HT29 and MCF7 some negative correlation between the duration of arrest and time from slip to death (Fig. S7). Furthermore, the duration of arrest that results in shortened slip to death times is unique to each cell line, and there appears to be a minimum average slip to death time, especially in HeLa and MCF7, as increasing arrest duration did not progressively decrease the slip to death times (Fig. S7). Overall, we conclude that individual cells show a high degree of variation in arrest duration and tendency to die, that any correlation between them is weak, and that the damage-accumulation model, alone, fails to account for most of the observed variation. This could mean the model is wrong, or that variations in other parameters such as the damage threshold for triggering death, apoptotic priming, and/or slippage-associated pathways that promote or antagonize death, cause noise that obscure evidence for damage accumulation.
Regarding drug reversibility, we found unexpectedly that the daughters of MCF7 cells recoverying from 24h-treatment were more inhibited in subsequent proliferation than cells exposed for 48h, that had slipped out of mitosis into 4N G1 before drug removal (Fig. 5). We hypothesize that drug washout during mitosis results in increased chromosome segregation errors, and that the resulting daughter cells arrest, perhaps irreversibly, due in part to these errors, thereby resulting in poorer recovery. This high error rate after drug washout may be specific for the CIN phenotype, suggesting K5Is, administered periodically, might selectively poison CIN cancers. We do not know how 4N G1 cells initiate proliferation after drug washout. Presumably these cells are arrested by the poorly understood, p53-dependent “tetraploidy checkpoint” that arrests cells in G1 following failed cytokinesis (15, 16) and some cells escape this arrest, and proliferate. We hypothesize that the p53 system senses prolonged mitotic arrest and/or slippage, and are working on molecular mechanisms of this checkpoint as it applies to K5Is.
Much remains to be understood to improve anti-mitotic cancer chemotherapy. K5Is appear promising in that they promote mitotic arrest and cell death similar to conventional, microtubule-directed anti-mitotics, but do not cause the neurotoxicity and other side effects characteristic of those drugs (5). It is intriguing that the promyelocytic HL60 cell line, that can differentiate into neutrophils in culture, has such a rapid and complete death response. Neutropenia has been dose limiting for other K5Is in the clinic (5), and it is possible HL60 cells mimic the response of dividing pre-neutrophils in the bone marrow. Further investigation of their death pathway might lead to concepts for bone-marrow selective cytoprotective drugs for limiting bone-marrow toxicity during chemotherapy.
Acknowledgements
Alexander Loewer and David Nelson for advice on flow cytometry, Caroline Mock, Galit Lahav and Randy King for cells, Jens-Oliver Funk (Merck Serono), Jennifer Waters and Lara Petrak of the Nikon Imaging Center and Systems Biology Microscopy Facility and members of the Mitchison laboratory.
This work is supported by a research grants from Merck Serono and NCI CA078048-09 to T.J.M.
Abbreviations
- (K5I)
Kinesin-5 inhibitor
- (EC50)
50% effective concentration
- (GFP)
green fluorescent protein
- (CIN)
chromosome instability
References
- 1.Jordan MA, Wilson L. Microtubules as a target for anticancer drugs. Nat Rev Cancer. 2004;4:253–65. doi: 10.1038/nrc1317. [DOI] [PubMed] [Google Scholar]
- 2.Hamel E. Antimitotic natural products and their interactions with tubulin. Med Res Rev. 1996;16:207–31. doi: 10.1002/(SICI)1098-1128(199603)16:2<207::AID-MED4>3.0.CO;2-4. [DOI] [PubMed] [Google Scholar]
- 3.Rieder CL, Maiato H. Stuck in division or passing through: what happens when cells cannot satisfy the spindle assembly checkpoint. Dev Cell. 2004;7:637–51. doi: 10.1016/j.devcel.2004.09.002. [DOI] [PubMed] [Google Scholar]
- 4.Brito DA, Rieder CL. Mitotic checkpoint slippage in humans occurs via cyclin B destruction in the presence of an active checkpoint. Curr Biol. 2006;16:1194–200. doi: 10.1016/j.cub.2006.04.043. [DOI] [PMC free article] [PubMed] [Google Scholar]
- 5.Jackson JR, Patrick DR, Dar MM, Huang PS. Targeted anti-mitotic therapies: can we improve on tubulin agents? Nat Rev Cancer. 2007;7:107–17. doi: 10.1038/nrc2049. [DOI] [PubMed] [Google Scholar]
- 6.Weaver BA, Cleveland DW. Decoding the links between mitosis, cancer, and chemotherapy: The mitotic checkpoint, adaptation, and cell death. Cancer Cell. 2005;8:7–12. doi: 10.1016/j.ccr.2005.06.011. [DOI] [PubMed] [Google Scholar]
- 7.Sawin KE, Mitchison TJ. Mutations in the kinesin-like protein Eg5 disrupting localization to the mitotic spindle. Proc Natl Acad Sci U S A. 1995;92:4289–93. doi: 10.1073/pnas.92.10.4289. [DOI] [PMC free article] [PubMed] [Google Scholar]
- 8.Mayer TU, Kapoor TM, Haggarty SJ, King RW, Schreiber SL, Mitchison TJ. Small molecule inhibitor of mitotic spindle bipolarity identified in a phenotype-based screen. Science. 1999;286:971–4. doi: 10.1126/science.286.5441.971. [DOI] [PubMed] [Google Scholar]
- 9.Tao W, South VJ, Zhang Y, et al. Induction of apoptosis by an inhibitor of the mitotic kinesin KSP requires both activation of the spindle assembly checkpoint and mitotic slippage. Cancer Cell. 2005;8:49–59. doi: 10.1016/j.ccr.2005.06.003. [DOI] [PubMed] [Google Scholar]
- 10.Vijapurkar U, Wang W, Herbst R. Potentiation of kinesin spindle protein inhibitor-induced cell death by modulation of mitochondrial and death receptor apoptotic pathways. Cancer Res. 2007;67:237–45. doi: 10.1158/0008-5472.CAN-06-2406. [DOI] [PubMed] [Google Scholar]
- 11.Chin GM, Herbst R. Induction of apoptosis by monastrol, an inhibitor of the mitotic kinesin Eg5, is independent of the spindle checkpoint. Mol Cancer Ther. 2006;5:2580–91. doi: 10.1158/1535-7163.MCT-06-0201. [DOI] [PubMed] [Google Scholar]
- 12.Collins SJ, Ruscetti FW, Gallagher RE, Gallo RC. Terminal differentiation of human promyelocytic leukemia cells induced by dimethyl sulfoxide and other polar compounds. Proc Natl Acad Sci U S A. 1978;75:2458–62. doi: 10.1073/pnas.75.5.2458. [DOI] [PMC free article] [PubMed] [Google Scholar]
- 13.DeBonis S, Skoufias DA, Lebeau L, et al. In vitro screening for inhibitors of the human mitotic kinesin Eg5 with antimitotic and antitumor activities. Mol Cancer Ther. 2004;3:1079–90. [PubMed] [Google Scholar]
- 14.Shi J, Orth JD, Mitchison T. Cell type variation in responses to antimitotic drugs that target microtubules and kinesin-5. Cancer Res. 2008;68:3269–76. doi: 10.1158/0008-5472.CAN-07-6699. [DOI] [PubMed] [Google Scholar]
- 15.Andreassen PR, Lohez OD, Lacroix FB, Margolis RL. Tetraploid state induces p53-dependent arrest of nontransformed mammalian cells in G1. Mol Biol Cell. 2001;12:1315–28. doi: 10.1091/mbc.12.5.1315. [DOI] [PMC free article] [PubMed] [Google Scholar]
- 16.Stukenberg PT. Triggering p53 after cytokinesis failure. J Cell Biol. 2004;165:607–8. doi: 10.1083/jcb.200405089. [DOI] [PMC free article] [PubMed] [Google Scholar]
- 17.Tao W, South VJ, Diehl RE, et al. An inhibitor of the kinesin spindle protein activates the intrinsic apoptotic pathway independently of p53 and de novo protein synthesis. Mol Cell Biol. 2007;27:689–98. doi: 10.1128/MCB.01505-06. [DOI] [PMC free article] [PubMed] [Google Scholar]
- 18.Menssen A, Epanchintsev A, Lodygin D, et al. c-MYC Delays Prometaphase by Direct Transactivation of MAD2 and BubR1: Identification of Mechanisms Underlying c-MYC-Induced DNA Damage and Chromosomal Instability. Cell Cycle. 2007;6:339–52. doi: 10.4161/cc.6.3.3808. [DOI] [PubMed] [Google Scholar]
- 19.Thompson SL, Compton DA. Examining the link between chromosomal instability and aneuploidy in human cells. J Cell Biol. 2008;180:665–72. doi: 10.1083/jcb.200712029. [DOI] [PMC free article] [PubMed] [Google Scholar]
- 20.Letai AG. Diagnosing and exploiting cancer's addiction to blocks in apoptosis. Nat Rev Cancer. 2008;8:121–32. doi: 10.1038/nrc2297. [DOI] [PubMed] [Google Scholar]
- 21.Taylor SS, McKeon F. Kinetochore localization of murine Bub1 is required for normal mitotic timing and checkpoint response to spindle damage. Cell. 1997;89:727–35. doi: 10.1016/s0092-8674(00)80255-x. [DOI] [PubMed] [Google Scholar]
- 22.Swanton C, Marani M, Pardo O, et al. Regulators of mitotic arrest and ceramide metabolism are determinants of sensitivity to paclitaxel and other chemotherapeutic drugs. Cancer Cell. 2007;11:498–512. doi: 10.1016/j.ccr.2007.04.011. [DOI] [PubMed] [Google Scholar]
- 23.Sudo T, Nitta M, Saya H, Ueno NT. Dependence of paclitaxel sensitivity on a functional spindle assembly checkpoint. Cancer Res. 2004;64:2502–8. doi: 10.1158/0008-5472.can-03-2013. [DOI] [PubMed] [Google Scholar]