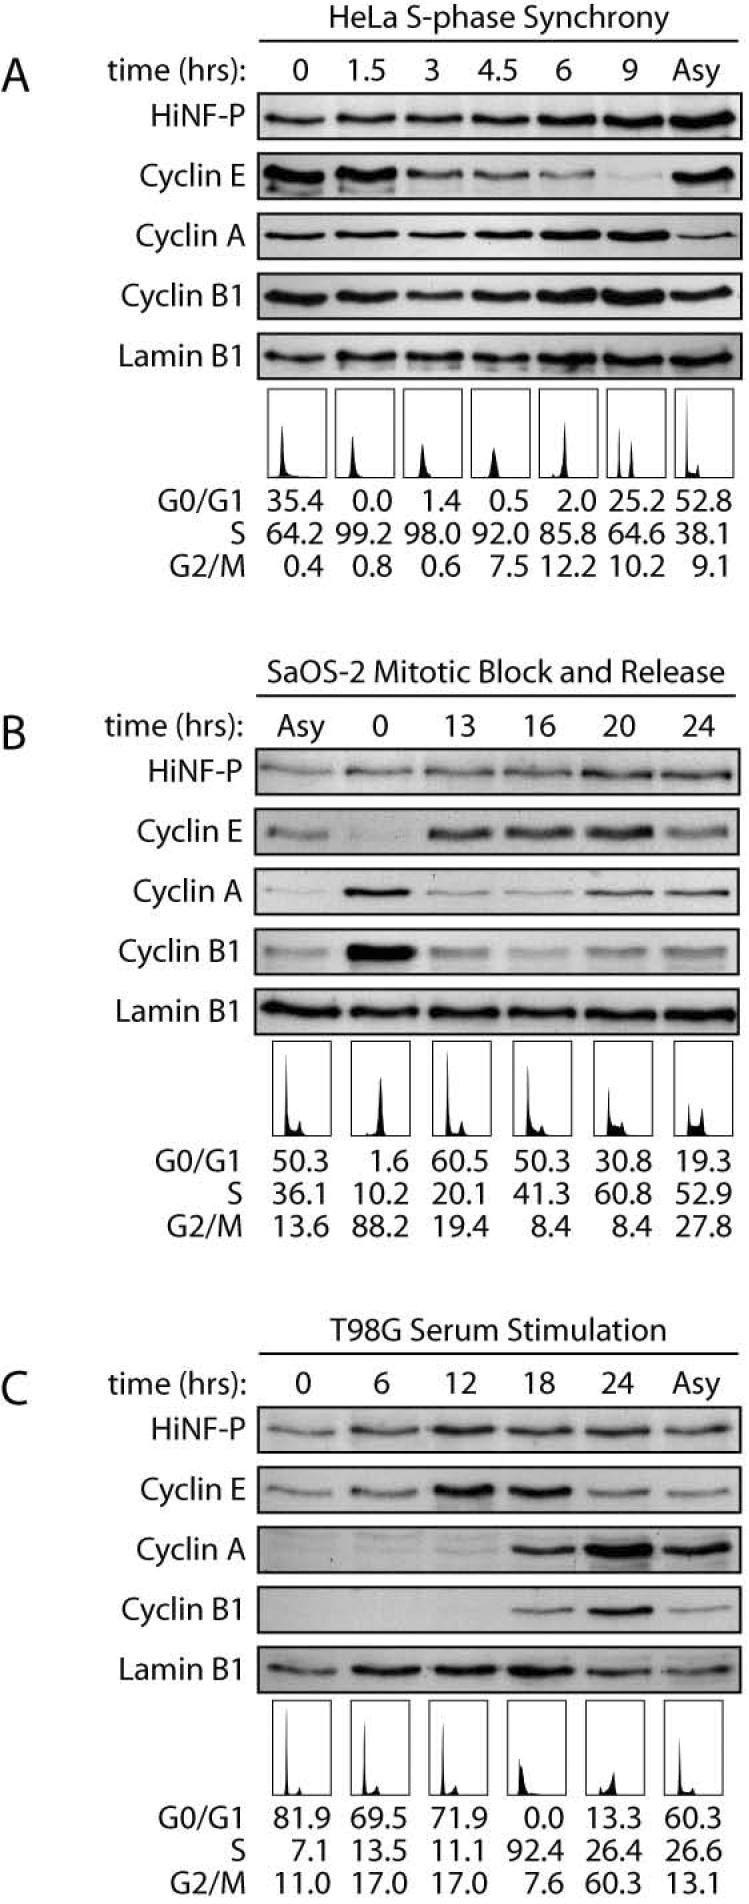
Figure 2. HiNF-P protein levels during the cell cycle and cell proliferation.

HiNF-P protein levels were analyzed for cell cycle distribution in HeLa cells synchronized by the double thymidine block (A), and SaOS cells blocked by nocodazole treatment (B), and for cell proliferation in T98G released from quiescence by serum stimulation (C). Whole cell extract was prepared from samples taken at the indicated time points after release from blockage and analyzed by western blot using specific antibodies shown on the left. To confirm synchrony in each cell line, cell cycle distribution was analyzed by FACS sorting and profiles along with the percentage in each cell cycle stage are shown underneath.
