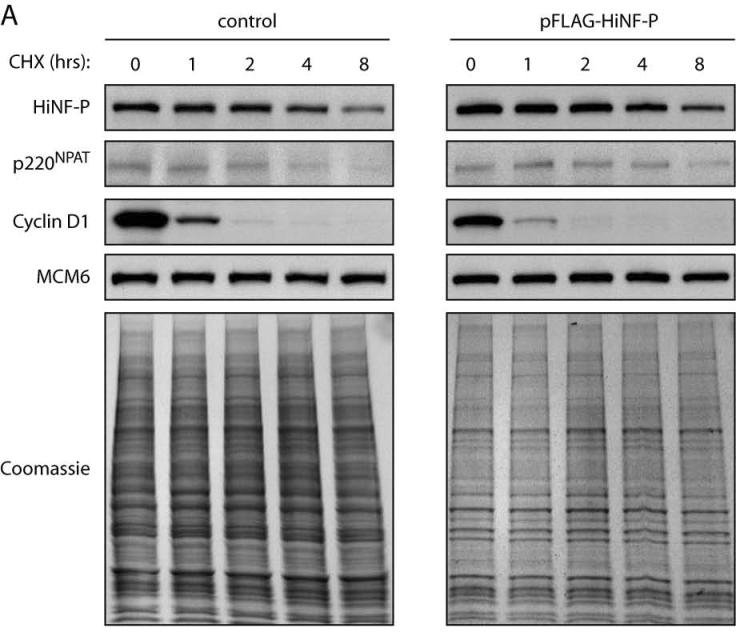
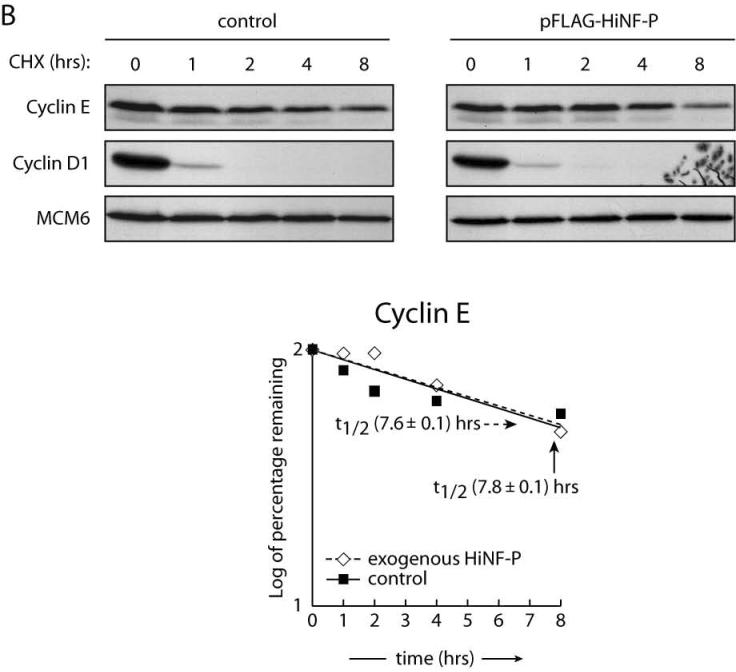
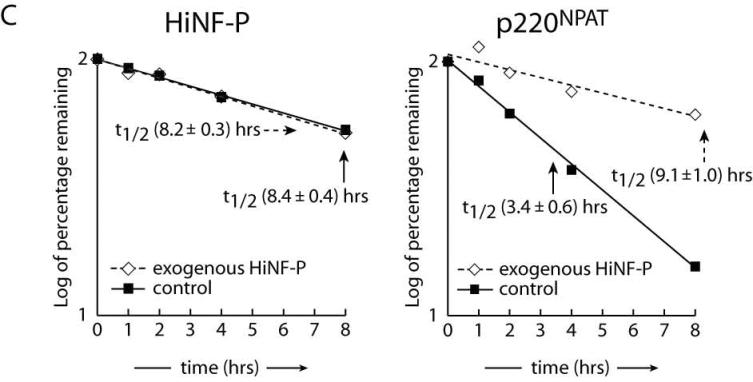
Figure 5. Stabilization of p220NPAT by HiNF-P.
Endogenous (control) or exogenously expressed HiNF-P turnover was analyzed in HeLa cells after treatment with 50 μg/ml cycloheximide (CHX) for the indicated times (A). Cells were harvested and whole cells extracts prepared for western blotting with the indicated antibodies on the left. MCM6 is shown to confirm equal loading as well as the Coomassie staining underneath. Cyclin E turnover was analyzed under conditions described in panel A. The lower panel shows quantification of cyclin E in control cells or cells expressing FLAG-HiNF-P. Results are plotted as the log of the percentage of protein remaining at each time point (B). Panel C shows quantification of the western blots shown in panel A and values are expressed as “log of percentage remaining” as described above. HiNF-P and FLAG-HiNF-P (left) or p220NPAT (right) were analyzed in untransfected cells (control) or cells transfected with pFLAG-HiNF-P (exogenous).


