Abstract
The biological events occurring in the body are complex and challenging to decode. The expression, production, secretion and interaction of proteins, peptides and small molecules often occur in a fast manner and at low concentrations. Methods used to quantify these events must be rapid, selective, sensitive and robust. In recent years, new variations of affinity methodologies have been developed to facilitate quantitation of these biomolecules. This review will focus on selected affinity techniques that have described multi-analyte measurement, high sensitivity techniques, or the application of new affinity reagents applied to conventional technologies to measure analytes involved in cell communication and biomarkers produced in specific disease states.
Introduction
Cellular interactions and signaling are responsible for controlling all processes in the body. Cells interact by communicating with one another via gap junctions or secreted factors. While gap junctions serve to communicate to neighboring cells, secreted factors can be used to signal either locally or globally. One of the most common examples of cellular communication by secreted factors is the exocytotic release from neurons. An example of this type of communication is in neurotransmitters released from chromaffin cells affecting the Ca2+ entry in neighboring cells and the original cell via paracrine and autocrine pathways, respectively.1
For the purpose of this review, we will also consider biomarkers to be another form of cellular communication. Although some biomarkers do not communicate directly with other cells, these molecules can communicate to a clinician the state of the body with respect to a specific disease. For example, the American Cancer Society recommends measurement of the biomarker prostate specific antigen (PSA) to men who are at risk of developing prostate cancer as the level of this protein can be used to gauge the diagnosis of this disease.2
There are unique challenges associated with measuring cellular communication either from exocytotic pathways or biomarkers. The analytical methods used must be rapid, selective, sensitive, and if performed over long periods of times, automated. To achieve these characteristics, immunoassays, or affinity assays in general, have been widely utilized. A new class of affinity reagents, aptamers, has also been used as an alternative to antibodies and may enable a more cost effective approach to affinity assays in the future.
The number of publications relating to affinity assays is extensive and this article is not meant to be a comprehensive review. Rather, we have attempted to select several reports from recent years that have measured biomarkers or cellular communication. In addition to selecting reports focusing on these applications, we have also highlighted emerging technologies in affinity assays, such as multi-analyte measurement, high sensitivity detection techniques, and the use of novel affinity reagents in traditional assays.
Multi-analyte affinity assays
Development of affinity assays that can quantify multiple analytes simultaneously or a single analyte in a high throughput fashion is an important aspect of deciphering cellular communication. In the following examples, we review several examples of new methodologies for increased measurement throughput.
Cytokines are important messenger proteins in cellular communication networks regulating immunological and inflammatory response. In a recent publication, enzyme-linked immunosorbent assays (ELISA) and cytometric bead-based multiplex immunoassays were compared for detection of cytokines in biofluids.3 In cytometric bead-based assays, beads of discrete fluorescence intensities and wavelengths provide a capture surface for specific proteins enabling detection of multiple analytes in a single sample. A report by Morgan et al. reviewed the use of cytometric bead array (CBA) systems for the measurement of multiple cytokines in various applications such as detection of inflammatory markers and investigation of intracellular signaling.4 Some of the advantages of bead-based immunoassays over ELISA for measurement of cytokines include the multiplex nature of the technique, smaller sample volumes and dilutions, and higher-throughput evaluation of multiple analytes in a single platform. For example, CBA was used to measure 6 cytokines in a 15 μL microdialysis sample collected from cultured macrophages stimulated with bacterial lipopolysaccharide.5 The ability to analyze small dialysate samples by CBA allowed for an increased sampling frequency, which resulted in a temporal profile of cytokine release from macrophages. In another study, the role of oxysterols on the secretion of cytokines from monocytes found in atheromatous plaques and plasma of atherosclerotic patients was investigated.6 Various cytometric bead-based immunoassays were used to quantify the levels of up to 17 cytokines simultaneously in the culture supernatant of cells stimulated with oxysterols. Results showed that oxysterols induced the secretion of pro-inflammatory cytokines in vitro and indicated that interleukin-8 (IL-8) was involved in the MEK/ERK1/2 cell signaling pathway.
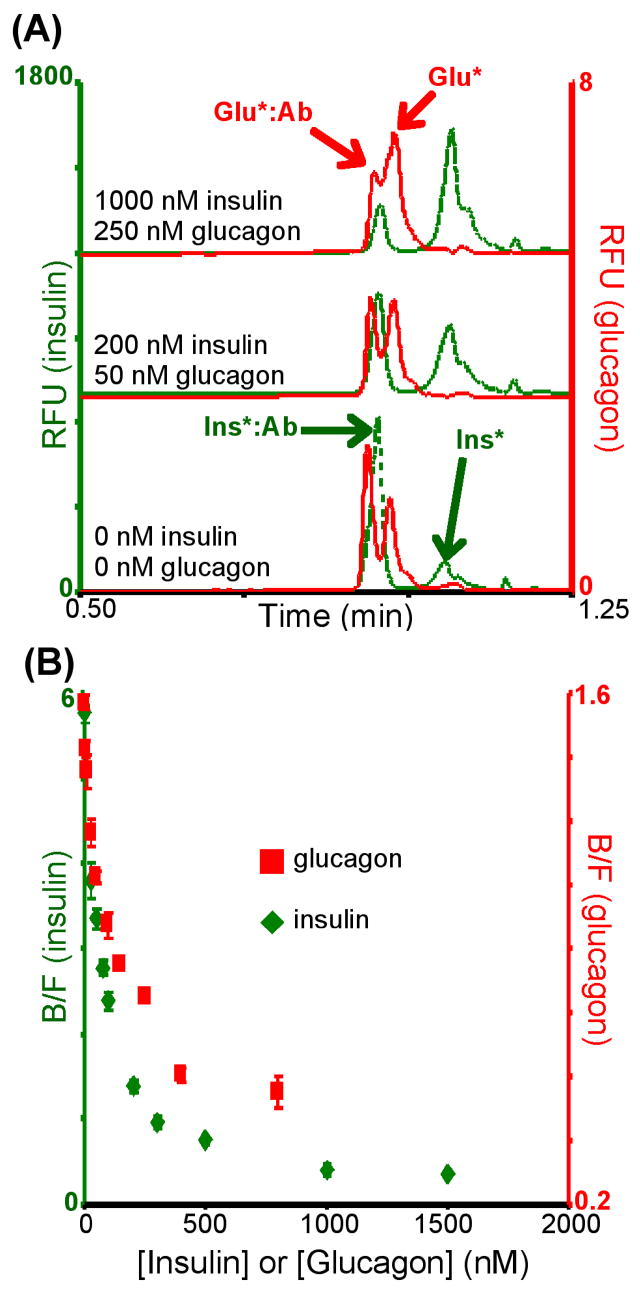
To increase analysis throughput, improve sensitivity and allow for more automated analyses, immunoassays have been performed in combination with capillary electrophoresis combining immuno-recognition with high efficiency separations. Capillary electrophoresis immunoassays have been used to measure expression and/or secretion of a variety of proteins and peptides from cells. We have simultaneously quantified intracellular levels of insulin and glucagon from islets of Langerhans using a two-color detection scheme with capillary electrophoresis immunoassays.7 Glucagon and insulin are secreted from pancreatic α- and β-cells, respectively, in response to blood glucose levels. Proper secretion of these peptides is critical for maintaining systemic glucose homeostasis. With a traditional single-color detection mode, simultaneous quantitation of these 2 peptides would be difficult as the mobility of the bound peaks were approximately equal hindering accurate quantitation of either peak. Even with the inclusion of an internal standard, quantitation would be difficult as the concentration of insulin was 20-fold higher than glucagon, creating a large difference in the concentration of reagents needed. To achieve simultaneous quantitation, separate fluorescent dyes were used for each assay: fluorescein isothiocyanate (FITC) for insulin and Cy5 for glucagon. The ability to spectrally-resolve the two electropherograms (λex = 488 nm λem = 520 nm for insulin, λex = 635 nm λem = 665 nm for glucagon) enabled simultaneous quantitation of both analytes even though electrophoretic resolution was low. Examples of electropherograms and calibration curves are shown in Fig. 1. Limits of detection were 7 nM for insulin and 3 nM for glucagon and amounts of insulin and glucagon measured in islets were 56.6 ± 3.2 and 1.0 ± 0.5 ng/islet, respectively, which agreed with literature values.7
Fig. 1.
(A) Typical electropherograms obtained from the dual-color simultaneous capillary immunoassay for insulin and glucagon. Reagent concentrations were 800 nM FITC-insulin (Ins*), 400 nM insulin Ab, 40 nM Cy5-Glu (Glu*), and 20 nM glucagon Ab. Note difference in insulin and glucagon peak intensities due to the large difference in reagent concentrations. (B) Dual calibration curves obtained simultaneously and used to determine insulin and glucagon content in islets of Langerhans. Reprinted with permission from reference 7 (Copyright 2008, Wiley-VCH).
While the aforementioned bead-based and electrophoresis-based assays have focused on multi-analyte immunoassays, another way to increase throughput is through the development of parallel single analyte immunoassays. In one example, 4 individual immunoassays were combined onto a single microfluidic device enabling serial immunoassays to be performed in parallel.8 A total of 1450 analyses were performed in less than 40 min, monitoring insulin secretion from 4 islets every 6.25 s.
Cesaro-Tadic et al. also achieved low limits of detection (~ 1 pM) and low sample volumes (~ 600 nL) while performing multiple analyses in parallel using microfluidic-based surface immunoassays.9 A sandwich fluorescence immunoassay was used to measure the secretion of tumor necrosis factor α(TNF-α), a cytokine involved in many chronic inflammatory pathological states, from dendritic cells. The surface of a PDMS block was coated with capture monoclonal antibodies against TNF-α, and subsequently placed on an array of capillary systems containing a flow of cell culture supernatant. The reacted PDMS block was then placed on a second array of capillary systems containing a flow of fluorescently-labeled detection antibody solution at varying concentrations. With this method, simultaneous calibration curves and analysis can be performed dramatically decreasing the analysis time. This format of immunoassay should enable the use of multiple capture antibodies to make it amenable to simultaneous measurement of multiple analytes.
In an effort to improve their technique, the same research group published the theoretical modeling of these surface immunoassays. They used a combination of experimental data and theory to better understand and improve the transport of analytes in microchannels, as well as the binding kinetics between analytes in a flow of solution and immobilized antibodies.10
A recent publication has demonstrated the use of a cleaved-tag immunoassay in the detection of 4 biomarkers for acute myocardial infarction.11 In this type of sandwich immunoassay, analyte is captured from solution by antibody-coated beads. A secondary antibody tagged with a unique fluorophore is added to sandwich the analyte. The fluorescent tags are then cleaved from the secondary antibody and separated by micellar electrokinetic chromatography. One benefit of this assay is the ease of multiplexing for different antigens with both the high resolving power of the separation step and the spectroscopic resolution of the tags.
High-sensitivity detection schemes for affinity assays
Although the more traditional immunoassay methodologies described above are still extensively used and constantly improved, novel and less conventional detection techniques have recently been developed to increase the sensitivity of immunoassay analysis.
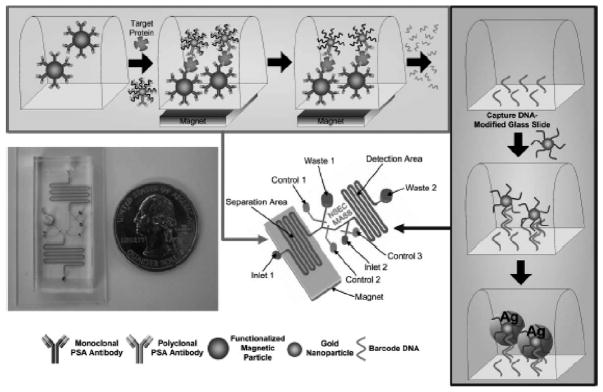
For ultra-sensitive detection of proteins and biomarkers, bio-barcode assays have been developed. In one type of these assays, a sandwich format is utilized with antibody-functionalized magnetic particles to capture antigen. DNA-decorated nanoparticles coated with a secondary antibody are then added to the mixture and downstream capture of DNA and subsequent detection is used as an indirect marker of antigen. This type of bio-barcode assay, shown in Fig. 2, allowed for detection of 300 copies of PSA in serum.12
Fig. 2.
Principle of the bio-barcode assay and its implementation in a microfluidic format. Magnetic particles are functionalized with monoclonal antibodies and introduced into the separation portion of the device. The sample and gold nanoparticles functionalized with polyclonal antibodies and barcode DNA are then added to the magnetic particles, held in place by a magnet placed under the chip. After immunorecognition reaction, the DNA barcode is released from the gold nanoparticles and transferred to the detection channel, which is patterned with capture DNA. Complementary barcode DNA immobilized on a second set of gold nanoparticles are introduced into the detection channel to allow hybridization. Signal from the gold nanoparticle is then amplified using silver stain. Reprinted with permission from reference 12 (Copyright 2006, Royal Society of Chemistry).
A hybrid method combining immunoassay and the polymerase chain reaction (PCR) termed immuno-PCR has also been used for measurement of various proteins released from cells. In contrast to the aforementioned bio-barcode assays, the DNA strands are directly linked to antibodies in immuno-PCR. Quantitation can be accomplished via real-time PCR amplification of the DNA bound to the antibodies. These assays have been used to detect various biomarkers of diseases, such as PSA.13 The major advantage of immuno-PCR is signal amplification; in theory, single copies of target can be detected. Both the bio-barcode and immuno-PCR should be amenable to simultaneous detection of multiple analytes using different primer sets or different templates that would produce different sizes of amplified DNA. These ultra-sensitive assays have recently been reviewed.14 Other non-traditional detection systems, such as surface plasmon resonance, quartz crystal microbalance, and cantilever-based immunosensors have also been recently reviewed.15,16
Aptamer-based affinity reagents
In addition to the use of antibodies, aptamers are beginning to gain popularity as affinity reagents in various assays. Aptamers are single-stranded DNA or RNA oligonucleotides that bind specifically to target molecules that can range from small organic species to proteins. Nucleic acid aptamers are obtained from a library of random sequences of synthetic DNA or RNA which are subjected to repeated rounds of in vitro selection, also known as systematic evolution of ligands by exponential enrichment (SELEX). The selection of these oligonucleotides for specific target molecules is repeated with increasing binding affinity in each round of enrichment. Cells are constantly in communication with the local environment through membrane proteins or other surface functionalities. The Tan group has developed a method to select aptamers for cancer cells over normal cells by targeting unknown differences in the surface antigens of these cells. With their method, the biomarkers specific for that type of cancer do not need to be known before selection as any aptamers that bind both surface antigens (normal and cancer cells) are not used.
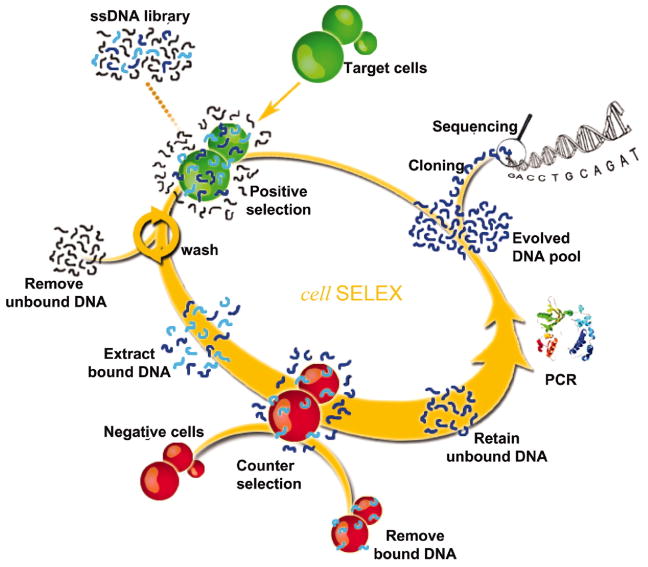
In one example, this group used cell-based aptamer selection to target membrane proteins from a specific tumor cell line (CCRF-CEM cells, from precursor T cell acute lymphoblastic leukemia), using a different tumor cell line as the negative control (Ramos cells, B cells from human Burkitt’s lymphoma).17 To produce these aptamers, the library of single stranded DNA sequences were incubated with CCRF-CEM cells. The cells were then washed and bound DNA sequences eluted from the cells. The eluted DNA sequences were later incubated with Ramos cells and unbound sequences were collected and used for subsequent rounds of selection. The selection process was monitored by flow cytometry and resulted in the enrichment of target cell-specific aptamers, with several aptamers having dissociation constants in the nanomolar to picomolar range. A schematic representation of the SELEX process and summary table of the ability of selected aptamers to detect cancer cells closely related to CCRF-CEM are presented in Fig. 3.
Fig. 3.
Schematic principle of cell-based aptamer selection. Aptamers are first selected against tumor cells followed by a negative selection against normal cells. Oligonucleotides that bind cancer cells but not normal cells are kept and subjected to repeat selections. Reprinted with permission from reference 17 (Copyright 2006, National Academy of Sciences).
The Krylov group has also used aptamer-based methods for the detection of cell biomarkers. They recently reported the development of an “aptamer-facilitated biomarker discovery” method to distinguish between live, mature and immature dendritic cells.18 Upon exposure to infection, the immature cells present in the body transforms into mature cells by presenting specific proteins on their surface that will activate T-cells. These biomarkers of cell maturation are important for the development of dendritic cell-based cancer vaccines. The method is based on a multi-round selection process that generates aptamers for differential molecular targets present on the surface of the cells. Minor differences in these biomarkers can be detected between two cell populations if these differences persist from round to round, improving the efficiency of the method and classification of the cells.
Finally, aptamers have also been used to assay cytokines and growth factors. Guthrie et al. has reviewed the various aptamer-based methods developed for detection of these specific analytes.19 As shown in these selected examples, nucleic acid aptamers are versatile and may be a cheaper alternative to antibodies for the discovery and monitoring of biomarkers.
Conclusions and outlook
As demonstrated by the studies highlighted in this article, affinity assays are ideal methodologies to measure various aspects of cell chemistry. One of the most important characteristics of these assays is the specific recognition of an analyte of interest in complex chemical or biological matrices. While these techniques have been extensively used to study biomarkers and cell communication events, there are areas where the assays can be improved.
Future developments in immunoassay technology ought to include better automation of the procedure to provide more reproducible analyses and higher throughput. Additionally, improvement in detection sensitivity should be a goal of new method development as a majority of biological events occurs at low analyte levels. Finally, we believe that multiplexed assays for simultaneous quantitation of different analytes will be valuable to the scientific community. The biological “language” involves multiple peptides and proteins and only their simultaneous detection will allow us to understand and potentially control the processes that go awry in disease states.
Acknowledgments
MGR acknowledges support from NIH R01 DK080714 and the American Heart Association Greater Southeast Affiliate.
References
- 1.Carbone E, Carabelli V, Cesetti T, Baldelli P, Hernández-Guijo JM, Giusta L. Pflügers Arch – Eur J Physiol. 2001;442:801–813. doi: 10.1007/s004240100607. [DOI] [PubMed] [Google Scholar]
- 2.Smith RA, Cokkinides V, Brawley OW. CA Cancer J Clin. 2008;58:161–179. doi: 10.3322/CA.2007.0017. [DOI] [PubMed] [Google Scholar]
- 3.de Jager W, Rijkers GT. Methods. 2006;38:294–303. doi: 10.1016/j.ymeth.2005.11.008. [DOI] [PubMed] [Google Scholar]
- 4.Morgan E, Varro R, Sepulveda H, Ember JA, Apgar J, Wilson J, Lowe L, Chen R, Shivraj L, Agadir A, Campos R, Ernst D, Gaur A. Clin Immunol. 2004;110:252–266. doi: 10.1016/j.clim.2003.11.017. [DOI] [PubMed] [Google Scholar]
- 5.Ao X, Wang X, Lennartz MR, Loegering DJ, Stenken JA. J Pharm Biomed Anal. 2006;40:915–921. doi: 10.1016/j.jpba.2005.07.044. [DOI] [PubMed] [Google Scholar]
- 6.Prunet C, Montange T, Vejux A, Laubriet A, Rohmer JF, Riedinger JM, Athias A, Lemaire-Ewing S, Neel D, Petit JM, Steinmetz E, Brenot R, Gambert P, Lizard G. Cytometry A. 2006;69A:359–373. doi: 10.1002/cyto.a.20272. [DOI] [PubMed] [Google Scholar]
- 7.Guillo C, Roper MG. Electrophoresis. 2008;29:410–416. doi: 10.1002/elps.200700399. [DOI] [PubMed] [Google Scholar]
- 8.Dishinger JF, Kennedy RT. Anal Chem. 2007;79:947–954. doi: 10.1021/ac061425s. [DOI] [PubMed] [Google Scholar]
- 9.Cesaro-Tadic S, Dernick G, Juncker D, Buurman G, Kropshofer H, Michel B, Fattinger C, Delamarche E. Lab Chip. 2004;4:563–569. doi: 10.1039/b408964b. [DOI] [PubMed] [Google Scholar]
- 10.Zimmermann M, Delamarche E, Wolf M, Hunziker P. Biomed Microdevices. 2005;7:99–110. doi: 10.1007/s10544-005-1587-y. [DOI] [PubMed] [Google Scholar]
- 11.Caulum MM, Murphy BM, Ramsay LM, Henry CS. Anal Chem. 2007;79:5249–5256. doi: 10.1021/ac070452v. [DOI] [PubMed] [Google Scholar]
- 12.Goluch ED, Nam JM, Georganopoulou DG, Chiesl TN, Shaikh KA, Ryu KS, Barron AE, Mirkin CA, Liu C. Lab Chip. 2006;6:1293–1299. doi: 10.1039/b606294f. [DOI] [PubMed] [Google Scholar]
- 13.Lind K, Kubista M. J Immunol Methods. 2005;304:107–116. doi: 10.1016/j.jim.2005.06.015. [DOI] [PubMed] [Google Scholar]
- 14.Zhang H, Zhao Q, Li XF, Le XC. Analyst. 2007;132:724–737. doi: 10.1039/b704256f. [DOI] [PubMed] [Google Scholar]
- 15.Marquette CA, Blum LJ. Biosens Bioelectron. 2006;21:1424–1433. doi: 10.1016/j.bios.2004.09.037. [DOI] [PubMed] [Google Scholar]
- 16.Carrascosa LG, Moreno M, Alvarez M, Lechuga LM. Trends Analyt Chem. 2006;25:196–206. [Google Scholar]
- 17.Shangguan D, Li Y, Tang Z, Cao ZC, Chen HW, Mallikaratchy P, Sefah K, Yang CJ, Tan W. Proc Natl Acad Sci USA. 2006;103:11838–11843. doi: 10.1073/pnas.0602615103. [DOI] [PMC free article] [PubMed] [Google Scholar]
- 18.Berezovski MV, Lechmann M, Musheev MU, Mak TW, Krylov SN. J Am Chem Soc. 2008;130:9137–9143. doi: 10.1021/ja801951p. [DOI] [PubMed] [Google Scholar]
- 19.Guthrie JW, Hamula CLA, Zhang H, Le XC. Methods. 2006;38:324–330. doi: 10.1016/j.ymeth.2006.01.001. [DOI] [PubMed] [Google Scholar]


