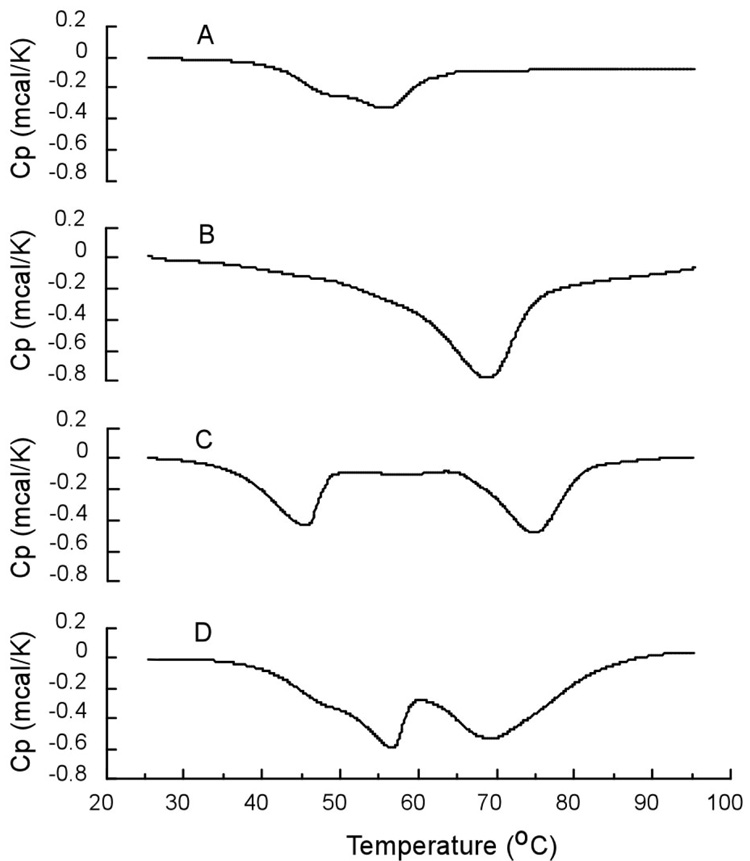
Figure 1.
DSC curves of alkaliphilic Bacillus pseudofirmus OF4 F1F0 and cytochrome caa3 embedded in phospholipids singly or in combination. The molar ratio of F1F0 and caa3 is one and the weight ratio of phospholipids to protein is 1.5 in all cases. These vesicles are prepared by the cholate dialysis method. Curve A shows the exothermic thermodenaturation of 0.5 mg F1F0 embedded in phospholipid vesicles. Curve B is the DSC thermogram of 0.105 mg/ml caa3 embedded in phospholipid vesicles. Curve C is the DSC profile of phospholipid vesicles embedded with a mixture of 0.5 mg F1F0 and 0.105 mg caa3. Curve D is a mixture of phospholipid vesicles, embedded individually with either 0.5 mg F1F0 or 0.105 mg caa3. A total of twenty-one assays were conducted on two independent preparations. The standard deviations for the transition temperatures were in the range of 0.1–0.3 degrees and for enthalpy changes were 0.5–0.8 Kcal/mmol.

