

Abstract
The NMR solution structure of the bovine fibrinogen αC-domain fragment including residues Aα374-538 reveals a type-I′ β-hairpin, restricted at the base by a C423-C453 disulfide linkage and a short turn preceding C423. Although both faces of the hairpin are formed mainly by hydrophilic residues, one of them is uncharged while the other one has a characteristic pattern of charged residues which are highly conserved among vertebrate species. Chemical shift indexing and relaxation data indicate the presence of a collapsed hydrophobic region next to the hairpin that includes approximately 30 residues with slower concerted motion and higher content of non-polar residues and, according to a previous study (Tsurupa et al., 2002), may cooperate with the hairpin to form a compact cooperative unit (domain). Structure and relaxation data show that the region between C423 and C453 is populated by both random coil and β structure suggesting that the cooperative structure in the isolated αC-domain is intrinsically unstable. This observation is in agreement with a very low energy of stabilization of the Aα374-538 fragment determined in unfolding experiments. The low stability of the αC-domain suggests a possible explanation for the previously observed intra- and intermolecular interactions of these domains in fibrinogen and fibrin.
Fibrinogen is a 340-kDa plasma protein that plays a prominent role in hemostasis, thrombosis, wound healing, inflammation, angiogenesis, and tumorigenesis. This multitude of fibrinogen functions is connected with its complex multidomain structure that provides its homophilic interaction upon fibrin assembly and its interactions with numerous proteins and cell types in other processes. Fibrinogen consists of two identical disulfide-linked subunits each of which is composed of three non-identical polypeptide chains, Aα, Bβ, and γ (1; 2). These chains assemble to form at least 20 distinct domains grouped into several major structural regions (3–6). The disulfide-linked NH2-terminal portions of all six chains form the central E region, the COOH-terminal portions of the Bβ and γ chains and the middle portion of the Aα chain form two distal D regions, and the remaining COOH-terminal two-thirds of two Aα chains form two αC regions. The D-E-D regions account for three nodules observed in numerous electron microscopy studies (7–10), while the fourth nodule observed in some molecules near the central nodule E corresponds to the two interacting αC regions, often referred to as αC-domains (9; 11; 12) (Figure 1A).
Figure 1.
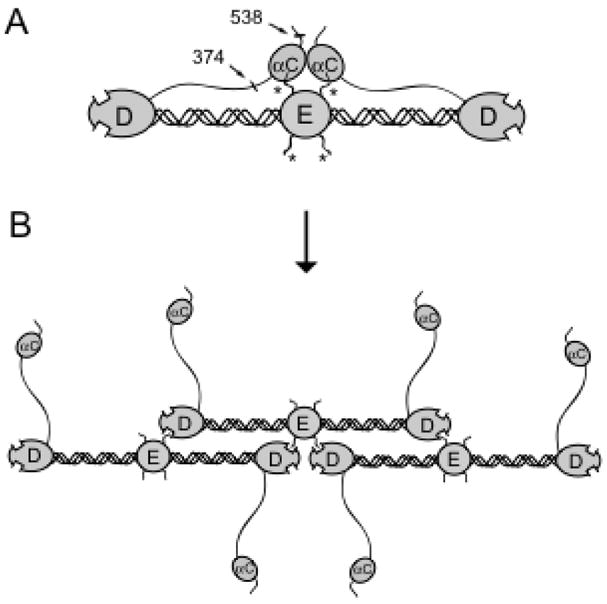
Schematic representation of the interacting αC-domains in fibrinogen and their dissociation upon its conversion to fibrin. Panel A shows fibrinogen molecule consisting of the D-E-D nodules linked by coiled coil connectors and two αC-domains interacting with each other and with the central region of the molecule via its fibrinopeptides B. Fibrinopeptides A and B are indicated with asterisks; the approximate location of the Aα374-538 region corresponding to the recombinant αC-domain fragment used in this study is indicated by arrows. Panel B shows a protofibril in which the αC-domains dissociate after removal of FPB. Adapted from (25).
Activation of the coagulation cascade leads to the generation of thrombin which converts fibrinogen into fibrin by cleavage of fibrinopeptides A and B (FPA and FPB1, respectively) from its central region. This cleavage results in spontaneous polymerization of individual fibrin molecules into double-stranded protofibrils (Figure 1B) which then aggregate laterally to produce thicker fibers composing fibrin clots (1; 10). According to our current view, in fibrinogen the αC-domains interact intramolecularly with each other and with the central E region, most probably via its FPB, while upon fibrin assembly they dissociate and switch from intra- to intermolecular interaction thus promoting lateral aggregation of protofibrils (12–16). The functional role of the αC-domains is not restricted to their participation in fibrin assembly. They are involved in controlling activation of plasma transglutaminase factor XIII (17), which subsequently cross-links fibrin clots to increase their mechanical stability. The human fibrinogen αC-domains promote cell adhesion via their Aα572-574 RGD sequence2 and via bound fibronectin (18–21), and may contribute to the development of atherothrombosis (22). They are also involved in regulation of fibrinolysis via binding of plasminogen, its activator tPA, its inhibitor α2-antiplasmin, and via modulating the structure of fibrin clots (16; 23–25).
The fibrinogen D and E regions can be separated by limited proteolysis resulting in the D and E fragments, respectively, while the αC regions are vulnerable to proteolytic enzymes, which degrade them into smaller pieces (1; 2). The success in crystallization of these fragments resulted in determination of the three-dimensional structure of individual fibrinogen regions and promoted X-ray studies of the entire molecule. Particularly, the X-ray structures have been established for the human fibrinogen D fragment (26) and for the bovine and human fibrinogen E fragments (6; 27). Further, a low resolution structure of most of the fibrinogen molecule was obtained from a crystallographic study of a proteolytically truncated bovine fibrinogen (28), followed by a higher resolution structure of intact chicken fibrinogen (29). Altogether, these studies have established the three-dimensional structure of more than two-thirds of the molecule including the complete D regions and most of the E region; that of the αC-domains remains to be determined.
In the absence of the three-dimensional structure of the αC regions, the current view on their structural organization is based on a number of studies performed in different laboratories mainly by electron microscopy, differential scanning calorimetry (DSC), and sequence analysis (3; 4; 9; 11; 15). These studies revealed that in fibrin(ogen) each αC region forms a compact globular entity, αC-domain, attached to the bulk of the molecule with a flexible connector (15). The full-length αC region and its halves corresponding to αC-connector and the αC-domain have been prepared by recombinant technique (24; 30). A detailed analysis of their folding status by several methods has confirmed that the αC-domain contain a compact cooperative structure while the connector is flexible (30). At the same time, there is also an alternative view suggesting that the αC-domains represent “free-swimming appendages” devoid of any ordered structure (1; 8). This view was reinforced by an X-ray study of intact chicken fibrinogen, in which the αC-domains were not observed in electron density maps (29). Thus, the question whether these domains contain compact ordered structure is still debated (31; 32).
In this study, we report the NMR solution structure of the recombinant bovine fibrinogen αC-domain fragment including residues Aα374-5383, which reveals a type I′ β-hairpin and a collapsed hydrophobic cluster, and discuss a possible role of such a structure in the previously observed intra- and intermolecular interactions.
EXPERIMENTAL PROCEDURES
Protein Expression and Purification
15N or 15N/13C labeled and non-labeled recombinant bovine fibrinogen αC fragment consisting of residues Aα374-538 was expressed in E. coli in minimal media supplemented with either 15NH4Cl or 15NH4Cl and 13C6-glucose and subsequently purified and refolded from inclusion bodies as described previously (24; 30). The fragment was concentrated to 3–5 mg/mL, dialyzed against 10 mM KPO4 buffer, pH 6.0, containing 150 mM NaCl, measured into 300 μL aliquots, lyophilized, and stored at −80 °C until needed.
NMR Data Collection
Lyophilized 15N or 15N/13C labeled fragment was resolubilized with 300 μL of 10%D2O/H2O to a final concentration of ~0.2–0.3 mM in 10 mM KPO4 buffer, pH 6.0, containing 150 mM NaCl. Aligned samples for dipolar coupling experiments were prepared as above with ~15 mg/mL Pf1 phage (ASLA biotec). All NMR spectra were recorded at 298K unless stated otherwise on a Bruker DRX-600 MHz spectrometer equipped with a triple resonance cryo-probe with gradients in the Z axis.
Assignments were made by standard methods utilizing combined data obtained from the following experiments: 15N-HSQC, sensitivity enhanced HNCO, C-dipsi-(CO)NH, H-dipsi-(CO)NH, HCCH-dipsi-CT, HN(CO)CACB, HNCACB, HBHA(CO)NH (for description see (33)). Approximately 73% of the backbone and 62% of the sidechain resonances were assigned. NOE assignments were based on peak intensities obtained from the 15N-HSQC NOESY, 15N-13C edited NOESY and 13C-13C edited NOESY. All NOESY spectra were collected with 110 ms mixing times. 1H-15N backbone amide RDCs were measured using the 1H-15N IPAP-HSQC experiment on 15N labeled sample with and without alignment induced by Pf1 phage (34). All Spectra were processed with NMRPipe (35) and analyzed with Sparky (T.D. Goddard and D.G. Kneller, University of California, San Francisco) and PIPP (36).
Backbone 15N relaxation measurements
All relaxation spectra were obtained with 128 × 512 complex data points with zero filling to 256 × 1024 data points. T1 spectra were obtained using delay times of 8, 32, 96, 240, 480, 800, 1120, and 1440 ms. T1ρ spectra were obtained using delay times of 344.4, 382.8, 406.8, 30.8, 454.8, 478.8, 550.8, and 622.8 ms. 15N-Heteronuclear NOE values were recorded in interleaved fashion with 80 scans using a 1H presaturation pulse of 3.76 s (37).
Hydrogen-deuterium exchange experiments
Hydrogen-deuterium exchange experiments were conducted at pH 6.0 and 288 K. Deuterated or protonated protein was lyophilized and then resolubilized on ice in 10% or 100% D2O and consecutive 15N-HSQC spectra were recorded at 0, 10, 20, and 40 minutes.
Structure Calculation
NOESY peak intensities were converted to distance restraints using a continuous interproton distance distribution and summation averaging, (Σr−6)−1/6, with an added error of 25–35% to take into account possible effects from spin diffusion. Xplor-NIH (38) was used for structure calculation incorporating the distance restraints as well as dihedral angle restraints as calculated by TALOS (39) and dipolar coupling restraints. The initial alignment tensor was extracted from the RDC histogram analysis and optimized by a grid search minimizing the total energy of the calculated structure. Hydrogen bonds were added based upon secondary structure elements obtained from CSI and NOE data.
Free Energy Determination
Measurements of urea-induced unfolding were performed at 25 °C in an SLM 8000-C fluorometer by continuous addition with a motorized syringe of a concentrated stock solution of urea at a rate of 20 μL/min to a stirred cuvette containing the non-labeled Aα374-538 fragment at 0.1 mg/mL while monitoring the ratio of the fluorescence intensity at 370 nm to that at 330 nm with excitation at 280 nm. Both the fluorometer and the syringe-driver were controlled by a computer which automatically corrected the fluorescence intensity for dilution assuming a linear dependence on protein concentration below 0.15 mg/mL. To determine the Gibbs free energy of unfolding (ΔG), the change in the fluorescence ratio was converted to the fraction denatured and used to calculate the equilibrium constant and free energy at any urea concentration as described in (40). The free energy of unfolding at different temperatures (T) was also calculated as described in (41) using the equation
| (1) |
Where ΔHo and ΔSo = ΔHo/To are the enthalpy and entropy of unfolding evaluated at the reference temperature To = Tm and ΔCp is the difference in heat capacity between folded and unfolded states. The thermodynamic parameters of unfolding of the Aα374-538 fragment, melting temperature (Tm), ΔHo, and ΔCp were determined from the previously obtained melting curves (30).
RESULTS
Solution Structure of the αC-Domain Fragment
The NMR solution structure of the bovine fibrinogen αC-domain fragment consisting of residues Aα374-538 was determined using the NMR structural restraints and statistics as shown in Table 1. The structure revealed that about 20% of the residues are involved in formation of two adjacent antiparallel β strands joined by a turn (β-hairpin) and disulfide-linked at the base through C423-C453; there is also another turn preceding the first β strand (Figure 2). Overlap and ambiguity due to narrow peak dispersion precluded the unambiguous assignment of many peaks including those from residues S424, E439, and E443 of the hairpin. The only region of the sequence to show persistent structural content is circumscribed by the disulfide linkage of C423 and C453. Consistent with this observation, backbone amide proton peak dispersion as observed by 1H-15N HSQC indicates a generally disordered structure (42; 43). Only twelve resonances have 1H chemical shifts greater than 8.6 ppm, 11 of which arise from residues in the disulfide-linked hairpin. The disappearance of these peaks in the presence of the reducing agent dithiothreitol (data not shown) suggests that the disulfide bridge is necessary to maintain the integrity of the structure.
Table 1.
Restraints and structural statistics for the refinement of the Aα420-453 region.
| Restraints | r.m.s. deviations (20 structures) | |
|---|---|---|
| Total NOE distance restraints | 137 | 0.071±0.005 (Å) |
| Short-range (intra-residue) | 35 | |
| Medium-range (≤4) | 71 | |
| Long-range (>4) | 17 | |
| Ambiguous | 14 | |
| Dihedral angle restraints (φ,ψ) | 51 | 1.884±1.89(°) |
| Residual dipolar coupling restraints | 87 | 3.576±0.232 (Hz) |
| Hydrogen bonds | 7 | 0.0353±0.006(Å) |
| Structural Statistics | ||
| Atomic pairwise rmsd (Å) (backbone; 49–75) | 0.76 | |
| (heavy; 49–75) | 1.05 | |
| (backbone; 49–81) | 1.47 | |
| NOE violations > 0.3 Å | 0 | |
| Ramachandran Statistics | ||
| Residues in most favored regions | 71.3% | |
| Allowed | 24.6% | |
| Generously allowed | 2.1% | |
| Disallowed | 1.9% | |
Figure 2.
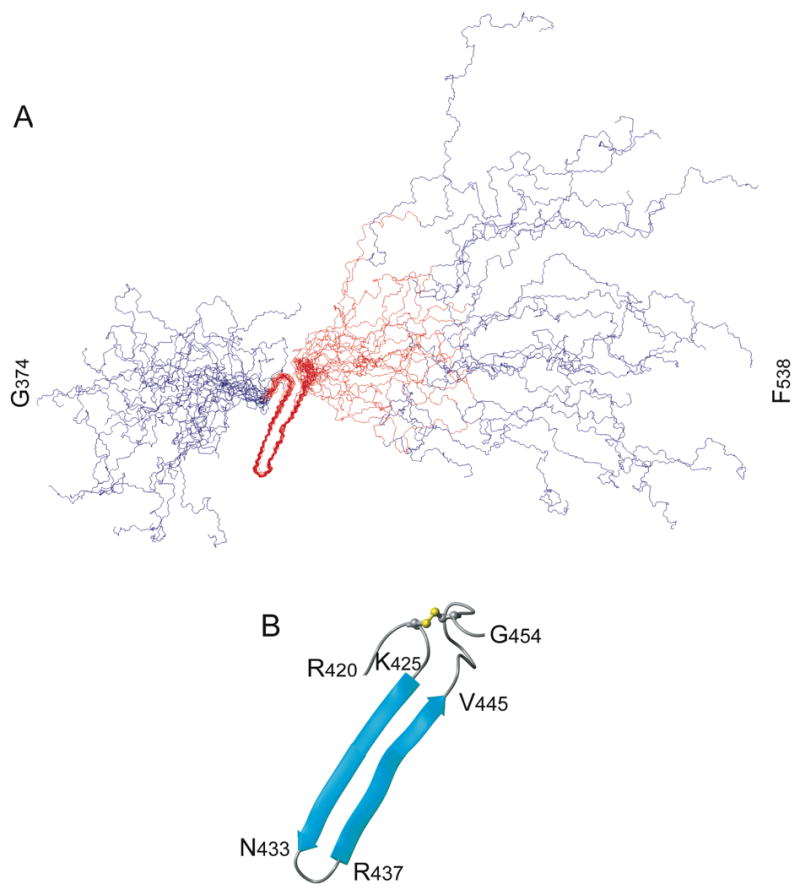
Overlay of 20 lowest energy structures of the bovine fibrinogen Aα374-538 αC-domain fragment (A) and ribbon diagram of the β-hairpin between cysteine residues 423 and 453 with the disulfide bond shown in yellow (B). The hairpin and the hydrophobic collapsed region (see text) are in red while the remaining regions are in blue. Figures generated with MOLMOL (60).
Ramachandran angles and residue specific potentials for the turn residues, D435 and G436, define a type I′ β-turn (44). Cross-strand HN-Hα and HN-HN NOEs define the register and hydrogen bonding pattern in the hairpin, as well as confirm the classification of the turn. Ten hydrogen bonds between the main chain carbonyls and amides were defined in the hairpin in this manner. Lack of dihedral, CSI, and NOE restraints for the 5 residues preceding C453 yields a short bulge at the COOH-terminus of the hairpin while at the NH2-terminus another turn is confirmed by CSI of R420 and R421 and NOESY cross peaks between R421 and V426/I427 (Figure 2). Electrostatic interactions observed between the side chains of R420, K425, E448, and D449 may help to stabilize the base of the hairpin and the NH2-terminal turn (Figure 3). Both faces of the hairpin are fairly hydrophilic yet one is composed mostly of β-branched residues including V426, T428, T430, T432, T438, T440, and V444 and is uncharged except for one lysine residue (K442); the other consists of several charged residues including K425, K429, R437, E439, and E443 (Figure 3).
Figure 3.
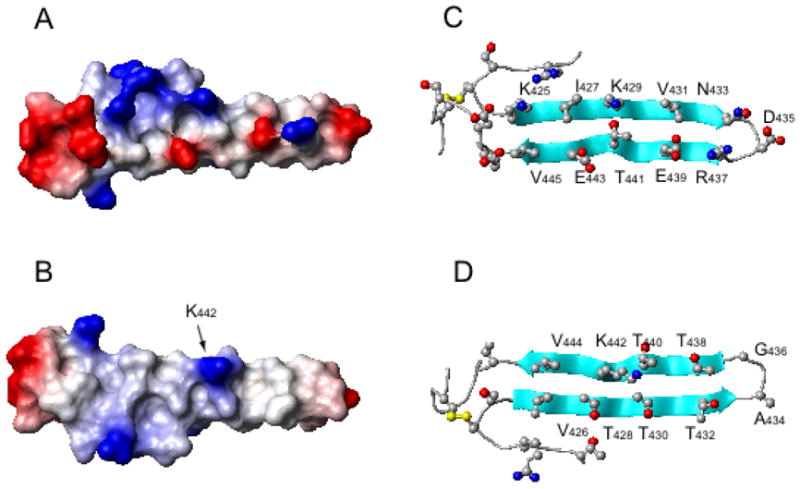
Surface charge representation of the lowest energy structure of the hairpin depicting the charged (A) and uncharged (B) surfaces. Ribbon diagram depicting the distribution of residues on the charged (C) and uncharged (D) faces. The sidechain of Lys442 is highly mobile and therefore the surface in panel B should be viewed as relatively uncharged.
Relaxation and Dynamics
T1, T1ρ, and 1H-15N heteronuclear NOE data were used to estimate the dynamical characteristics of the Aα374-538 αC-domain fragment (Figure 4). 15N Heteronuclear NOE relaxation data reveal that the entire fragment is fairly flexible with all NOE values less than 0. The T1 value remains constant throughout indicating that the overall correlation time is approximately the same for all residues. At the same time, an increase in the NOE value to −0.5 and a concomitant decrease in the T1ρ to 100 ms in the region flanked by the two cysteine residues indicate slower concerted motion. This region of slower correlation time extends COOH-terminal to the hairpin to include approximately 30 more residues as determined by the observation that the NOE and T1ρ values begin to decrease and increase, respectively, roughly at T483. This region also has an increased hydrophobicity since at least 40% of its residues are nonpolar (12 out of 30). For comparison, average content of nonpolar residues in the remaining regions of the Aα374-538 fragment including the hairpin is about 32%. Although in Figure 2 this region is presented as a set of different conformations since NOE and RDC restraints are lacking due to ambiguity and overlap, the relaxation data show it should be more compact than those with faster motion and therefore was designated here as a collapsed hydrophobic region.
Figure 4.
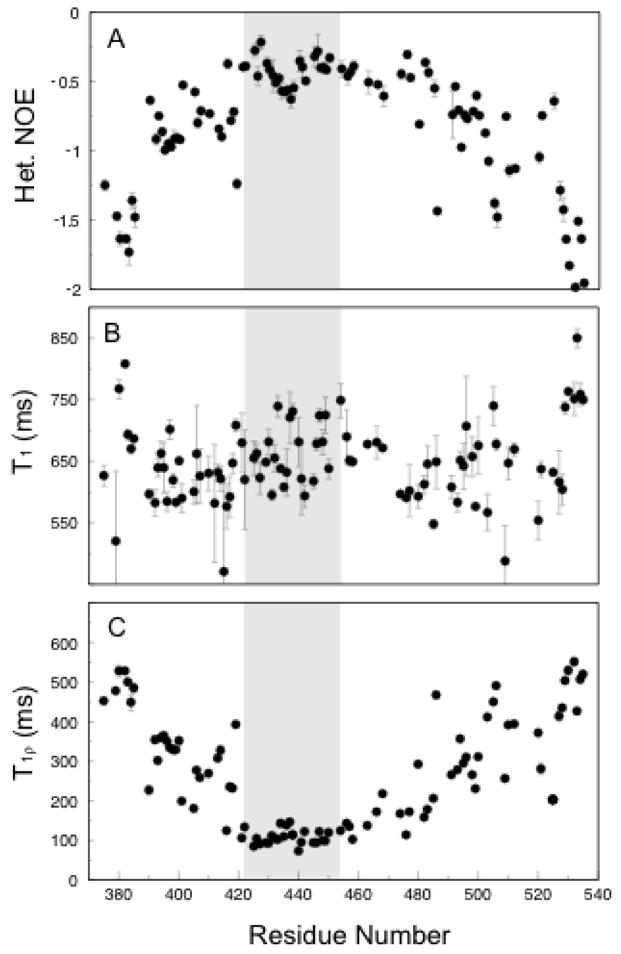
T1 (A), T1ρ (B), and NOE (C) relaxation data. The shaded area indicates the region of the hairpin. Decreased flexibility is observed in the shaded region as well as the ~30 residues COOH-terminal to the hairpin.
Stability of the αC-Domain Fragment
It should be noted that chemical shift indexing (CSI) of the Cα, Cβ, and Hα resonances (45; 46) reveals deviation from random coil phi/psi values toward β structure in the disulfide-linked region (Figure 5). At the same time, small CSI shifts (~1 ppm Δδ CA and CB for the structured region on average) and lack of Hα β-strand periodicity (47) indicate that the structure at 25 °C is simultaneously populated by random coil. These data are in agreement with the previous observation that the Aα374-538 fragment at the concentration of salt used in this study (0.15 M NaCl) has low thermal stability and starts unfolding at room temperature (30). An increase in salt concentration to 0.5 M, which was shown to slightly increase thermal stability of this fragment (30), caused only a slight shift in peak position (0.3 ppm maximum 1H shift) and did not show any significant effect on the relaxation data (not shown). It should also be mentioned that at lower temperature (15 °C), at which one could expect stabilization of the structure, hydrogen-deuterium exchange occurred too rapidly to be observed (in less than ten minutes; data not shown), revealing that all amide hydrogen atoms are easily exposed to bulk solvent. All these results suggest that the ordered structure within the Aα374-538 αC-domain fragment is intrinsically unstable.
Figure 5.
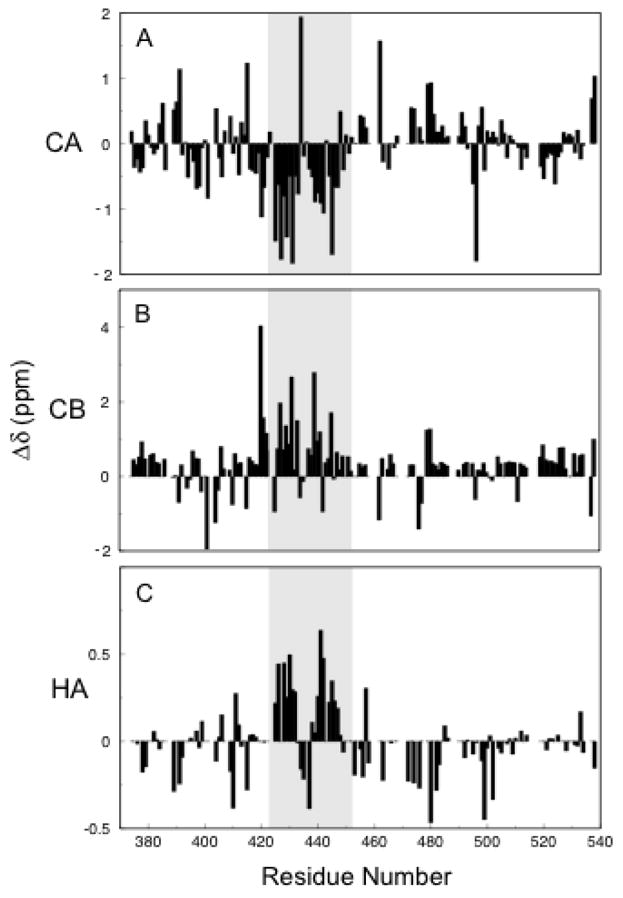
Chemical Shift Index for Cα (A), Cβ (B), and Hα (C) resonances. Negative and positive deviations from random coil values in CA and CB, respectively, and positive deviations from random coil in HA indicate β-strand. The shaded area indicates the region of the hairpin.
To test this suggestion, the Gibbs free energy of unfolding (ΔG), which is a direct measure of protein stability (48), has been determined for the Aα374-538 fragment in different conditions. Figure 6A presents unfolding curves obtained by titration of this fragment with urea at 25 °C while monitoring the ratio of fluorescence intensity at 370 nm to that at 330 nm as a measure of the spectral shift that accompanies unfolding. Analysis of these curves performed as described in the Experimental Procedures yielded the following values of ΔG. For the fragment in buffer containing 0.15 M NaCl the free energy was found to be very low, only 1.8 kcal/mol. Increasing NaCl concentration to 1 M increased ΔG only slightly, to 2.2 kcal/mol. This is in agreement with the small CSI shifts obtained at 0.15 and 0.5 M NaCl (see above). Although further increase in NaCl concentration to 2.0 M stabilized the structure more substantially, increasing its ΔG to 3.3 kcal/mol, the stability was still lower than that determined for typical globular proteins (48; 49). Similar values of the free energy have been obtained from the ΔG versus temperature profiles (Figure 6B and Table 2). These profiles, which actually represent the free energy of unfolding of the Aα374-538 fragment at any temperature, have been generated as described in Experimental Procedures using thermodynamic parameters of its heat-induced unfolding, the temperature midpoint (Tm), the enthalpy of unfolding (ΔH), and the difference between the heat capacities of the unfolded and folded states (ΔCp). The Tm and ΔH (Table 2) have been determined from the fluorescence-detected heat-induced unfolding curves presented in (30). The value of the ΔCp = 0.65 kcal/K·mol used for calculation of ΔG has been determined from the slope of the temperature dependence of the enthalpy (48) presented in Figure 6B, inset. It should be noted that this value was very close to that determined previously by DSC (30). Thus, the thermodynamic analysis of unfolding of the Aα374-538 fragment revealed that its ΔG is low. This is in agreement with the above suggestion that the isolated αC-domain fragment is intrinsically unstable.
Figure 6.

Determination of the free energy of unfolding of the Aα374-538 αC-domain fragment. Panel A shows the fluorescence-detected unfolding of the fragment in 0.15, 1.0 and 2.0 M NaCl (curves 1, 2 and 3, respectively) by titration with urea at 25 °C. The unfolding curves have been arbitrarily shifted along the vertical axis to improve visibility. The dashed straight lines illustrate the results of fitting of pre- and post-transition data; they provide the basis for estimating the fraction denatured as a function of urea concentration and calculating the equilibrium constant and ΔG as in (Ingham and Brew, 1992). The inset represents linear free energy plots of the titration data shown in the main panel. Panel B shows temperature dependence of the free energy of unfolding of the fragment in 0.15, 0.5, 1.0 and 2.0 M NaCl (curves 1, 2, 3 and 4, respectively) calculated as in (41; 56) using the thermodynamic parameters of unfolding, Tm and ΔH, presented in Table 2 and the ΔCp value equals to 0.65 kcal/K·mol obtained from the slope of the linear enthalpy plot presented in the inset.
Table 2.
Thermodynamic parameters of unfolding of the Aα374-538 αC-domain fragment.
DISCUSSION
The COOH-terminal portions of both fibrinogen Aα chains form two αC-domains, which are attached to the bulk of the molecule with flexible αC-connectors (4; 9; 11; 15). Although the X-ray structure of intact chicken fibrinogen has been established, the αC-domains were not observed in electron density maps, and therefore it was concluded that they are disordered (29). At the same time, differential scanning calorimetry (DSC) studies of bovine fibrinogen suggested that they contain a compact cooperative structure (3; 4). This suggestion was reinforced after the bovine and human αC-domain fragments (residues 374–568 and 490–610, respectively) were expressed and the presence of a compact cooperative structure was directly confirmed by fluorescence spectroscopy, circular dichroism (CD), and DSC (30). In the bovine αC-domain this structure has been further localized within its Aα374-538 region (30). The recombinant fragment corresponding to this region is thought to be a good candidate for structural studies by X-ray and NMR (30). While numerous attempts to crystallize this fragment undertaken in our laboratory (results not shown) and by others (31; 32) have been unsuccessful, the NMR studies presented here resulted in the first set of 3D structural data for the αC-domain of fibrinogen.
The most distinct feature of the structure of the Aα374-538 αC-domain fragment is the presence of an ordered type-I′ β-hairpin formed by the C423-C453 linked loop. The two antiparallel β-strands composing the hairpin are formed by the residues Aα425-433 and Aα437-445, while the remaining residues within the loop, Aα434-436 and Aα446-451, form a turn between the β-strands and a bulge, respectively; there is also a short turn preceding C423 formed by the residues Aα420-422. The structure reveals that only 18 out of 164 residues composing the Aα374-538 fragment are involved in formation of regular β-structure. This is in a good agreement with the previously observed small changes in far-UV ellipticity upon unfolding of this fragment (30). It should be noted that in spite of a substantial variation in amino acid sequences of the αC-domains from different vertebrate species, they all preserve a disulfide-linked loop (Figure 7) (32; 50). In all analyzed mammalian αC-domains, the loop consists of 31 residues (including two cysteine residues) and has a relatively high conservation (about 60% of identical residues). Even in such distant species as chicken, frog (Xenopus), and Zebrafish this loop has a very similar size (32, 30 and 29 residues, respectively) and share with the mammalian αC-domains a substantial homology. This suggests that the loop is an important structural/functional element of the αC-domain and that in all these species it is folded into a hairpin.
Figure 7.

Amino acid sequence of the bovine fibrinogen αC-domain region involved in formation of a compact ordered structure and its comparison with the homologous sequences from several vertebrate species. The arrows indicate bovine residues forming two antiparallel β-strands of the hairpin, residues forming charged and uncharged faces of the hairpin are indicated by grey and white boxes, respectively, those forming two turns and the bulge are denoted respectively by “t” and “b”. Asterisks indicate identical residues while conserved residues are indicated with crosses. Positively and negatively charged residues are in blue and red, respectively, non-polar residues are in green. The sequences were aligned with MUSCLE program (61).
Another distinct feature of the NMR structure is the existence of a collapsed hydrophobic region next to the hairpin. This region includes approximately 30 residues and has a higher content of non-polar residues than the rest of the Aα374-538 fragment (40% versus 31%) (Figure 7). In other species the content of non-polar residues in this region is even higher, reaching 55% in human, 56% in monkey and 59% in hamster. This region is presented in Figure 2 in multiple conformations only because no restraints were obtainable due to ambiguity and overlap in the NMR data. Therefore, this representation should not necessarily be interpreted as flexible, only undefined. In fact, our previous unfolding studies provide convincing evidences for the presence of tertiary structure in this region (30). First, the fluorescence data revealed that W460 located in this region is partially buried in the native structure and becomes totally exposed only upon its unfolding (30). This is in a good agreement with the data on urea-induced unfolding presented here in Figure 6A. Second, the near-UV CD spectra indicated that this tryptophan residue as well as a few phenylalanine residues present in this region are in a rigid environment and that they become flexible only after heat-induced unfolding (30). In addition, the human analog of this fragment, Aα392-610, which contains only phenylalanine residues in this region (Figure 7), also exhibited near-UV CD spectrum characteristic for Phe in a rigid environment (30). Third, the DSC study revealed a substantial change in the heat capacity (ΔCp) of the αC-domain upon denaturation (4; 30) that was confirmed in this study by an independent approach (see inset in Figure 6B). Since such changes are usually connected with the exposure of hydrophobic groups to a solvent upon unfolding (48) and since there are only few hydrophobic residues in the hairpin and they are already exposed, the only explanation for the observed ΔCp is that it is connected mainly with the unfolding of the hydrophobic collapsed region. Thus, the NMR data and the thermodynamic analysis presented here and in the previous studies (30) indicate that the collapsed hydrophobic region of the αC-domain might be folded into a compact structure. The 3D structure of this region needs to be further determined.
In spite of the presence of two distinct structural regions identified in this study, the β-hairpin and the collapsed hydrophobic region, the isolated αC-domain unfolds as a single cooperative unit (domain) as revealed by our previous DSC study (30). This suggests that the two regions cooperate with each other to form a single folded unit. Indeed, the hairpin is stabilized by only 10 hydrogen bonds and the equivalent of two salt bridges. Such a small network of polar contacts may not be sufficient to integrate all the elements of this region into a stable cooperative unit (domain). In fact, taking into account that the contribution of each hydrogen bond to the enthalpy of unfolding is about 1 kcal/mole (51; 52) and that contribution of an electrostatic interaction is even lower (53; 54), one can expect the total enthalpy of unfolding of the hairpin to be about 10–12 kcal/mol, i.e. more than twice lower than that measured for the unfolding of the Aα374-538 fragment (Fig. 6B, inset) (30). This means that the expected enthalpy of unfolding of the hairpin does not account for all experimentally determined enthalpy of unfolding of the αC-domain and therefore additional interactions, most probably in the hydrophobic region, should contribute to stabilization of its cooperative structure. Altogether, these data indicate that in the isolated bovine αC-domain the central portion including residues Aα421-483 is folded into a compact cooperative structure, which consists of the hairpin and the collapsed hydrophobic region while the remaining portions seem to be flexible. Whether in the parent molecule these portions remain flexible or they adopt folded conformation due to the presence of neighboring structures and/or intramolecular interactions remains to be clarified.
The small size of the compact region (domain) of the Aα374-538 fragment detected here (approximately 60–65 residues) is in good agreement with the relatively low enthalpy of unfolding for this fragment (Table 2). The free energy of unfolding of this domain (ΔG), which is a more fundamental measure of protein stability (48), is also low. In fact, under near-physiological conditions (0.15 M NaCl), the value of ΔG at room temperature determined by two independent approaches (from the urea- and heat-induced unfolding) was found to be 1.5–1.8 kcal/mol (Figure 6 and Table 2). This value is much lower than that determined for a typical globular protein, 12 ± 5 kcal/mol (48), and is also lower than those found for small domains consisting of 45–60 amino acid residues (41; 55; 56). This value exceeds that of thermal energy (RT) only about 3 times while in a typical stable protein ΔG exceeds RT more than 10 times (48). This suggests that the cooperative structure in the isolated αC-domain is at the edge of its stability. There are a number of examples indicating that in multidomain proteins even more stable small domains have a tendency to cooperate with neighbors through interactions to increase their stability (55–58). Therefore, it is not surprising that in fibrinogen the αC-domains are involved in intramolecular interactions with each other and with the central region of the molecule (4; 11; 14; 15). In fact, because the cooperative structure of the individual αC-domain is relatively small and have a very low energy of stabilization, such interactions may be driven by the need to achieve a higher stability which is necessary for the native structure to withstand thermal motion in a wide range of conditions.
Although in fibrinogen the αC-domains interact with each other (4; 11; 14; 15), the NMR data suggest that the isolated αC-domains do not form a dimer because the relaxation data of the structured regions (NOE < 0; T1 ~650 ms) are more congruent with an 18 kDa monomer than a 36 kDa dimer. Also, no dimer formation was observed previously by light scattering and ultracentrifugation (59). The most probable explanation for these observations is that the interaction between the αC-domains is too weak and that to keep them together additional interactions with the bulk of the molecule are required. Such interactions with the fibrinogen central region were detected by electron microscopy (12). Furthermore, it was shown that they occur mainly through fibrinopeptides B whose removal with thrombin resulted in dissociation of the αC-domains (14). However, in fibrin, the αC-domains again interact with each other intermolecularly forming αC polymers (15). The mechanism underlying the intra- to intermolecular switch is not established yet. One can only speculate that the intermolecular interactions between the αC-domains may be driven by the same factors as the intramolecular ones, i.e. by the need to achieve a higher stability, and that some additional interactions with the newly formed fibrin conformation may also be required to reinforce their stability. Thus, the NMR data presented here in combination with the thermodynamic analysis of unfolding of the αC-domains revealed that the compact portion of the αC-domain is relatively small and unstable, and suggests that they may cooperate with each other and with the neighboring structures to increase their stability. This may be a reason for intramolecular interactions of the αC-domains in fibrinogen and for their switch to intermolecular interactions in fibrin.
Analysis of the structure of the hairpin revealed several interesting features. First, the disulfide-linked loop forming the hairpin has the following sequence motif, C423-X-(K/R425)-X-K429-X-(V/I431)-X-(D/E435)-G436-X-E439-X-E443-X-S447-X-G450-X-C453 (bovine numbering), which is highly conserved among the species (Figure 7). Among the residues of this motif, the positively charged K425 and K429 as well as V431 are located in the NH2-terminal β-strand, D435-G436 are in the turn, the negatively charged E439 and E443 are in the other β-strand, and S447 and G450 are in the bulge. Second, while one side of the hairpin is formed by mainly uncharged residues the other side is highly charged (Figures 3 and 7). Remarkably, all conserved residues of the β-strands are located on this side; in addition, the conserved negatively charged D435 of the turn is also facing the same direction. Further, this side contains at the base of the hairpin two clusters of negatively and positively charged residues brought together by the disulfide linkage and a chain of charged residues which are arranged from the top to the base of the hairpin in almost linear manner. The negatively charged cluster is formed by E448-D449 and D452 of the bulge and the positively charged cluster is formed by R420-R421 of the turn preceding C423 and by K425 and K429 of the first β-strand. The chain includes negatively charged E449 at the top of the hairpin followed by positively charged R437 and negatively charged E439 and E443. Both clusters and the linearly arranged charged residues make a characteristic charged pattern. This pattern is highly conserved in the analyzed mammalian αC-domains and is also partially preserved in more evolutionary distant vertebrate species suggesting its structural/functional importance. Although its exact role is not clear, it is tempting to speculate that such pattern may be involved in the intra- and/or intermolecular interactions of the αC-domains. The previously suggested involvement of charged residues in interaction of the αC-domains with themselves and with the central region of the molecule through negatively charged fibrinopeptides B (12; 14) is in good agreement with this speculation.
In summary, the NMR solution structure of the bovine fibrinogen Aα374-538 αC-domain fragment revealed that about 40% of its residues (approximately Aα420-483) are involved in formation of a compact structure represented by the β-hairpin and collapsed hydrophobic region. The previous analysis of unfolding of this fragment suggests that the hairpin and the collapsed region form together an independently folded compact cooperative unit (domain). The NMR data and the thermodynamic analysis of unfolding of this fragment presented in this study also revealed that this unit is intrinsically unstable suggesting that in the parent molecule the αC-domains may cooperate with each other and with the neighboring structures to increase their stability. This implies that the suggested intra- to intermolecular switch of the αC-domains upon fibrin assembly (13–15) may be thermodynamically driven.
Footnotes
This work was supported by National Institute of Health Grant HL-56051 to L. M. and by the Intramural Research Program of the NIH, National Heart, Lung, and Blood Institute to N. T.
FPA and FPB, Fibrinopeptides A and B, respectively; CSI, Chemical Shift Indexing; RDC, Residual Dipolar Coupling; NOE, Nuclear Overhauser Effect; DSC, Differential Scanning Calorimetry; CD, Circular Dichroism.
In the bovine fibrinogen Aα chain this sequence is replaced with RGG.
Corresponds to the human fibrinogen sequence Aα392-582
References
- 1.Doolittle RF. Fibrinogen and fibrin. Annu Rev Biochem. 1984;53:195–229. doi: 10.1146/annurev.bi.53.070184.001211. [DOI] [PubMed] [Google Scholar]
- 2.Henschen A, McDonagh J. Fibrinogen, fibrin and factor XIII. In: Zwaal RFA, Hemker HC, editors. Blood Coagulation. Amsterdam: Elsievier Science Publishers; 1986. pp. 171–241. [Google Scholar]
- 3.Privalov PL, Medved LV. Domains in the fibrinogen molecule. J Mol Biol. 1982;159:665–683. doi: 10.1016/0022-2836(82)90107-3. [DOI] [PubMed] [Google Scholar]
- 4.Medved LV, Gorkun OV, Privalov PL. Structural organization of C-terminal parts of fibrinogen A alpha- chains. FEBS Lett. 1983;160:291–295. doi: 10.1016/0014-5793(83)80985-5. [DOI] [PubMed] [Google Scholar]
- 5.Medved L, Litvinovich S, Ugarova T, Matsuka Y, Ingham K. Domain structure and functional activity of the recombinant human fibrinogen γ-module (γ148–411) Biochemistry. 1997;36:4685–4693. doi: 10.1021/bi962795l. [DOI] [PubMed] [Google Scholar]
- 6.Madrazo J, Brown JH, Litvinovich S, et al. Crystal structure of the central region of bovine fibrinogen (E5 fragment) at 1.4-A resolution. Proc Natl Acad Sci U S A. 2001;98:11967–11972. doi: 10.1073/pnas.211439798. [DOI] [PMC free article] [PubMed] [Google Scholar]
- 7.Hall C, Slayter H. The fibrinogen molecule: its size, shape and mode of polymerization. J Biophys Biochem Cytology. 1959;5:11–16. doi: 10.1083/jcb.5.1.11. [DOI] [PMC free article] [PubMed] [Google Scholar]
- 8.Doolittle RF. Structural aspects of the fibrinogen to fibrin conversion. Adv Protein Chem. 1973;27:1–109. doi: 10.1016/s0065-3233(08)60446-5. [DOI] [PubMed] [Google Scholar]
- 9.Weisel JW, Stauffacher CV, Bullitt E, Cohen C. A model for fibrinogen: domains and sequence. Science. 1985;230:1388–1391. doi: 10.1126/science.4071058. [DOI] [PubMed] [Google Scholar]
- 10.Weisel JW. Fibrinogen and fibrin. Adv Protein Chem. 2005;70:247–299. doi: 10.1016/S0065-3233(05)70008-5. [DOI] [PubMed] [Google Scholar]
- 11.Erickson HP, Fowler WE. Electron microscopy of fibrinogen, its plasmic fragments and small polymers. Ann N Y Acad Sci. 1983;408:146–163. doi: 10.1111/j.1749-6632.1983.tb23242.x. [DOI] [PubMed] [Google Scholar]
- 12.Veklich YI, Gorkun OV, Medved LV, Nieuwenhuizen W, Weisel JW. Carboxyl-terminal portions of the α chains of fibrinogen and fibrin. Localization by electron microscopy and the effects of isolated αC fragments on polymerization. J Biol Chem. 1993;268:13577–13585. [PubMed] [Google Scholar]
- 13.Medved LV, Gorkun OV, Manyakov VF, Belitser VA. The role of fibrinogen αC-domains in the fibrin assembly process. FEBS Lett. 1985;181:109–112. doi: 10.1016/0014-5793(85)81123-6. [DOI] [PubMed] [Google Scholar]
- 14.Gorkun OV, Veklich YI, Medved LV, Henschen AH, Weisel JW. Role of the αC domains of fibrin in clot formation. Biochemistry. 1994;33:6986–6997. doi: 10.1021/bi00188a031. [DOI] [PubMed] [Google Scholar]
- 15.Weisel JW, Medved L. The structure and function of the αC domains of fibrinogen. Ann N Y Acad Sci. 2001;936:312–327. doi: 10.1111/j.1749-6632.2001.tb03517.x. [DOI] [PubMed] [Google Scholar]
- 16.Collet JP, Moen JL, Veklich YI, et al. The {alpha}C domains of fibrinogen affect the structure of the fibrin clot, its physical properties, and its susceptibility to fibrinolysis. Blood. 2005 doi: 10.1182/blood-2005-05-2150. [DOI] [PMC free article] [PubMed] [Google Scholar]
- 17.Credo RB, Curtis CG, Lorand L. Alpha-chain domain of fibrinogen controls generation of fibrinoligase (coagulation factor XIIIa). Calcium ion regulatory aspects. Biochemistry. 1981;20:3770–3778. doi: 10.1021/bi00516a016. [DOI] [PubMed] [Google Scholar]
- 18.Cheresh DA, Berliner SA, Vicente V, Ruggeri ZM. Recognition of distinct adhesive sites on fibrinogen by related integrins on platelets and endothelial cells. Cell. 1989;58:945–953. doi: 10.1016/0092-8674(89)90946-x. [DOI] [PubMed] [Google Scholar]
- 19.Corbett SA, Lee L, Wilson CL, Schwarzbauer JE. Covalent cross-linking of fibronectin to fibrin is required for maximal cell adhesion to a fibronectin-fibrin matrix. J Biol Chem. 1997;272:24999–25005. doi: 10.1074/jbc.272.40.24999. [DOI] [PubMed] [Google Scholar]
- 20.Corbett SA, Schwarzbauer JE. Fibronectin-fibrin cross-linking; a regulator of cell behavior. Trends Cardiovasc Med. 1998;8:357–362. doi: 10.1016/s1050-1738(98)00028-0. [DOI] [PubMed] [Google Scholar]
- 21.Belkin AM, Tsurupa G, Zemskov E, Veklich Y, Weisel JW, Medved L. Transglutaminase-mediated oligomerization of the fibrin(ogen) αC domains promotes integrin-dependent cell adhesion and signaling. Blood. 2005;105:3561–3568. doi: 10.1182/blood-2004-10-4089. [DOI] [PMC free article] [PubMed] [Google Scholar]
- 22.Tsurupa G, Ho-Tin-Noe B, Angles-Cano E, Medved L. Identification and characterization of novel lysine-independent apolipoprotein(a)-binding sites in fibrin(ogen) alphaC-domains. J Biol Chem. 2003;278:37154–37159. doi: 10.1074/jbc.M305154200. [DOI] [PubMed] [Google Scholar]
- 23.Sakata Y, Aoki N. Cross-linking of alpha 2-plasmin inhibitor to fibrin by fibrin-stabilizing factor. J Clin Invest. 1980;65:290–297. doi: 10.1172/JCI109671. [DOI] [PMC free article] [PubMed] [Google Scholar]
- 24.Tsurupa G, Medved L. Identification and characterization of novel tPA- and plasminogen- binding sites within fibrin(ogen) αC-domains. Biochemistry. 2001;40:801–808. doi: 10.1021/bi001789t. [DOI] [PubMed] [Google Scholar]
- 25.Medved L, Nieuwenhuizen W. Molecular mechanisms of initiation of fibrinolysis by fibrin. Thromb Haemost. 2003;89:409–419. [PubMed] [Google Scholar]
- 26.Spraggon G, Everse SJ, Doolittle RF. Crystal structures of fragment D from human fibrinogen and its crosslinked counterpart from fibrin. Nature. 1997;389:455–462. doi: 10.1038/38947. [DOI] [PubMed] [Google Scholar]
- 27.Pechik I, Madrazo J, Mosesson MW, Hernandez I, Gilliland GL, Medved L. Crystal structure of the complex between thrombin and the central “E” region of fibrin. Proc Natl Acad Sci USA. 2004;101:2718–2723. doi: 10.1073/pnas.0303440101. [DOI] [PMC free article] [PubMed] [Google Scholar]
- 28.Brown JH, Volkmann N, Jun G, Henschen-Edman AH, Cohen C. The crystal structure of modified bovine fibrinogen. Proc Natl Acad Sci U S A. 2000;97:85–90. doi: 10.1073/pnas.97.1.85. [DOI] [PMC free article] [PubMed] [Google Scholar]
- 29.Yang Z, Kollman JM, Pandi L, Doolittle RF. Crystal structure of native chicken fibrinogen at 2.7 A resolution. Biochemistry. 2001;40:12515–12523. doi: 10.1021/bi011394p. [DOI] [PubMed] [Google Scholar]
- 30.Tsurupa G, Tsonev L, Medved L. Structural organization of the fibrin(ogen) αC-domain. Biochemistry. 2002;41:6449–6459. doi: 10.1021/bi025584r. [DOI] [PubMed] [Google Scholar]
- 31.Doolittle RF. Structural basis of the fibrinogen-fibrin transformation: contributions from X-ray crystallography. Blood Rev. 2003;17:33–41. doi: 10.1016/s0268-960x(02)00060-7. [DOI] [PubMed] [Google Scholar]
- 32.Doolittle RF, Kollman JM. Natively unfolded regions of the vertebrate fibrinogen molecule. Proteins: Structure, Function, Bioinformatics. 2005 doi: 10.1002/prot.20758. in press. [DOI] [PubMed] [Google Scholar]
- 33.Cavanagh J, Fairbrother WJ, Palmer AGI, Skelton NJ. Protein NMR Spectroscopy: principles and practice. 1. San Diego, California; Academic Press: 1996. [Google Scholar]
- 34.Ottiger M, Delaglio F, Bax A. Measurement of J and dipolar couplings from simplified two-dimensional NMR spectra. J Magn Reson. 1998;131:373–378. doi: 10.1006/jmre.1998.1361. [DOI] [PubMed] [Google Scholar]
- 35.Delaglio F, Grzesiek S, Vuister GW, Zhu G, Pfeifer J, Bax A. NMRPipe: a multidimensional spectral processing system based on UNIX pipes. J Biomol NMR. 1995;6:277–293. doi: 10.1007/BF00197809. [DOI] [PubMed] [Google Scholar]
- 36.Garrett DS, Powers R, Gronenborn A, Clore GM. A common-sense approach to peak picking in 2-dimensional, 3-dimensional, and 4-dimentional spectra using automatic computer-analysis of contour diagrams. Journal Magnetic Resonance. 1991;95:214–220. doi: 10.1016/j.jmr.2011.09.007. [DOI] [PubMed] [Google Scholar]
- 37.Grzesiek S, Bax A. The importance of not saturating water in protein NMR. Application to sensitivity enhancement and NOE measurements. J Am Chem Soc. 1993;115:12593–12594. [Google Scholar]
- 38.Schwieters CD, Kuszewski JJ, Tjandra N, Clore GM. The Xplor-NIH NMR molecular structure determination package. J Magn Reson. 2003;160:65–73. doi: 10.1016/s1090-7807(02)00014-9. [DOI] [PubMed] [Google Scholar]
- 39.Cornilescu G, Delaglio F, Bax A. Protein backbone angle restraints from searching a database for chemical shift and sequence homology. J Biomol NMR. 1999;13:289–302. doi: 10.1023/a:1008392405740. [DOI] [PubMed] [Google Scholar]
- 40.Ingham KC, Brew SA. Integrity of refolded and reoxidized gelatin-binding fragments of fibronectin. Proteins. 1992;12:180–187. doi: 10.1002/prot.340120211. [DOI] [PubMed] [Google Scholar]
- 41.Alexander P, Fahnestock S, Lee T, Orban J, Bryan P. Thermodynamic analysis of the folding of the streptococcal protein G IgG-binding domains B1 and B2: why small proteins tend to have high denaturation temperatures. Biochemistry. 1992;31:3597–3603. doi: 10.1021/bi00129a007. [DOI] [PubMed] [Google Scholar]
- 42.Schwarzinger S, Kroon GJ, Foss TR, Wright PE, Dyson HJ. Random coil chemical shifts in acidic 8 M urea: implementation of random coil shift data in NMRView. J Biomol NMR. 2000;18:43–48. doi: 10.1023/a:1008386816521. [DOI] [PubMed] [Google Scholar]
- 43.Schwarzinger S, Kroon GJ, Foss TR, Chung J, Wright PE, Dyson HJ. Sequence-dependent correction of random coil NMR chemical shifts. J Am Chem Soc. 2001;123:2970–2978. doi: 10.1021/ja003760i. [DOI] [PubMed] [Google Scholar]
- 44.Hutchinson EG, Thornton JM. A revised set of potentials for beta-turn formation in proteins. Protein Sci. 1994;3:2207–2216. doi: 10.1002/pro.5560031206. [DOI] [PMC free article] [PubMed] [Google Scholar]
- 45.Wishart DS, Sykes BD, Richards FM. The chemical shift index: a fast and simple method for the assignment of protein secondary structure through NMR spectroscopy. Biochemistry. 1992;31:1647–1651. doi: 10.1021/bi00121a010. [DOI] [PubMed] [Google Scholar]
- 46.Wishart DS, Sykes BD. The 13C chemical-shift index: a simple method for the identification of protein secondary structure using 13C chemical-shift data. J Biomol NMR. 1994;4:171–180. doi: 10.1007/BF00175245. [DOI] [PubMed] [Google Scholar]
- 47.Sharman GJ, Griffiths-Jones SR, Jourdan M, Searle MS. Effects of amino acid phi,psi propensities and secondary structure interactions in modulating H alpha chemical shifts in peptide and protein beta-sheet. J Am Chem Soc. 2001;123:12318–12324. doi: 10.1021/ja0116369. [DOI] [PubMed] [Google Scholar]
- 48.Privalov PL. Stability of proteins: small globular proteins. Adv Protein Chem. 1979;33:167–241. doi: 10.1016/s0065-3233(08)60460-x. [DOI] [PubMed] [Google Scholar]
- 49.Privalov PL, Khechinashvili NN. A thermodynamic approach to the problem of stabilization of globular protein structure: a calorimetric study 36. J Mol Biol. 1974;86:665–684. doi: 10.1016/0022-2836(74)90188-0. [DOI] [PubMed] [Google Scholar]
- 50.Murakawa M, Okamura T, Kamura T, Shibuya T, Harada M, Niho Y. Diversity of primary structures of the carboxy-terminal regions of mammalian fibrinogen A alpha-chains. Characterization of the partial nucleotide and deduced amino acid sequences in five mammalian species; rhesus monkey, pig, dog, mouse and Syrian hamster. Thromb Haemost. 1993;69:351–360. [PubMed] [Google Scholar]
- 51.Lopez MM, Chin DH, Baldwin RL, Makhatadze GI. The enthalpy of the alanine peptide helix measured by isothermal titration calorimetry using metal-binding to induce helix formation. Proc Natl Acad Sci USA. 2002;99:1298–1302. doi: 10.1073/pnas.032665199. [DOI] [PMC free article] [PubMed] [Google Scholar]
- 52.Dragan AI, Privalov PL. Unfolding of a leucine zipper is not a simple two-state transition. J Mol Biol. 2002;321:891–908. doi: 10.1016/s0022-2836(02)00699-x. [DOI] [PubMed] [Google Scholar]
- 53.Makhatadze GI, Privalov PL. Energetics of protein structure. Adv Protein Chem. 1995;47:307–425. doi: 10.1016/s0065-3233(08)60548-3. [DOI] [PubMed] [Google Scholar]
- 54.Dragan AI, Read CM, Makeyeva EN, et al. DNA binding and bending by HMG boxes: energetic determinants of specificity. J Mol Biol. 2004;343:371–393. doi: 10.1016/j.jmb.2004.08.035. [DOI] [PubMed] [Google Scholar]
- 55.Vysotchin A, Medved LV, Ingham KC. Domain structure and domain-domain interactions in human coagulation factor IX. J Biol Chem. 1993;268:8436–8446. [PubMed] [Google Scholar]
- 56.Novokhatny VV, Ingham KC. Domain structure of the Fib-1 and Fib-2 regions of human fibronectin. Thermodynamic properties of the type I finger module. J Mol Biol. 1994;238:833–844. doi: 10.1006/jmbi.1994.1337. [DOI] [PubMed] [Google Scholar]
- 57.Medved LV, Orthner CL, Lubon H, Lee TK, Drohan WN, Ingham KC. Thermal stability and domain-domain interactions in natural and recombinant protein C. J Biol Chem. 1995;270:13652–13659. doi: 10.1074/jbc.270.23.13652. [DOI] [PubMed] [Google Scholar]
- 58.Litvinovich SV, Strickland DK, Medved LV, Ingham KC. Domain structure and interactions of the type I and type II modules in the gelatin-binding region of fibronectin. All six modules are independently folded. J Mol Biol. 1991;217:563–575. doi: 10.1016/0022-2836(91)90758-x. [DOI] [PubMed] [Google Scholar]
- 59.Tsurupa G, Veklich Y, Hantgan R, Belkin AM, Weisel JW, Medved L. Do the isolated fibrinogen αC-domains form ordered oligomers? Biophys Chem. 2004;112:257–266. doi: 10.1016/j.bpc.2004.07.028. [DOI] [PubMed] [Google Scholar]
- 60.Koradi R, Billeter M, Wuthrich K. MOLMOL: a program for display and analysis of macromolecular structures. J Mol Graph. 1996;14:51–32. doi: 10.1016/0263-7855(96)00009-4. [DOI] [PubMed] [Google Scholar]
- 61.Edgar RC. MUSCLE: multiple sequence alignment with high accuracy and high throughput. Nucleic Acids Res. 2004;32:1792–1797. doi: 10.1093/nar/gkh340. [DOI] [PMC free article] [PubMed] [Google Scholar]