

Abstract
Contrast-enhanced (CE) transcranial ultrasound (US) and reconstructed 3D transcranial ultrasound have shown advantages over traditional methods in a variety of cerebrovascular diseases. We present the results from a novel ultrasound technique, namely real-time 3D contrast-enhanced transcranial ultrasound. Using real-time 3D (RT3D) ultrasound and micro-bubble contrast agent, we scanned 17 healthy volunteers via a single temporal window and 9 via the sub-occipital window and report our detection rates for the major cerebral vessels. In 71% of subjects, both of our observers identified the ipsilateral circle of Willis from the temporal window, and in 59% we imaged the entire circle of Willis. From the sub-occipital window, both observers detected the entire vertebrobasilar circulation in 22% of subjects, and in 44% the basilar artery. After performing phase aberration correction on one subject, we were able to increase the diagnostic value of the scan, detecting a vessel not present in the uncorrected scan. These preliminary results suggest that RT3D CE transcranial US and RT3D CE transcranial US with phase aberration correction have the potential to greatly impact the field of neurosonology.
Keywords: Transcranial, Ultrasound contrast, Intracranial Arteries, 3D Imaging, Phase Aberration
INTRODUCTION
Reliable transpulmonary ultrasound contrast agents have enabled a renaissance in transcranial ultrasound (US) imaging, despite the image-degrading properties of the skull. Recent reviews have examined the role of ultrasound in the evaluation of stroke and other pathologies of the cerebrovascular system (Bogdahn et al. 1998; Gahn and von Kummer 2001). The typical examination includes the use of a phased-array scanner, operating at approximately 2 MHz, applied to the temporal and sub-occipital acoustic windows, combined with the administration of contrast agents and examination of blood vessels with color and spectral Doppler. Examination using contrast-enhanced (CE) ultrasound has shown advantages over traditional US in assessing ischemic cerebrovascular disease by visualizing intracranial arteries and collateral circulation (Bogdahn et al. 1993; Otis et al. 1995; Baumgartner et al. 1997; Droste et al. 2000) and in the vascularization of tumors (Bogdahn et al. 1993), and has also made possible perfusion imaging of the human brain (Wiesmann and Seidel 2007). Recently, there have also been descriptions of offline reconstructed CE 3D transcranial US scanning, achieved by rotation of the transducer or electromagnetic positioning of the transducer. The process takes several minutes and has shown advantages in the assessment of collateral circulation (Wessels et al. 2004), the diagnosis of vascular anatomy and lesion vascularity for tumors (Bauer et al. 1998), and the analysis of intracranial aneurysms (Klötzsch et al. 1999).
Of course, the skull bone, with its properties of high attenuation and thickness variations, remains the formidable barrier to improvement of transcranial ultrasound. In vivo measurements have been made of human calvaria thicknesses using magnetic resonance imaging (MRI) and computed tomography (CT) (Hynynen and Sun 1999; Clement and Hynynen 2002). Fortunately, in the temporal acoustic window, the skull bone is thin, compact, and relatively free of internal scatterers, and thus provides imaging access to the cerebral vessels. The attenuation in the ivory bone of the temporal window is 2.8 dB cm−1 MHz−1, compared to 25–70 dB cm−1 MHz−1 in cancellous bone (White and Stevenson 1978). A study of skull thickness in the Japanese population using 30 male skulls and 25 female skulls showed that the temporal region varied in thickness from only 2 to 3 mm (Furuhata 1998). Therefore, one must examine the variations in skull thickness over the acoustic windows as a primary source of image degradation. Several investigators have measured such thickness variations, Δz, across a transducer array operating at a center frequency f0 for an acoustic velocity of skull, cS = 2650 m/s (Fry and Barger 1978), and acoustic velocity of brain, cB = 1530 m/s (Goss et al. 1978). In both transmit and receive modes, the thickness variations cause shifts in the arrival time of the ultrasound waves to and from each array element, giving rise to phase aberrations Δ ϕ where
| (1) |
These phase aberrations broaden the ultrasound beam, degrading spatial resolution and reducing the contrast and sensitivity of transcranial ultrasound images. In addition, a given aberration becomes more severe as transducer frequency increases. Attempts to correct for phase aberration due to abdominal fat layers have recently moved to 1.75D arrays, typically from 3×80 to 8×96 elements (Liu and Waag 1995; Li and Robinson 2000; Rigby et al. 2000; Gauss et al. 2001; Lacefield and Waag 2001), in order to adequately spatially sample the aberrator. In 2006, we described our ability to correct for phase aberration on the Duke/Volumetrics real-time 3D (RT3D) scanner with electronic and polymer skull-casting aberrators (Ivancevich et al. 2006b). The high attenuation in the rest of the skull limits correlation-based phase aberration correction with diagnostic imaging-level intensities to the acoustic windows due to low signal-to-noise.
Our research group has a long standing interest in both RT3D US and adaptive imaging for transcranial US. During the last decade, we have concentrated our efforts in RT3D US imaging primarily on cardiac applications. Originally developed at Duke University (Smith et al. 1991; VonRamm et al. 1991), the Volumetrics Medical Imaging (VMI, Durham, NC) commercial 3D system uses a 2-D matrix phased-array to scan a 65°–90° pyramid to produce real-time volumetric scans at up to 30 volumes per second. To our knowledge, in 1978, we described the first real-time B-scan of the brain (Smith et al. 1978). We also investigated adaptive signal processing techniques to correct for a planar layer of skull bone (Smith et al. 1986), and in general for a 3D US scanner (Ivancevich et al. 2006b). In 2004, we described the first RT3D images of the adult brain (Smith et al. 2004). Other groups are investigating phase aberration correction for transcranial ultrasound using time-reversal mirrors (Fink 1992), MRI and CT guidance (Hynynen and Sun 1999; Clement and Hynynen 2002), and shear mode conversion (Clement et al. 2003).
In this paper, we describe the results from a pilot study of real-time 3D contrast-enhanced transcranial ultrasound and from a single phase aberration correction experiment. We present the detection rates for the major cerebral vessels and the circle of Willis in 17 healthy volunteers and images and metrics from a single successful in vivo phase aberration correction.
SUBJECTS AND METHODS
Subjects
Per an IRB-approved protocol, we performed RT3D CE US examinations on 17 healthy volunteers, (13 men, 4 women, mean age 35.1 years old). Exclusion criteria were pregnancy or lactation, history of neurological disease, congenital heart defect, severe liver dysfunction, respiratory distress syndrome, cardiac shunts, and hypersensitivity to octaflouropropane. No subjects experienced adverse reactions to the contrast agent or the procedure. Each volunteer gave their informed consent, as required by the IRB protocol.
Contrast Agent
We injected volunteers intravenously with 10 μL/kg of activated Definity™ (Bristol-Myers Squibb Inc., New York, NY), an octaflouropropane filled lipid-coated microsphere ultrasound contrast agent, within 30–60 seconds, followed by a 10 mL saline flush.
Real-Time 3D Ultrasound System
We scanned subjects with the Duke/Volumetrics RT3D ultrasound system. The commercial VMI scanner generates a 3D pyramidal scan of 65°–90° using as many as 512 transmitters and 256 receive channels. The scanner uses 16:1 receive-mode parallel processing to generate 4096 B-mode image lines at up to 30 volumes per second. Figure 1 shows a schematic of the matrix phased array transducer producing a pyramidal scan and displaying two simultaneous orthogonal B-mode image planes, corresponding to axial and coronal image planes, as well as two C-mode planes, corresponding to parasagittal image planes. These planes may be positioned at any desired angle and depth in the pyramid, both during the scanning operation and during playback. The system also images in real-time 3D color or spectral Doppler modes over the full pyramidal scan. The transcranial transducer used in this study consisted of a sparse 2D array operating at a center frequency of 2.5 MHz, previously described by Light et al. (1998). The active elements of the array include 440 transmit elements and 256 receive elements with a minimum inter-element spacing of 0.35 mm and total aperture diameter of 13 mm.
Fig. 1.
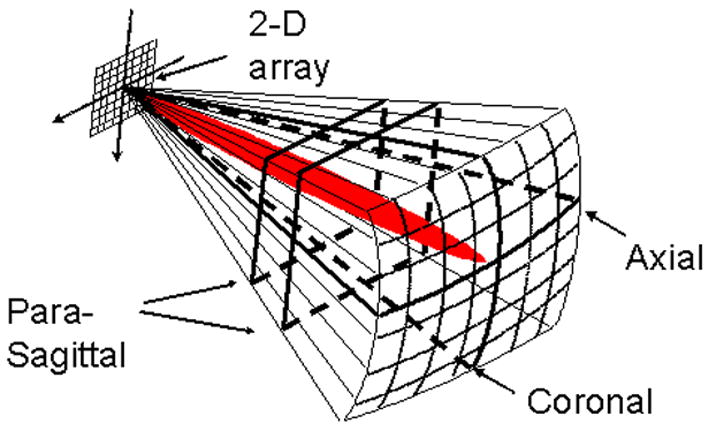
Schematic of 2D matrix array scanning a pyramid and displaying simultaneous axial, coronal, and parasagittal scans, as well as steerable spectral Doppler (red).
Examination
We imaged a 65° pyramid for each subject from one temporal window. First, the sonographer imaged through the temporal bone to find the acoustic window, and then we imaged in color Doppler mode to try to visualize flow without contrast. Next, we injected contrast and we attempted to visualize the middle cerebral artery (MCA) and the circle of Willis in an axial color Doppler scan, and then saved the volumetric echo and Doppler data for later inspection. In color Doppler mode we used a packet size of 9 firings at a pulse repetition frequency (PRF) between 3.4 and 3.6 kHz and the default Volumetrics wall filter. Additionally, we changed the color write priority to the maximum (i.e. echo data was never written over a voxel containing color signal). The color flow reject (adjustable from 0 to 255) prevents writing of color flow data with a magnitude less than the reject value. This was set to 6, the default value for the scanner. In nine subjects, we also scanned from the sub-occipital window, and after identifying a vertebral artery, we again saved the volumetric data. We acquired spectral Doppler with a PRF between 3.0 and 3.4 kHz for 14 blood vessels. Spectral Doppler is used quite extensively in neurosonology, often in so-called “blind” transcranial Doppler (TCD) and in 2D B-mode ultrasound with color flow Doppler. Spectral Doppler allows a more accurate velocity estimation and better temporal resolution than color or power Doppler. It is often used to compute the time-averaged mean velocity and pulsatility index of a vessel to aid in the diagnosis of pathology.
Data Visualization/Offline Processing
In real-time, we were able to view the data on the ultrasound scanner. The scanner displays three orthogonal planes (axial, coronal, and parasagittal) of the data, as shown in the schematic in Figure 1. Offline, we were able to process the scanner’s saved volumes for 3D Doppler volume rendering with a freeware volume rendering software package (3DView, RMR Systems Ltd., East Anglia, UK). The pre-processing was accomplished in MATLAB (The MathWorks, Natick, MA), and a block diagram is shown in Figure 2. Saved volumes consist of four pieces of data recorded over three seconds: traditional B-mode echo data, and the magnitude (echo strength), velocity, and variance of the Doppler signal, at each point in the scan in an r, θ, ϕ azimuth-elevation coordinate system, previously described by Smith et al. (1991). First, the color Doppler velocity and magnitude data was extracted from the full volumetric data and averaged over all frames. Next, the data was scan-converted from the r, θ, ϕ azimuth-elevation coordinate system to x, y, z Cartesian coordinates. The magnitude data was then multiplied by the sign of the velocity data, and the velocity data was discarded. The magnitude was used so that the observer could interactively adjust the threshold for display. The sign of the velocity was maintained so that vessel direction was preserved, which aided in identification. Next, the data was scaled and shifted to map zero magnitude to a value of 128. The data was then saved as raw binary unsigned 8 bit data. The data was loaded into the 3D volume rendering software and custom transfer functions were loaded, which mapped voxels with magnitude less than 128 to blue, and magnitude greater than 128 to red, and suppressed (made transparent) voxels with a magnitude less than a user-adjusted threshold. A sample volume rendering and a corresponding schematic are shown in Figure 3C and D, respectively.
Fig. 2.
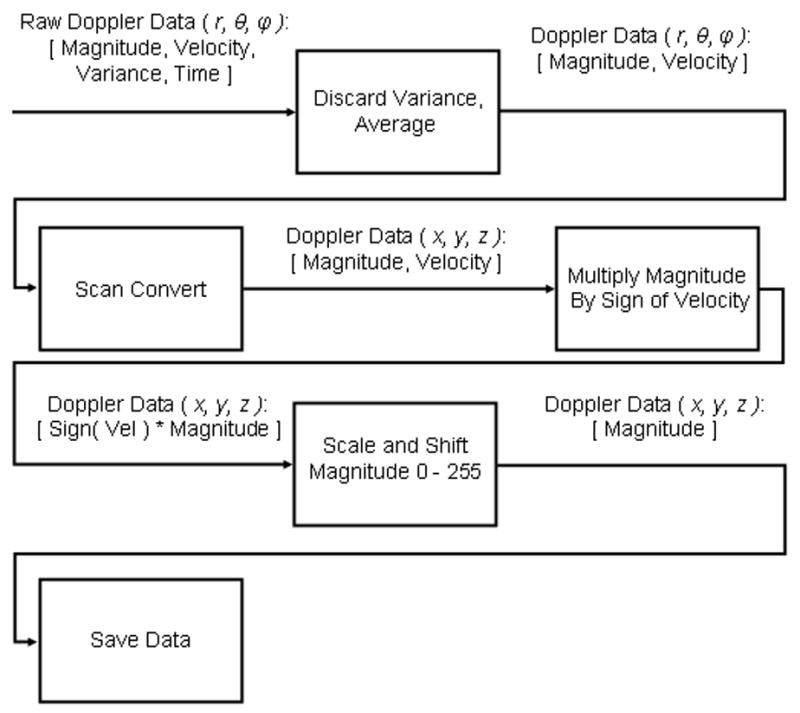
Flowchart of signal processing for offline 3D Doppler volume rendering.
Fig. 3.
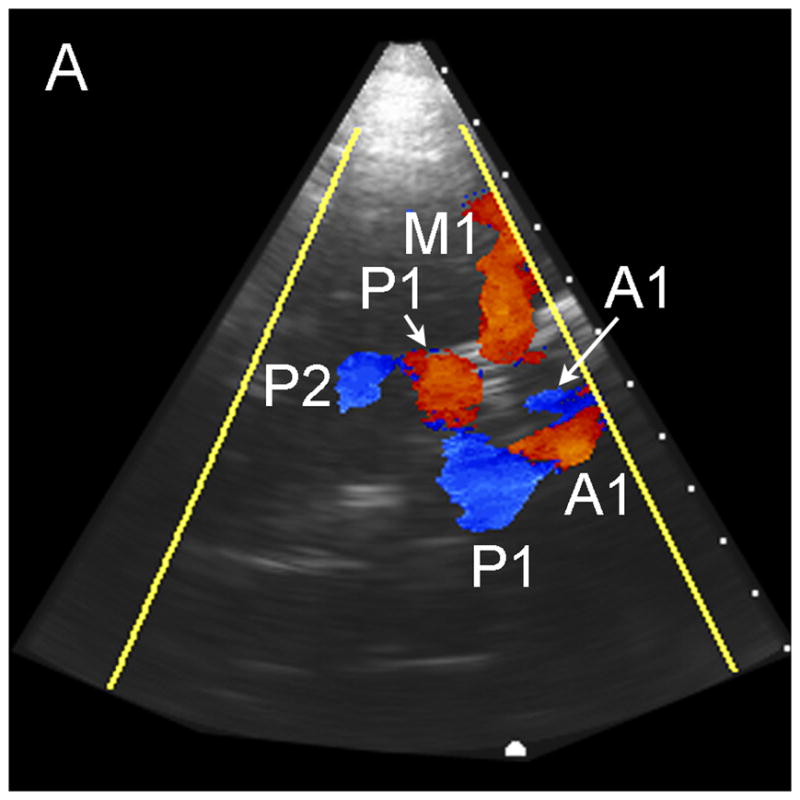
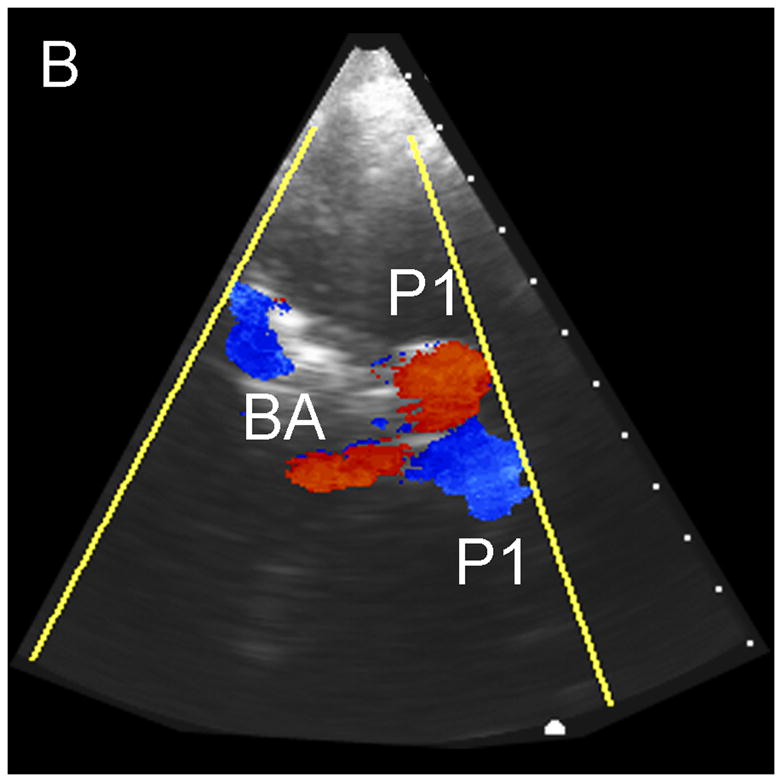
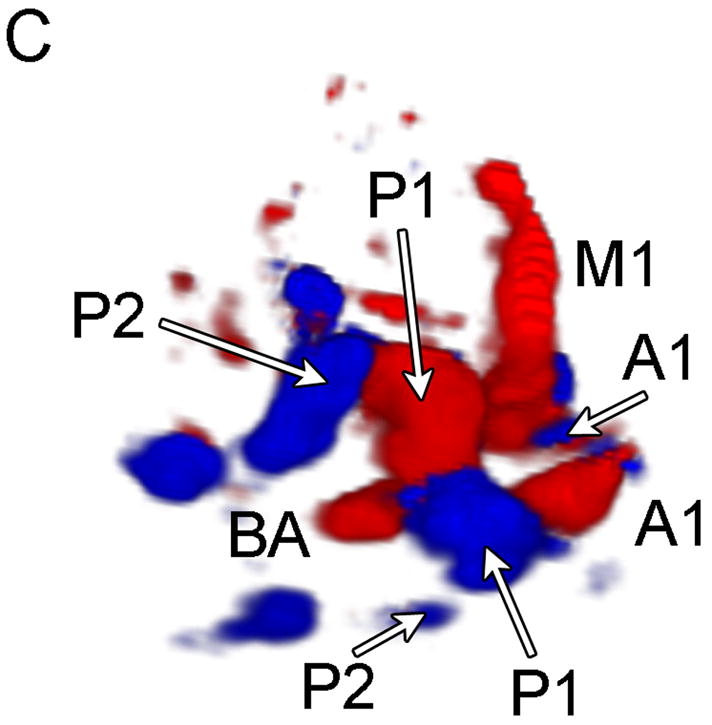
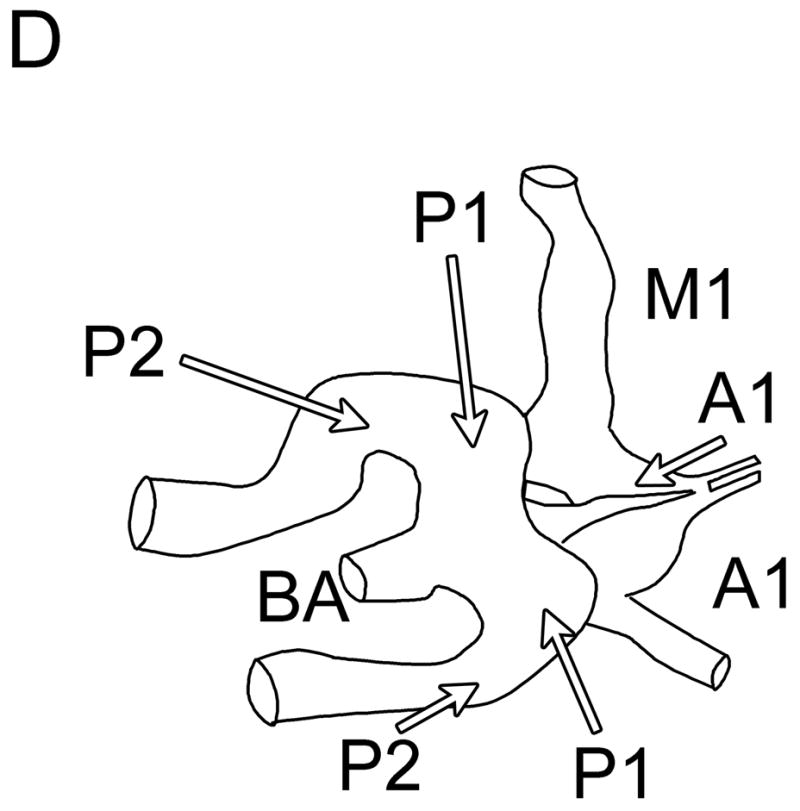
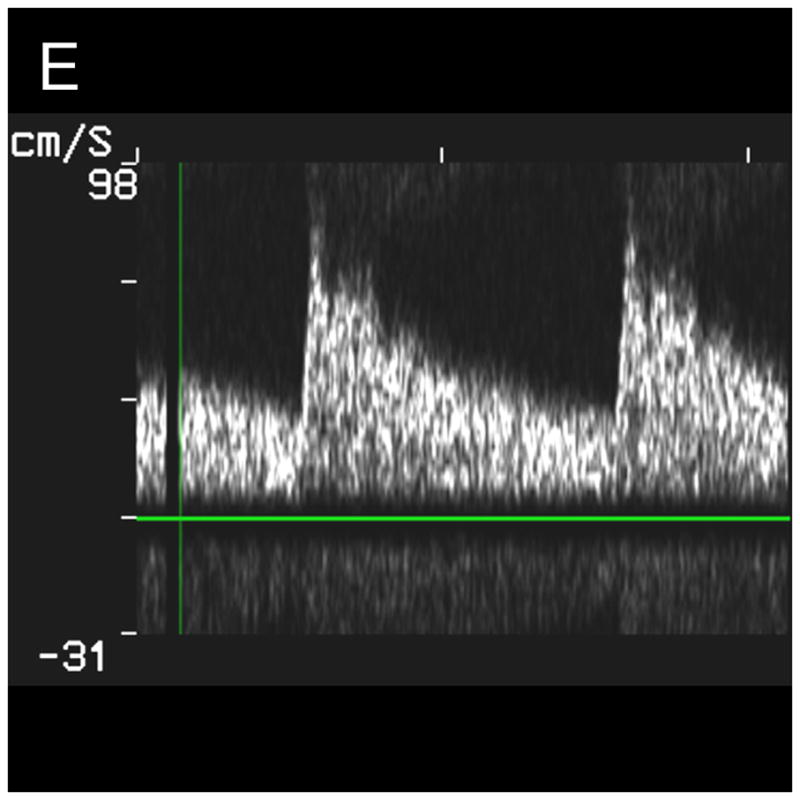
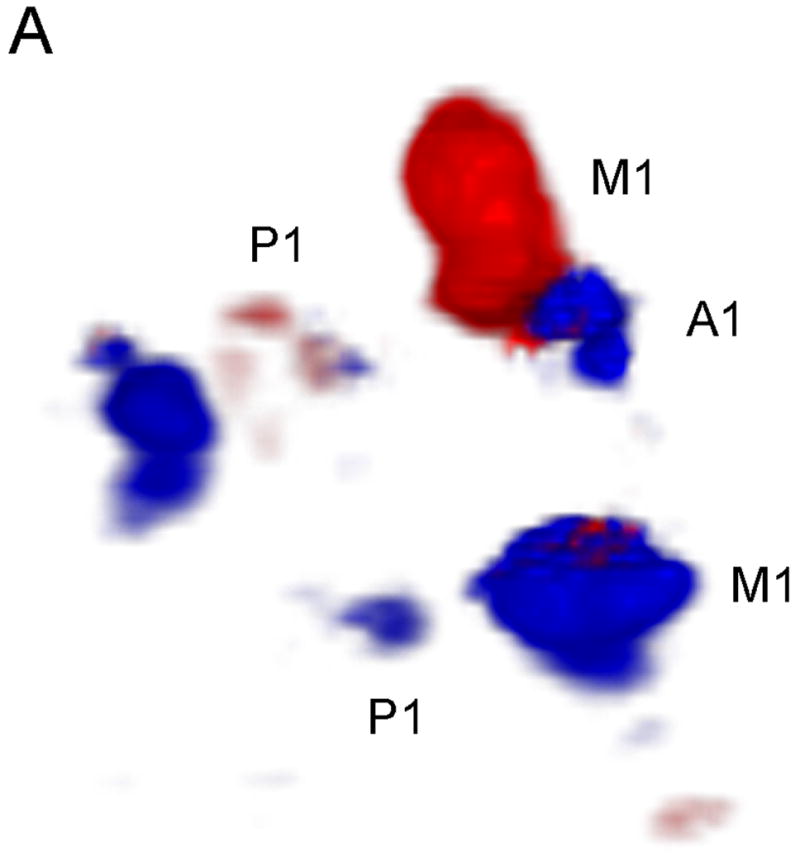
Typical Temporal Window Findings. (a) Axial scan showing the circle of Willis comprised of the ispilateral A1, M1, P1 and P2, as well as the contralateral A1, and P1. (b) Coronal scan showing the BA bifurcating to the P1 segments of the PCAs. (c) 3D color Doppler rendering of the cerebrovascular tree. (d) Schematic of (c). (e) Spectral Doppler trace from an M1 showing velocity over the full cardiac cycle.
Observer Study
A vascular sonographer and a neurologist independently reviewed temporal and sub-occipital volumes from each patient using both the scanner’s orthogonal 3D display and the offline 3D Doppler volume renderings. The scanner was set to a persistence (exponentially-weighted temporal averaging) of 80% and the acquired data was looped. The reviewers noted the presence or absence of cerebral vessels. For the temporal window, the vessels detected were the ipsilateral and contralateral internal carotid arteries (ICA), middle cerebral arteries (MCA: M1, and M2 segments), anterior cerebral arteries (ACA: A1 and A2 segments), posterior cerebral arteries (PCA: P1 and P2 segments). For the sub-occipital window, vessels detected were the left and right vertebral arteries (VA), the basilar artery (BA), and the vertebrobasilar junction (VBJ).
For the single phase aberration correction experiment, the observers above were shown both pre- and post- phase aberration correction 3D Doppler volume renderings (single-blind) and were asked to note the presence or absence of the cerebral vessels listed above for the temporal window.
Phase Aberration Correction
Thickness variations of skull across the face of the transducer defocus the ultrasound beam, degrading resolution and contrast. To correct this phase aberration, we used the multi-lag least-means-squares cross-correlation method (Flax and O’Donnell 1988; Liu and Waag 1994; Gauss et al. 2001), which we have previously adapted to 3D ultrasound (Ivancevich et al. 2006b).
To acquire the raw radio-frequency (RF) speckle data for aberration correction, we focused the 440 transmit elements at 4 cm down the center of the 3D scan (0° azimuth, 0° elevation) while receiving on an cluster of 2×2 elements. The 2×2 cluster was stepped across the entire receive aperture with every new transmit pulse. This resulted in 221 RF data lines samples at 0.7 mm on the transducer aperture. The RF data was amplified using an RF amplifier (Panametrics Model 5073PR, Waltham, MA) and sent to a digital acquisition board (Signatec PDA14, Corona, CA) in a PC. The digitizer acquired a 7.9 mm long echo centered at the focus of 4 cm and sampled at 25MHz. We averaged 15 series of these echoes, to increase the signal-to-noise ratio of the data. The data was then read in by a custom C-language program. The program focused the echoes and then found the peak of the normalized cross-correlation between the RF signals from clusters at a lag up to two clusters in both azimuth and elevation. These time-delays yield an over-determined system of equations which was then solved in a least-means-squares approach to provide the best fit aberration profile enforcing phase closure:
| (2) |
where T is a vector containing the aberration profile, M is the 817 × 221 model matrix, and D is a vector comprised of time-delays. This aberration profile, a series of 221 time-shifts, one for each cluster, was then interpolated to yield the shift at each receive and transmit element. The time-shifts were converted into system clock cycles (25 ns increments) and sent to the scanner via a TCP/IP connection. The scanner, upon receiving these shifts, ran a subroutine to update the ten million (256 elements × 256 lines × 16:1 parallel receive lines × 10 focal zones) beamformer delays. The whole process required less than 20 seconds.
For a single subject, we affixed the transducer to the subject’s head and performed a correction. We then acquired real-time volumes with the original and the corrected beamformer delays for later comparison. All system settings were constant, and less than fifteen seconds passed between the two acquisitions. To verify improvement in the corrected volumes, we used three metrics: the detection rates of vessels from an observer study, the number of voxels with Doppler signal, and the variance of the color Doppler velocity estimates. Since aberration correction increases the signal strength from ultrasound (due to echoes being added in phase), the number of voxels with color Doppler signal may be used as a metric of improvement. In addition, since aberration spreads the ultrasound beam, echoes are received from a larger isochronous volume of contrast scatterers, leading to a higher variance in velocity estimation. Aberration correction should decrease the variance, as signals should come from a smaller volume of contrast scatterers. We compared the mean variances of Doppler estimations for the voxels that presented Doppler signal in both aberrated and corrected volumes and report the variance decrease as metrics of improvement.
RESULTS
Temporal Window
In no patient were we able to visualize blood flow in color flow Doppler mode without the use of contrast. In all subjects, once contrast was administered, we were able to detect flow. The results of the study for the 17 subjects imaged via the temporal window are shown in Table 1. Both observers detected the major ipsilateral blood vessels (A1, M1, and P1) in 71% of subjects, and the complete circle of Willis (ipsilateral and contralateral A1, M1, and P1) was detected by both in 51% of subjects. Representative simultaneous axial and coronal images are shown in Figure 3A and B, respectively. The axial scan shows the major vessels and the circle of Willis. The coronal scan shows the distal end of the BA bifurcating into the PCAs. The same data, displayed as a 3D Doppler volume rendering, is shown in Figure 3C. A corresponding schematic is shown in Figure 3D, to help delineate the 3D vasculature. The volume rendered view shows significantly more information than the adjustable cross-sections, enabling the observer to see the interrelation of all the vessels throughout the 3D volume. Various arteries were also inspected using spectral Doppler, which could be steered throughout the entire 65° volume. A representative trace from an M1 showing normal flow over the cardiac cycle is presented in Figure 3E.
TABLE 1.
CE Transcranial Ultrasound Detection Rates
| Vessel | Detection Rate | ||
|---|---|---|---|
| Temporal Window (N=17)
| |||
| Observer 1 | Observer 2 | Both Observers | |
| Ipsilateral
|
|||
| M1 | 100 | 100 | 100 |
| M2 | 65 | 41 | 41 |
| A1 | 88 | 94 | 88 |
| A2 | 59 | 53 | 35 |
| P1 | 82 | 100 | 82 |
| P2 | 82 | 82 | 77 |
| ICA | 29 | 88 | 29 |
| Contralateral
|
|||
| M1 | 88 | 100 | 88 |
| M2 | 0 | 18 | 0 |
| A1 | 88 | 82 | 71 |
| A2 | 24 | 18 | 0 |
| P1 | 77 | 88 | 71 |
| P2 | 24 | 29 | 12 |
| ICA | 0 | 47 | 0 |
| Ipsilateral Circle (M1, A1, P1) | 59 | 71 | 59 |
| Complete Circle | 71 | 94 | 71 |
| Subocciptal Window (N=9)
| |||
| Observer 1 | Observer 2 | Both Observers | |
| LVA | 67 | 89 | 67 |
| RVA | 55 | 67 | 44 |
| VB Junct. | 33 | 67 | 33 |
| BA | 44 | 89 | 44 |
| Both VAs Junct. and BA | 22 | 22 | 22 |
Sub-occipital Window
The results of the study for the 9 patients imaged via the sub-occipital window are shown in Table 1. The BA was detected by both observers in 44% of subjects, and both VAs, the VBJ and the BA were detected in 22% of subjects. A representative coronal scan showing both VAs merging into the BA is shown in Figure 4A. A parasaggital view showing the posterior inferior cerebellar artery (PICA) bifurcating off the left VA is shown in Figure 4B. In the 3D Doppler volume rendering of the same volume, shown in Figure 4C, the whole structure can be better visualized, showing the numerous branchings off the VAs. A corresponding schematic is shown in Figure 4D. This volume also illustrates the hazard of “blooming” artifacts in CE US, notably at the distal end of the BA in this scan. Under the administration of contrast-agents, the color Doppler signal has a tendency to “bloom” outside the true borders of a vessel (Forsberg et al. 1994). A representative spectral Doppler trace from a BA showing normal flow over the cardiac cycle is presented in Figure 4E.
Fig. 4.
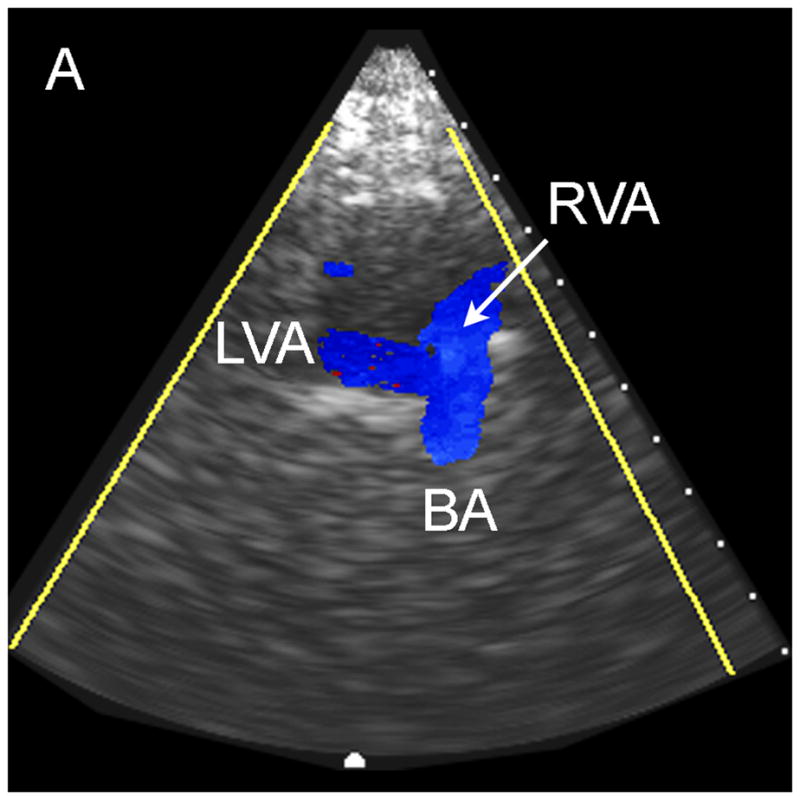
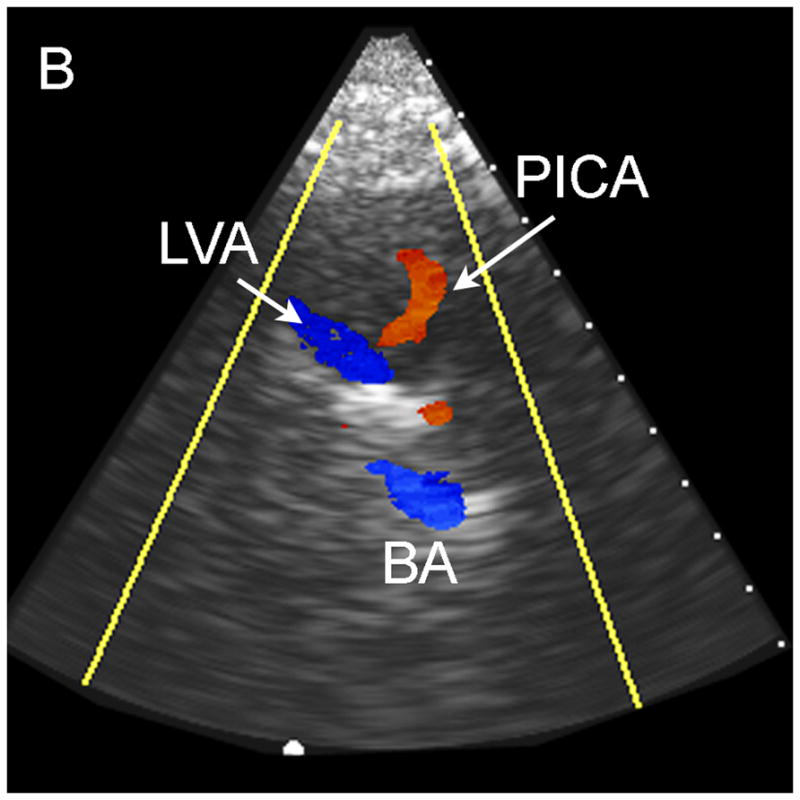
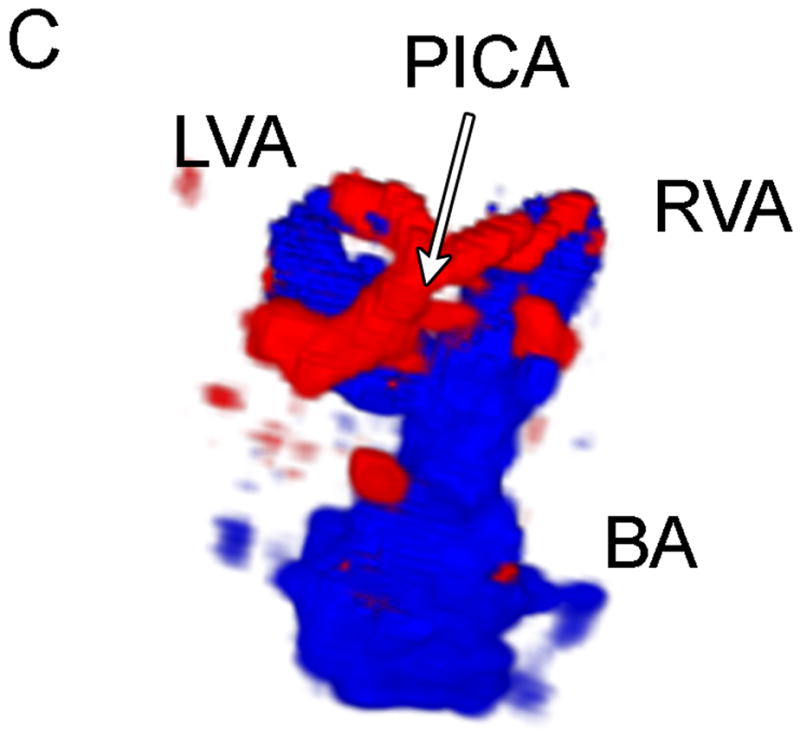

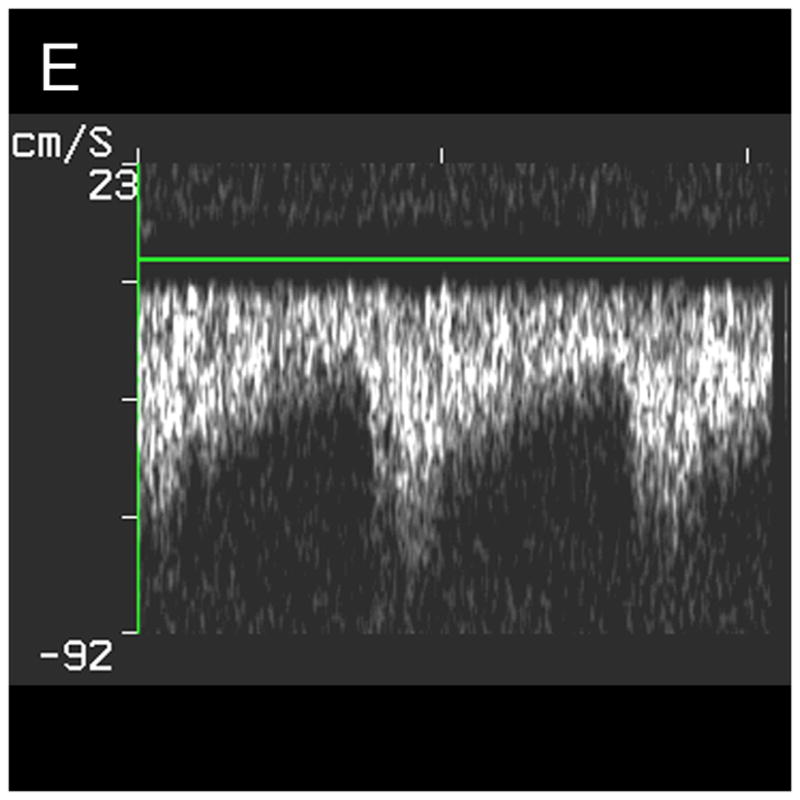
Typical Sub-Occipital Window Findings. (a) Sub-occipital coronal scan showing the junction of the left and right vertebral arteries (LVA and RVA, respectively) into the basilar artery (BA). (b) Sub-occipital parasaggital scan showing the PICA bifurcating from the LVA. (c) 3D Doppler rendering of vertebrobasilar circulation. (d) Schematic of (c). (e) Spectral Doppler trace from a BA showing velocity over the full cardiac cycle.
Phase Aberration Correction
In Figure 5, we compare the uncorrected and corrected (A and B, respectively) 3D Doppler volume renderings from the single phase aberration correction study performed. Our system measured an aberrator with a root-mean-square phase variation of 47.9 ns and correlation length of 2.72 mm. The observers’ results are shown in Table 2. Both observers agreed that the contralateral A1 was present in the corrected volume and not in the uncorrected. The number of voxels above a threshold of 6 (the Volumetrics scanner calculates the magnitude of the Doppler signal strength as a value between 0 and 255, and 6 was the reject value used during acquisition and display of the data) increased by 38.6% in the corrected volume. The average variance of the Doppler velocity estimates for voxels above the threshold in both volumes decreased by 10.5% in the corrected volume.
Fig 5.
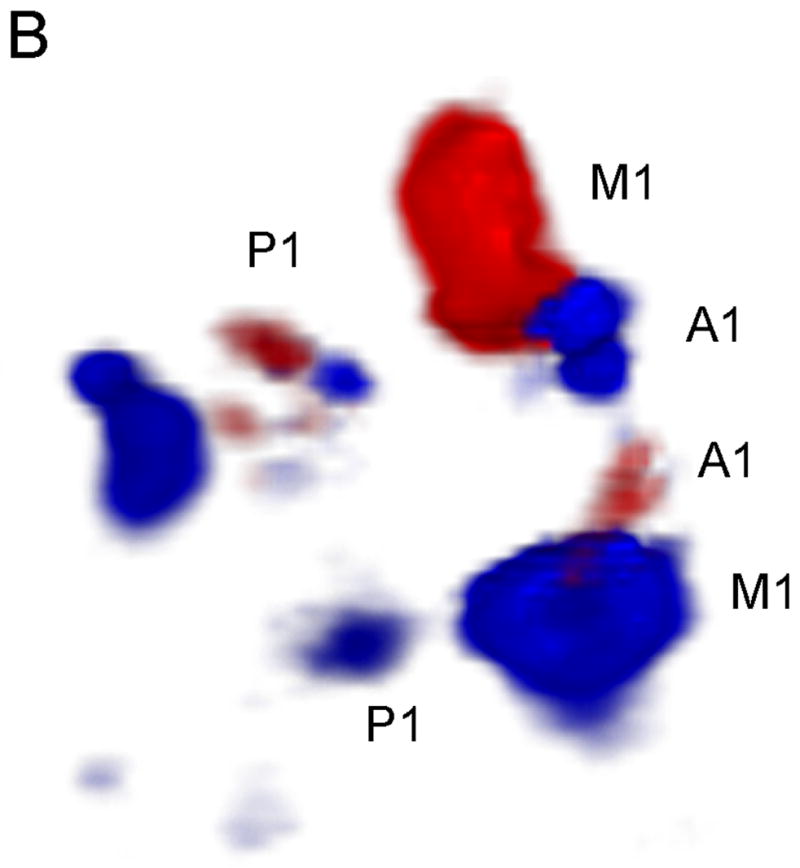
Phase Aberration Correction Results. Uncorrected (a) and Corrected (b) 3D Doppler volume renderings. Note the presence of the contralateral A1 and more Doppler signal in the corrected image.
TABLE 2.
Phase Aberration Correction Detected Vessels
| Aberrated | Corrected | |||
|---|---|---|---|---|
| Observer 1 | Observer 2 | Observer 1 | Observer 2 | |
| Ipsilateral
|
||||
| M1 | X | X | X | X |
| M2 | ||||
| A1 | X | X | X | X |
| A2 | ||||
| P1 | X | X | X | X |
| P2 | X | X | ||
| ICA | ||||
| Contralateral
|
||||
| M1 | X | X | X | X |
| M2 | ||||
| A1 | X | X | ||
| A2 | ||||
| P1 | X | X | X | X |
| P2 | ||||
| ICA | ||||
DISCUSSION
To our knowledge, we have shown the first real-time 3D contrast-enhanced transcranial ultrasound images of the major cerebral arteries. In addition, to our knowledge, we have shown the first demonstration of in vivo transcranial phase aberration correction, which we believe has the potential to radically increase the diagnostic value of neurosonology. In RT3D CE transcranial ultrasound precise and accurate positioning and aiming of the transducer is not necessary to image the vessels, as a whole 3D volume of data is acquired, which may be cut and re-displayed at any desired orientation. Our data appears to support Bauer’s et al. (1998) conclusion that 3D may enable better visualization of complex structures. There are, of course, hurdles to be overcome. 2D matrix array transducers have smaller piezoelectric elements, and thus lower sensitivity than traditional 1D arrays. To wit, our detection rates fall short of other reconstructed 3D contrast-enhanced techniques using power Doppler and 1D arrays (Bauer et al. 1998). However, only with this true real-time 3D technique (without phase aberration correction) can dynamic properties of the cerebrovascular system be assessed, and problems associated with breath-holds and cardiac gating be avoided. With phase aberration correction and a proper transducer holder, as often used in TCD, after the 20 seconds necessary to correct the scan, real-time 3D imaging is restored. In addition, the small matrix array elements are beneficial to the phase aberration correction process, as the skull bone aberrator must be adequately sampled in two dimensions to at least 75% and perhaps as fine as 25 to 30% of the aberration correlation length (Lacefield and Waag 2000; 2001).
In the future, we will further explore the capability of RT3D CE transcranial US, specifically in a sensitivity/specificity study using digital subtraction angiography or magnetic resonance angiography as a gold standard. We will also perform phase aberration correction on more subjects, to thoroughly determine the value added to transcranial US. We are also pursuing advances in phase aberration correction to increase the diagnostic value of this technique, especially in conjunction with moving-target techniques for echoes from flowing contrast agent (Bohs et al. 1992; Zhao et al. 1992; Ivancevich et al. 2006a) and with speckle-brightness techniques (Nock et al. 1989). One inherent disadvantage of CE US is the blooming artifact. Harmonic imaging, however, can mitigate this artifact and restore delineation of vessels in the 1–2 mm range (Hölscher et al. 2005), and we are currently investigating this technique for RT3D US.
Acknowledgments
This study was supported by grants RR024128 and HL072840 from the National Institutes of Health. We would like to acknowledge Bristol Myers Squibb.
Footnotes
Publisher's Disclaimer: This is a PDF file of an unedited manuscript that has been accepted for publication. As a service to our customers we are providing this early version of the manuscript. The manuscript will undergo copyediting, typesetting, and review of the resulting proof before it is published in its final citable form. Please note that during the production process errors may be discovered which could affect the content, and all legal disclaimers that apply to the journal pertain.
References
- Bauer A, Bogdahn U, Haase A, Schlief R. 3-Dimensional echo-enhanced transcranial Doppler ultrasound diagnosis. Radiologe. 1998;38:394–398. doi: 10.1007/s001170050370. [DOI] [PubMed] [Google Scholar]
- Baumgartner RW, Marcel A, Gönner F, Staikow I, Herrmann C, Rivoir A, Müri RM. Contrast-enhanced transcranial color-coded duplex sonography in ischemic cerebrovascular disease. Stroke. 1997;28:2473–2478. doi: 10.1161/01.str.28.12.2473. [DOI] [PubMed] [Google Scholar]
- Bogdahn U, Becker G, Schlachetzki F, editors. Echoenhancers and transcranial color duplex sonography. Boston: Blackwell Science; 1998. [Google Scholar]
- Bogdahn U, Becker G, Schlief R, Reddig J, Hassel W. Contrast-enhanced transcranial color-coded real-time sonography: Results of a phase-two study. 1993;24:676–684. doi: 10.1161/01.str.24.5.676. [DOI] [PubMed] [Google Scholar]
- Bohs L, Zhao D, Trahey GE. Phase aberration correction using echo signals from moving targets II: experimental system and results. Ultrason Imag. 1992;14:111–120. doi: 10.1177/016173469201400202. [DOI] [PubMed] [Google Scholar]
- Clement GT, Hynynen K. A non-invasive method for focusing ultrasound through the human skull. Phys Med Biol. 2002;47:1219–1236. doi: 10.1088/0031-9155/47/8/301. [DOI] [PubMed] [Google Scholar]
- Clement GT, White PJ, Hynynen K. Enhanced ultrasound transmission through the human skull using shear mode conversion. J Acoust Soc Am. 2003;115:1356–1364. doi: 10.1121/1.1645610. [DOI] [PubMed] [Google Scholar]
- Droste DW, Jurgens R, Weber S, Tietje R, Ringelstein EB. Benefit of echocontrast-enhanced transcranial color-coded duplex ultrasound in the assessment of intracranial collateral pathways. Stroke. 2000;31:920–923. doi: 10.1161/01.str.31.4.920. [DOI] [PubMed] [Google Scholar]
- Fink M. Time reversal of ultrasonic fields--Part I: Basic principles. IEEE Trans Ultrason, Ferroelect, Freq Contr. 1992;39:555–566. doi: 10.1109/58.156174. [DOI] [PubMed] [Google Scholar]
- Flax SW, O’Donnell M. Phase-aberration correction using signals from point reflectors and diffuse scatterers: Basic principles. IEEE Trans Ultrason, Ferroelect, Freq Contr. 1988;35:758–767. doi: 10.1109/58.9333. [DOI] [PubMed] [Google Scholar]
- Forsberg F, Liu JB, Burns PN, Merton DA, Goldberg BB. Artifacts in ultrasonic contrast agent studies. J Ultrasound Med. 1994;13:357–365. doi: 10.7863/jum.1994.13.5.357. [DOI] [PubMed] [Google Scholar]
- Fry FJ, Barger JE. Acoustic properties of the human skull. J Acoust Soc Amer. 1978;63:1576–1590. doi: 10.1121/1.381852. [DOI] [PubMed] [Google Scholar]
- Gahn G, von Kummer R. Ultrasound in acute stroke: a review. Neuroradiology. 2001;43:702–11. doi: 10.1007/s002340100613. [DOI] [PubMed] [Google Scholar]
- Gauss RC, Trahey G, Soo MS. Wavefront estimation in the human breast. Proc SPIE. 2001;4325:172–181. [Google Scholar]
- Goss SA, Johnston RL, Dunn F. Comprehensive compilation of empirical ultrasonic properties of mammalian tissues. J Acoust Soc Am. 1978;64:423–457. doi: 10.1121/1.382016. [DOI] [PubMed] [Google Scholar]
- Hölscher T, Wilkening W, Lyden PD, Mattrey RF. Transcranial ultrasound angiography (TUSA): a new approach for contrast specific imaging of intracranial arteries. 2005;31:1001–1006. doi: 10.1016/j.ultrasmedbio.2005.04.014. [DOI] [PubMed] [Google Scholar]
- Hynynen K, Sun J. Trans-skull ultrasound therapy: the feasibility of using image-derived skull thickness information to correct the phase distortion. IEEE Trans Ultrason, Ferroelec, Freq Contr. 1999;46:752–765. doi: 10.1109/58.764862. [DOI] [PubMed] [Google Scholar]
- Ivancevich NM, Dahl JJ, Trahey GE, Smith SW. Phase aberration correction on a 3D ultrasound scanner using RF speckle from moving targets. Proc IEEE Ultrason Symp. 2006a doi: 10.1109/tuffc.2006.1665100. [DOI] [PubMed] [Google Scholar]
- Ivancevich NM, Dahl JJ, Trahey GE, Smith SW. Phase Aberration Correction with a Real-Time 3D Ultrasound Scanner: Feasibility Study. IEEE Trans Ultrason Ferroelec Freq Contr. 2006b;53:1432–1439. doi: 10.1109/tuffc.2006.1665100. [DOI] [PubMed] [Google Scholar]
- Klötzsch C, Bozzato A, Lammers G, Mull M, Lennartz B, Noth J. Three-dimensional transcranial color-coded sonography of cerebral aneurysms. 1999;30:2285–2290. doi: 10.1161/01.str.30.11.2285. [DOI] [PubMed] [Google Scholar]
- Lacefield J, Waag R. Effect of transmit focus characteristics on estimates of aberration. 2000;2:1665–1668. [Google Scholar]
- Lacefield J, Waag R. Time-shift estimation and focusing through distributed aberration using multirow arrays. IEEE Trans Ultrason, Ferroelec Freq Contr. 2001;48:1606–1624. doi: 10.1109/58.971712. [DOI] [PubMed] [Google Scholar]
- Li Y, Robinson B. Phase Aberration Correction Using Near-Field Redundancy- Two-Dimensional Array Algorithm. Proc IEEE Ultrason Symp. 2000;2:1729–1733. [Google Scholar]
- Liu D, Waag R. A comparison of ultrasonic wave-front distortion and compensation in one-dimensional and two-dimensional apertures. IEEE Trans Ultrason, Ferroelec, Freq Contr. 1995;42:726–733. [Google Scholar]
- Liu D, Waag R. Time-shift compensation of ultrasonic pulse focus degradation using least-mean-square error-estimates of arrival time. J ACOUST SOC AM. 1994;95:542–555. doi: 10.1121/1.408348. [DOI] [PubMed] [Google Scholar]
- Nock L, Trahey GE, Smith SW. Phase aberration correction in medical ultrasound using speckle brightness as a quality factor. J Acoust Soc Amer. 1989;85:1819–1833. doi: 10.1121/1.397889. [DOI] [PubMed] [Google Scholar]
- Otis S, Rush M, Boyajian R. Contrast-enhanced transcranial imaging. 1995;26:203–209. doi: 10.1161/01.str.26.2.203. [DOI] [PubMed] [Google Scholar]
- Smith S, Pavy H, VonRamm O. High-speed ultrasound volumetric imaging-system. 1. Transducer design and beam steering. IEEE Trans Ultrason, Ferroelec, Freq Contr. 1991;38:100–108. doi: 10.1109/58.68466. [DOI] [PubMed] [Google Scholar]
- Smith SW, Chu K, Idriss SF, Ivancevich NM, Light ED, Wolf PD. Feasibility study: real-time 3-D ultrasound imaging of the brain. Ultrasound Med Biol. 2004;30:1365–71. doi: 10.1016/j.ultrasmedbio.2004.08.012. [DOI] [PubMed] [Google Scholar]
- Smith SW, Trahey GE, von Ramm OT. Phased array ultrasound imaging through planar tissue layers. Ultrasound Med Biol. 1986;12:229–43. doi: 10.1016/0301-5629(86)90314-5. [DOI] [PubMed] [Google Scholar]
- Smith SW, von Ramm OT, Kisslo JA, Thurstone FL. Real time ultrasound tomography of the adult brain. Stroke. 1978;9:117–22. doi: 10.1161/01.str.9.2.117. [DOI] [PubMed] [Google Scholar]
- VonRamm O, Smith S, Pavy H. High-speed ultrasound volumetric imaging-system. 2. Parallel processing and image display. IEEE Trans Ultrason, Ferroelec, Freq Contr. 1991;38:109–115. doi: 10.1109/58.68467. [DOI] [PubMed] [Google Scholar]
- Wessels T, Bozzato A, Mull M, Klötzsch C. Intracranial collateral pathways assessed by contrast-enhanced three-dimensional transcranial color-coded sonography. ULTRASOUND MED BIOL. 2004;30:1435–1440. doi: 10.1016/j.ultrasmedbio.2004.05.011. [DOI] [PubMed] [Google Scholar]
- White DN, Stevenson RJ. The acoustic characteristics of the skull. ULTRASOUND MED BIOL. 1978;4:225–252. doi: 10.1016/0301-5629(78)90054-6. [DOI] [PubMed] [Google Scholar]
- Wiesmann M, Seidel G. Ultrasound perfusion imaging of the human brain. 2007;31:2421–2425. doi: 10.1161/01.str.31.10.2421. [DOI] [PubMed] [Google Scholar]
- Zhao D, Bohs L, Trahey GE. Phase abberation correction using echo signals from moving targets I: description and theory. Ultrason Imag. 1992;14:97–110. doi: 10.1177/016173469201400201. [DOI] [PubMed] [Google Scholar]