

Abstract
The Methanococcus maripaludis MMP0352 protein belongs to an oxidoreductase family that has been proposed to catalyze the NAD+-dependent oxidation of the 3″-position of uridine diphosphate N-acetyl-d-glucosamine (UDP-GlcNAc), forming a 3-hexulose sugar nucleotide. The heterologously expressed MMP0352 protein was purified and shown to efficiently catalyze UDP-GlcNAc oxidation forming one NADH equivalent. This enzyme was used to develop a fixed endpoint fluorometric method to analyze UDP-GlcNAc. The enzyme is highly specific for this acetamido sugar nucleotide, and the procedure had a detection limit of 0.2 μM UDP-GlcNAc in a 1-ml sample. Using the method of standard addition, UDP-GlcNAc concentrations were measured in deproteinized extracts of Escherichia coli, Saccharomyces cerevisiae and HeLa carcinoma cells. Equivalent concentrations were determined by both enzymatic and chromatographic analyses, validating this method. This procedure can be adapted for the high-throughput analysis of changes in cellular UDP-GlcNAc concentrations during time series experiments or inhibitor screens.
Introduction
Cells from all three domains of life use N-acetyl-d-glucosamine (GlcNAc)1 in their cell walls, extracellular matrices, protein post-translational modifications or glycolipids [1]. The uridine diphosphate activated form of this sugar (UDP-GlcNAc) is the universal GlcNAc donor for the biosynthesis of all these structures, as well as the precursor for many modified acetamido sugars. In mammalian cells, external glucose or glucosamine levels affect the UDP-GlcNAc concentration, which can modulate the levels of protein O-GlcNAc modification [2]. Inhibitors of bacterial protein synthesis cause an increase in the concentrations of peptidoglycan precursors, including UDP-GlcNAc [3]. These physiological changes in UDP-GlcNAc pools have created a need for rapid assays to analyze the large number of samples produced during time course experiments [4].
All cells contain a complex mixture of ribonucleotides and deoxyribonucleotides along with a variety of sugar nucleotides that complicate analyses. Many of these molecules have similar charges and spectral properties. In an extreme case, cells can contain three different epimers: UDP-GlcNAc, UDP-N-acetyl-d-galactosamine (UDP-GalNAc) and UDP-N-acetyl-d-mannosamine. Some microorganisms also produce hexuronate sugar nucleotides or 4″-deoxysugar nucleotides with similar properties. Because glycosyltransferase enzymes discriminate among these analogs, it is important to develop highly specific analytical methods.
Previous analyses of UDP-GlcNAc used HPLC or capillary electrophoresis to determine intracellular concentrations of nucleotides and sugar nucleotides, quantitatively detecting their base absorbance at 254 nm. Ion-pair reversed-phase chromatography resolved 8 sugar nucleotides using a 42 min HPLC method, but could not separate UDP-GlcNAc from UDP-GalNAc [5]. An improved ion-pair reversed-phase chromatographic method offered some separation of these two epimers in a 35 min analysis [6]. High performance anion exchange chromatography using a CarboPac PA1 column separated 20 nucleotides and sugar nucleotides, although UDP-GlcNAc and UDP-GalNAc peaks overlapped in that 55 min method [7]. Ion chromatography afforded improved separation of UDP-GlcNAc and UDP-GalNAc in a 65 min method [8]. Lectin affinity chromatography showed significant improvements in discrimination between epimers, but has not been widely adopted [9]. Liquid chromatography-tandem mass spectrometry operated in multiple reaction monitoring mode was used to determine sugar nucleotides in three trypanosomatids during 45 min analyses [10]. Capillary electrophoresis showed excellent separation of UDP-GlcNAc and UDP-GalNAc in a method that required at least 18 min [11]. A similar capillary zone electrophoresis method was used to resolve the sugar nucleotides from Giardia intestinalis [12]. While each of these methods simultaneously determines many sugar nucleotide concentrations, they are limited by low-throughput, difficulty resolving sugar nucleotide epimers or high fixed costs.
While investigating the biosynthesis of an unusual 2,3-diacetamidoglucose sugar in the methanogen Methanococcus maripaludis, we identified a novel UDP-GlcNAc oxidoreductase enzyme encoded by the gene at locus MMP0352. The protein is homologous to the GnnA protein from Acidithiobacillus ferrooxidans that acts in concert with the GnnB aminotransferase to convert UDP-GlcNAc to 3-amino UDP-GlcNAc [13]. In that study, no UDP-GlcNAc oxidoreductase activity was detected in reactions containing only UDP-GlcNAc, NAD+ and recombinant GnnA protein. Both the MMP0352 and A. ferrooxidans GnnA proteins are homologous to the uncharacterized Pseudomonas aeruginosa WbpB and Bordetella pertussis WlbA proteins [14; 15]. All of these proteins are believed to catalyze similar reactions involving the oxidation of the 3″-position of a UDP-acetamido sugar to produce a 3-hexulose nucleotide (Figure 1). Alternatively, the Streptomyces fradiae pathway for mycaminose production involves the biosynthesis of an analogous TDP-6-deoxy-3-keto sugar using 6″-dehydratase and 3″,4″-isomerase enzymes [16].
Figure 1.
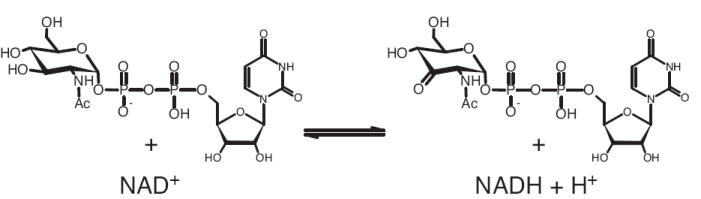
The MMP0352 enzyme is proposed to catalyze the NAD+-dependent oxidation of UDP-GlcNAc at the 3″-position to produce the keto-sugar nucleotide UDP-2-acetamido-3-oxo-2,3-dideoxy-α-d-glucopyranose.
We show here that heterologously expressed, purified MMP0352 protein catalyzes the NAD+-dependent oxidation of UDP-GlcNAc in an alkaline buffer with a methoxyamine trapping agent. This enzyme was used to develop a sensitive and specific fixed endpoint assay for UDP-GlcNAc based on the fluorescence of the NADH product. As little as 0.2 nmol UDP-GlcNAc could be detected in a 1-ml reaction after 1 h incubation. A standard addition method was used to determine concentrations of this sugar nucleotide in extracts from Escherichia coli, Saccharomyces cerevisiae and HeLa carcinoma cells. These values were equivalent to chromatographically determined UDP-GlcNAc concentrations, and were consistent with values from the literature. This method can provide a high-throughput alternative to chromatographic analysis of UDP-GlcNAc in a complex matrix of deproteinized cell extract.
Materials and Methods
Cloning and molecular biology
The gene at M. maripaludis locus MMP0352 was amplified by PCR using oligonucleotide primers 5MMP0352BN (5′-CGAGGATCCCATATGTTAAAAGTGGCAGTTG-3′) and 3MMP0352B (5′-GCAGGATCCTTAATTACCGTTAGAGCTTTTC-3′) (Invitrogen) and M. maripaludis S2 chromosomal DNA. The product was ligated in the NdeI and BamHI sites of vector pET-19b (Novagen) to produce vector pDG441. Plasmids were propagated in E. coli DH5α cells (Invitrogen), and protein was expressed using E. coli BL21(DE3) cells (Novagen). Recombinant DNA was sequenced at the Institute for Cellular and Molecular Biology Core Labs DNA Sequencing facility (UT-Austin), using T7 and T7-terminator primers. The MMP0352 protein sequence has the RefSeq accession number NP_987472.1.
Protein expression and purification
The amino-terminal polyhistidine-tagged MMP0352 protein (His10-MMP0352) was heterologously expressed in E. coli BL21 (DE3) (pDG441) cells and purified by Ni2+-affinity chromatography using standard methods [17]. The molecular mass and purity of the protein was estimated by SDS-PAGE using the Laemmli buffer system and 12% total acrylamide. The apparent mass and Stokes radius of the native protein were determined by analytical size exclusion chromatography [18]. For the determination of UDP-GlcNAc, the His10-MMP0352 protein was desalted using a HiTrap Sephadex G-25 column (5 ml, GE Healthcare) in 20 mM Tris-HCl (pH 8.0). The total protein concentration was determined using the Bradford protein assay with bovine serum albumin as a standard. The purified protein was stored at -80°C in a solution containing 15 mM Tris-HCl (pH 8) and 20% (v/v) glycerol.
UDP-GlcNAc dehydrogenase assay
Continuous assays were performed using a DU-800 spectrophotometer attached to a Peltier temperature-controlled stage (Beckman Coulter). Reactions (300 μl) containing 1 mM tris-(2-carboxyethyl)phosphine (TCEP), 200 mM KCl, 2 mM NAD+, 50 mM Tris-HCl (pH 8.5), and 0.3 μg His10-MMP0352 were pre-incubated at 37°C for 4 min in a quartz cell (Starna). The reactions were then initiated with 30 to 400 μM UDP-GlcNAc substrate. The reduction of NAD+ to NADH was monitored by following the increase in absorbance at 340 nm at 37°C. The linear portion of the reaction progress curve provided the initial rates, using a molar absorptivity of 6.2 mM-1 cm-1 for NADH. One unit of dehydrogenase activity catalyzed the conversion of 1 μmole substrate to product per min. Initial rate data were fitted to the Michaelis-Menten-Henri equation using nonlinear regression (KaleidaGraph program, Synergy Software) to estimate the apparent steady-state rate constants. To test the inhibitory properties of substrate analogs, standard reactions were initiated with mixtures containing 0.2 mM UDP-GlcNAc and various concentrations of analogs.
Development of a fluorescent assay for UDP-GlcNAc dehydrogenase activity
To optimize the assay, reactions (1 ml) contained various concentrations of UDP-GlcNAc (1 μM to 4 μM), 60 mM potassium chloride, 90 to 300 μM NAD+, 5 or 10 μg His10-MMP0352, and buffer at pH 9.5. The buffer salts tested were 0.15 M glycine-HCl, 30 mM ammonium bicarbonate, 30 mM 2-(cyclohexylamino)ethanesulfonate [CHES]-KOH or 30 mM sodium borate. Some reactions contained 30 mM methoxyamine hydrochloride to trap carbonyl products. These mixtures were incubated at 37°C for 1 h. NADH fluorescence was measured in an acrylate cuvette using a FP-6300 spectrofluorometer (Jasco) with an excitation wavelength of 340 nm and emission measured at 460 nm, each with band widths of 10 nm.
Determination of UDP-GlcNAc in cell extracts
The continuous standard variation method of standard addition was used to determine the concentration of UDP-GlcNAc in deproteinized cell extracts. A typical reaction mixture (1 ml) contained 150 μM NAD+, 60 mM KCl, 30 mM methoxyamine, 15 μl of neutralized cell extract, 5 μg His10-MMP0352 and 30 mM CHES-KOH (pH 9.5). Similar reactions supplemented with 1 to 3 μM UDP-GlcNAc were prepared and incubated simultaneously. Two control reactions were prepared to measure background fluorescence. The first control solution omitted cell extract and UDP-GlcNAc, measuring the rate of enzyme-catalyzed NAD+ adduct formation. The second control reaction contained 15 μl of extract in 30 mM methoxyamine and 30 mM CHES-KOH (pH 9.5), accounting for background fluorescence in the extract. All solutions were incubated in microcentrifuge tubes at 37°C for 1 h. NADH fluorescence was measured as described above. The fluorescence due to the two control reactions was subtracted from each reaction to obtain the corrected fluorescence. A least-squares analysis of the response curve was used to estimate slope and intercept parameters and their standard errors. These values were used to calculate UDP-GlcNAc concentrations in the cell extracts, and standard errors were propagated to estimate the associated error [19]. All of the assays were performed in triplicate.
HPLC analysis of sugar nucleotide
The UDP-GlcNAc estimates from fluorometric analysis were confirmed by chromatographic analysis. Deproteinized extracts were applied to a CarboPac PA1 column (250 by 4 mm, Dionex) with a guard column (4 by 50 mm) of the same material. The analytes were separated using an ammonium acetate gradient (0.6 ml min-1) and detected by a photodiode array [20]. The standard addition method was used to estimate UDP-GlcNAc concentrations from integrated peak areas. Standard compounds eluted with the following retention times: UDP-GalNAc (15.0 min), UDP-GlcNAc (15.5 min), UDP-Man (17.7 min), UDP-Glc (19.4 min) and UDP (43 min).
Cell culture and preparation of extracts
A wild-type E. coli B culture was obtained from the Coli Genetic Stock Center (CGSC 5365). Luria-Bertani medium (50 ml) was inoculated with 1% (v/v) of an overnight culture of E. coli B, followed by continuous shaking at 37°C. After the optical density at 600 nm reached 0.9, the cells were divided into equal parts of 3 mg (dry mass) each and harvested by centrifugation at 14,000 × g for 10 min. The pellets were frozen at -20°C until extraction. Each pellet was resuspended in 100 μl of 5% trichloroacetic acid (TCA) at room temperature for 20 min. Cell debris was removed by centrifugation at 10,000 × g for 5 min. After 15 min at room temperature, the supernatant was neutralized by the addition of 15 μl of 2.5 M potassium hydroxide in 1.5 M K2HPO4 and stored at -20°C. The cells’ dry weight was determined after drying at 100°C for 2 days. Measurements were performed on three separate samples.
A Saccharomyces cerevisiae DAY4 (MATa ser1 leu2 his4 trp1 ura3-52) culture was a gift from Drs. Gisela Kramer and Dean Appling (UT-Austin) [21]. Rich medium containing 1% yeast extract, 2% peptone and 2% dextrose was inoculated with an overnight culture (1% v/v) of DAY4 cells and grown for 23 h with continuous shaking at 30°C to an optical density at 600 nm of 1.9. The cells were harvested and divided into aliquots of 28 mg dry mass. Glass beads (0.5 mm, 1.5 gm) and 600 μl of 10% TCA were added to each cell pellet followed by bead-beating, using a Mini-BeadBeater homogenizer (BioSpec), for 4 min with intermittent cooling on ice. Complete lysis of the yeast cells was confirmed by microscopy. The lysed cells were centrifuged at 1,000 × g for 2 min to separate the glass beads from the lysate. This lysate was further centrifuged at 14,000 × g for 10 min at 4°C. The supernatant (170 μl) was neutralized by adding 40 μl of 2.5 M potassium hydroxide in 1.5 M K2HPO4. After centrifugation at 14,000 × g for 10 min, the supernatant was stored at -20°C.
Frozen pellets of HeLa carcinoma cells were a gift from Susan Anderson and Dr. Lara Mahal (UT-Austin). Cells were cultured in minimal essential medium/Earle’s balanced salt solution supplemented with 10% fetal bovine serum, 1% sodium pyruvate, and 1% essential amino acids at 37°C in presence of 5% CO2. After confluent growth was obtained, the cells were washed with phosphate-buffered saline, trypsinized, collected by centrifugation and stored at -80°C. The cells were suspended in 60 μl 5% TCA and lysed using a sonifier water bath (Branson Ultrasonics) for 15 min. Following centrifugation at 14,000 × g for 10 min, the supernatant was neutralized and stored at -20°C.
Results and Discussion
Expression and purification of MMP0352
N-terminal decahistidine-tagged MMP0352 (His10-MMP0352) was expressed in soluble form from E. coli BL21(DE3) (pDG441) cells, and it was purified by Ni2+-affinity chromatography. SDS-PAGE analysis showed that the protein was substantially pure, comprising 98% of the total protein (Figure 2A). The apparent molecular mass of His10-MMP0352 protein was 39 kDa, close to its expected mass of 37.1 kDa. Analytical size exclusion chromatography of this protein identified a single peak corresponding to a protein with an apparent mass of 305 kDa and a Stokes radius of 55 Å, which suggests the protein forms an octamer. A total of 13.5 mg of pure His10-MMP0352 protein was obtained from 4.2 g (wet mass) of cells. The protein was stored stably for at least several weeks in 20% glycerol at -80°C.
Figure 2.
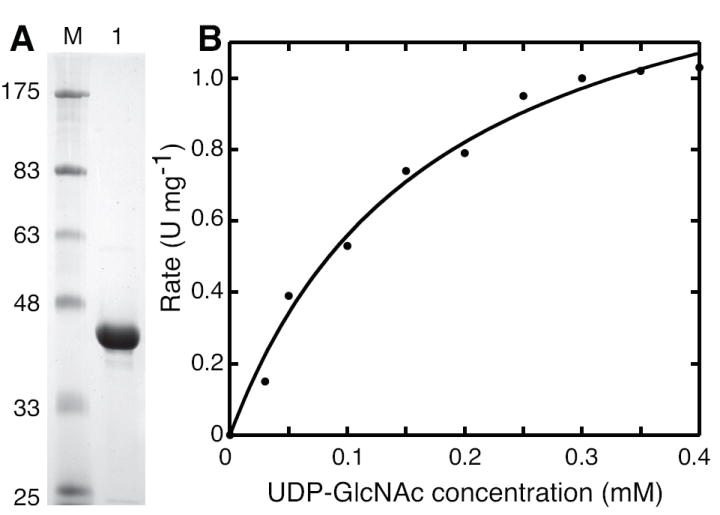
Purification and kinetic characterization of the MMP0352 UDP-GlcNAc oxidoreductase. Part A shows 10 μg of His10–MMP0352 protein separated by SDS-PAGE (lane 1) adjacent to protein standards with the indicated molecular masses in kDa (lane M). Proteins were stained with Coomassie blue dye. Part B shows the UDP-GlcNAc oxidoreductase activity catalyzed by 0.3 μg MMP0352 enzyme in continuous assays at various substrate concentrations. The initial rates were fit to the hyperbolic Michaelis-Menten-Henri equation with an apparent KM of 0.18 ± 0.03 mM and a kcat of 0.9 s-1. Reaction conditions are described in the Materials and Methods section.
Oxidoreductase activity of MMP0352
NAD+-dependent oxidoreductase activity was measured using a continuous, spectrophotometric assay that monitors the increase in absorbance at 340 nm due to the production of NADH. The enzyme specifically catalyzed the oxidation of UDP-GlcNAc using NAD+, consistent with the reaction scheme proposed in Figure 1. No activity was detected when NAD+ was replaced with NADP+. The MMP0352 protein did not catalyze the oxidation of the substrate analogs UDP-Glc, UDP-GalNAc, N-acetylglucosamine or glucosamine: reaction rates for mixtures containing these compounds were below the limit of detection for enzymatic activity (< 2 × 10⁻⁵ U mg-1). Dehydrogenase activity was unaffected by metal ions and did not require dithiothreitol (DTT) or other reductants for activity. Activity was 85% lower in the absence of KCl as compared to reactions containing 200 mM KCl.
Steady-state kinetic parameters were obtained by fitting the initial rates of oxidation at various UDP-GlcNAc and NAD+ concentrations to the Michaelis-Menten-Henri equation (Figure 2B). This analysis showed the MMP0352 enzyme efficiently catalyzed UDP-GlcNAc oxidation with apparent Km and turnover values comparable to parameters reported for the UDP-GlcNAc 6″-dehydrogenases from Pseudomonas aeruginosa [22] and Salmonella typhi [20] (Table 1).
Table 1.
Apparent kinetic parameters for the UDP-GlcNAc oxidoreductasesa
| Enzyme | Substrate | Km (μM)b | Vmax (U mg-1) | kcat (s-1) | kcat/Km (M-1s-1) |
|---|---|---|---|---|---|
| MMP0352 | UDP-GlcNAc | 180 ± 30 | 1.5 ± 0.11 | 0.9 | 5.0 × 10³ |
| MMP0352 | NAD+ | 180 ± 20 | 1.6 ± 0.09 | 0.99 | 5.5 × 10⁴ |
| S. typhi TviBc | UDP-GlcNAc | 77 ± 9 | 0.33 | 0.26 | 3.3 × 10³ |
| S. typhi TviBc | NAD+ | 276 ± 52 | 0.33 | 0.26 | 9.3 × 10² |
| P. aeruginosa WbpAd | UDP-GlcNAc | 94 ± 3 | N.D.e | 1.4 | 1.5 × 10⁴ |
| P. aeruginosa WbpAd | NAD+ | 220 ± 4 | N.D. | 1.4 | 6.4 × 10³ |
Continuous assays for UDP-GlcNAc oxidoreductase activity at various substrate concentrations were performed as described in Materials and Methods.
Apparent Km values were estimated using an excess of NAD+ (2 mM for MMP0352 and 1.6 mM for TviB) or UDP-GlcNAc (1 mM).
The parameters for S. typhi TviB UDP-GlcNAc 6″-dehydrogenase were reported by Zhang et al. [20].
The K0.5 values and turnover number for P. aeruginosa WbpA UDP-GlcNAc 6″-dehydrogenase were reported by Miller et al. [22].
N.D., not determined.
The products of the MMP0352-catalyzed reaction were analyzed by HPLC using a CarboPac PA1 column. However, no new peak corresponding to the expected 3-oxo-UDP-GlcNAc product was detected. Instead, a peak corresponding to UDP was identified, suggesting that a spontaneous elimination reaction degraded the sugar nucleotide product. The analogous TDP-6-deoxy-3-oxoglucose is also hydrolytically unstable [23]. This degradation pathway could be analogous to the proposed reaction mechanism for the family 4 NAD+ and Mn2+-dependent glucosidases [24]. Liquid chromatography-mass spectrometry analysis of the filtered reaction mixture in negative ion mode identified peaks corresponding to NADH ([M - H]- at 664 m/z) and UDP ([M - H]- at 403 m/z) products. Collision induced dissociation of the ion with 403 m/z produced a characteristic peak at 306 m/z corresponding to UMP. In positive ion mode, only NAD+ ([MH]+ at 664 m/z) and NADH ([MH]+ at 666 m/z) ions were identified. Further analysis will be required to identify the decomposed form of the enzymatic reaction product.
Potential inhibitors of MMP0352 oxidoreductase activity were screened in reactions containing 0.2 mM UDP-GlcNAc and various concentrations of substrate analogs. The following concentrations of analogs reduced UDP-GlcNAc oxidoreductase activity by 50%: 2 mM UDP, 2 mM UDP-Glc and 3 mM UDP-GalNAc. The sugars N-acetyl-d-glucosamine, d-glucose and d-glucosamine did not inhibit the reaction at 3 mM concentrations.
Fluorometric endpoint assay for UDP-GlcNAc determination
To develop a highly sensitive assay for UDP-GlcNAc, we used fluorescence spectroscopy to detect NADH in reactions with low, biologically relevant concentrations of UDP-GlcNAc [25]. Endpoint assays containing UDP-GlcNAc, His10-MMP0352 protein and excess NAD+ produced a linear response in a 1-ml reaction (Figure 3). A standard curve from mock reactions containing 1 to 4 μM NADH showed a stoichiometry of one NADH molecule produced per UDP-GlcNAc molecule oxidized. Nevertheless, the slope of this standard curve was significantly higher than the slope for the endpoint assay curve (p<0.05). Therefore a standard curve of UDP-GlcNAc is required to calibrate this enzymatic assay. The limit of detection (S/N = 3) was 0.2 μM UDP-GlcNAc and the limit of quantification (S/N = 10) was 0.7 μM UDP-GlcNAc for this method.
Figure 3.
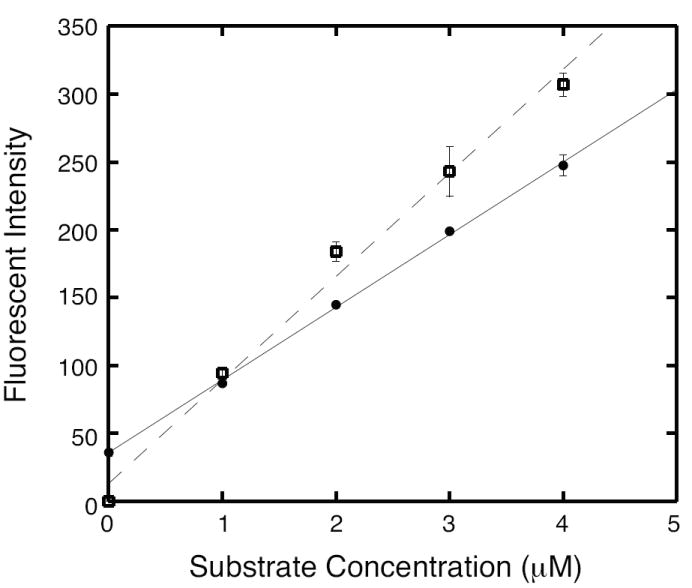
A response curve for the fluorescent UDP-GlcNAc assay shows a linear relationship between UDP-GlcNAc substrate concentration and measured fluorescence (filled circles with solid line). Reactions contained UDP-GlcNAc, 5 μg His10-MMP0352, 150 μM NAD+, 60 mM KCl, 30 mM methoxyamine, and 30 mM CHES-KOH (pH 9.5). The NADH fluorescence produced in reactions with MMP0352 protein and UDP-GlcNAc standards was fit by least-squares linear regression (r2 = 0.998, p < 0.001). For comparison, a standard curve was prepared using NADH standards (open squares with dashed line), which was fit to a different line (r2 = 0.98, p < 0.001).
In the absence of UDP-GlcNAc the MMP0352 enzyme catalyzed nucleophilic addition reactions to NAD+, an activity previously observed in alcohol dehydrogenase [26]. These adducts have UV absorbance and fluorescence properties similar to NADH. This activity is negligible in initial rate assays, but can be a significant interference during prolonged incubations using high enzyme and low substrate concentrations –the usual conditions for endpoint assays. In reactions with MMP0352 enzyme, the background fluorescence increased almost twofold over a 2 h incubation period when compared to 1 h of incubation at 37°C. The net fluorescence (due to UDP-GlcNAc oxidation alone) did not appreciably increase after 1 h. The background fluorescence was 43% higher for samples in 0.15 M glycine buffer (pH 9.5) as compared to 30 mM CHES (pH 9.5) and 30 mM ammonium bicarbonate (pH 9.5). No UDP-GlcNAc dependent NADH formation was observed in 30 mM sodium borate buffer. The fluorescent signal was 21% higher in the presence of 30 mM methoxyamine when tested with 30 mM CHES (pH 9.5). The background fluorescence was more than two-fold lower with 5 μg of MMP0352 when compared to 10 μg; 5 μg of enzyme was sufficient to oxidize UDP-GlcNAc in these assays. Based on these results, standard assays for UDP-GlcNAc included 30 mM CHES-KOH (pH 9.5) and 30 mM methoxyamine buffer salts.
Measurement of UDP-GlcNAc in E. coli
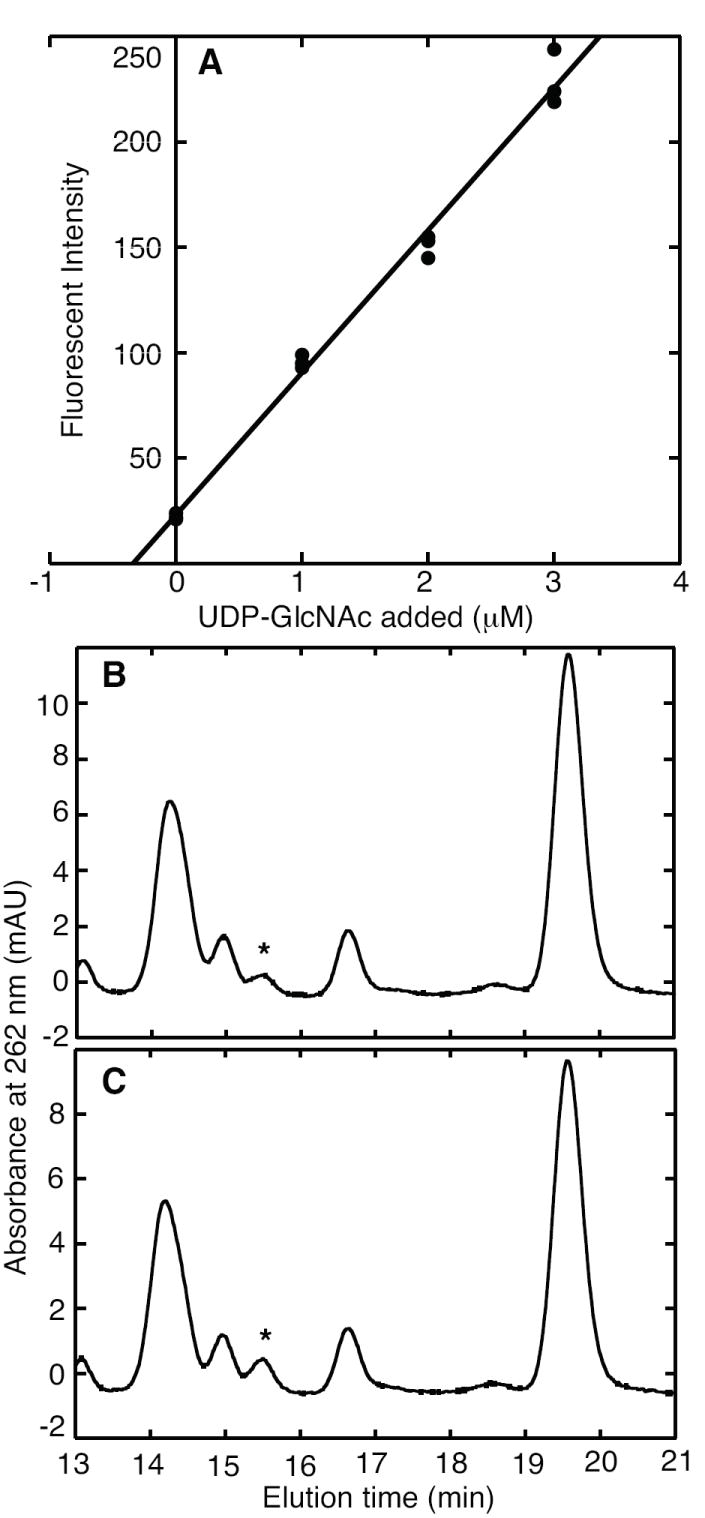
E. coli cells use large amounts of GlcNAc in their peptidoglycan and lipopolysaccharides, so the concentration of the UDP-GlcNAc precursor is expected to be high in actively growing cells. Extraction with TCA released UDP-GlcNAc from cells and destroyed intrinsic NADH and NADPH that would interfere with this endpoint assay. The residual background fluorescence, probably due to flavin and pterin compounds, was subtracted from values measured by enzymatic analysis with MMP0352. From a standard addition curve, we determined that E. coli B cells contain 1.5 ± 0.24 μmoles UDP-GlcNAc per g dry cells (Figure 4). HPLC analysis of the same extracts determined a similar UDP-GlcNAc composition of 1.2 μmoles per g. Therefore enzymatic analysis provided a precise and accurate measurement of UDP-GlcNAc, with a minimal amount of sample processing.
Figure 4.
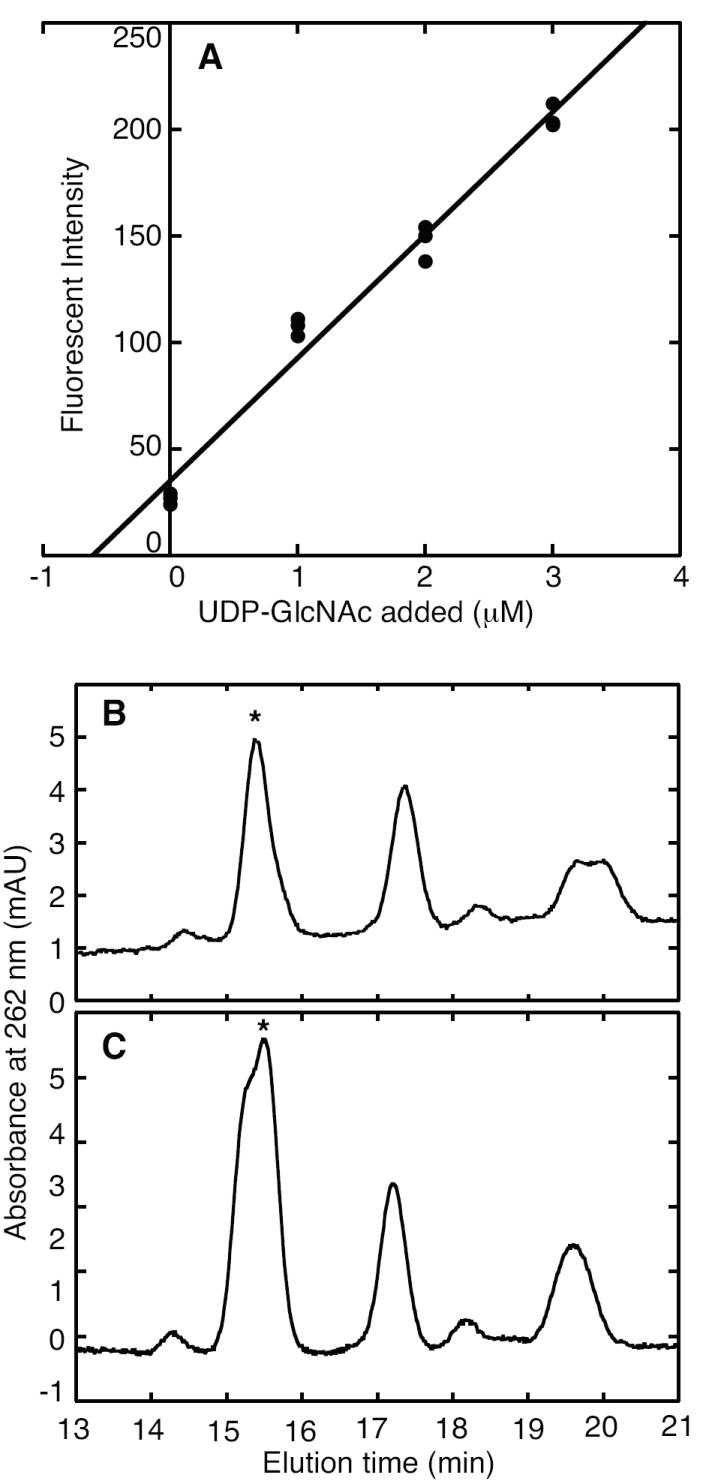
UDP-GlcNAc determination in E. coli B extract. Part A shows the standard addition plot, which was obtained by incubating three samples with MMP0352 protein, NAD+ and the indicated concentrations of UDP-GlcNAc standard. Least-squares linear regression produced a calibration curve, whose negative intercept at the x-axis estimates the UDP-GlcNAc concentration in the extract (1.5 ± 0.24 μmol g-1 dry mass). Part B shows a chromatogram of nucleotides and sugar nucleotides from E. coli extract separated on a CarboPac PA1 column, as described in the Materials and Methods section. Nucleotides were detected by their absorbance at 262 nm in milli-absorbance units (mAU). The peak corresponding to UDP-GlcNAc is identified by an asterisk. Part C shows a chromatogram of the same extract after the standard addition of UDP-GlcNAc, indicating a concentration of 1.2 μmol g-1 dry mass.
Previous reports of the UDP-GlcNAc composition in E. coli B and K-12 strains ranged from 0.93 to 1.4 μmoles per g dried cells, analyzed by HPLC with reversed-phase and amine columns [3]. The UDP-GlcNAc content of cells in that study varied, depending on growth conditions. Treatment with chloramphenicol significantly increased UDP-GlcNAc concentrations (5.7 to 6.0 μmoles per g), as did tetracycline treatment (2.6 to 4.0 μmoles per g). Assuming that the dry weight of an E. coli cell is 2.8 × 10⁻¹³ g and the cell volume is 1 fl, the intracellular UDP-GlcNAc concentration measured here is approximately 430 μM [27].
Measurement of UDP-GlcNAc in S. cerevisiae
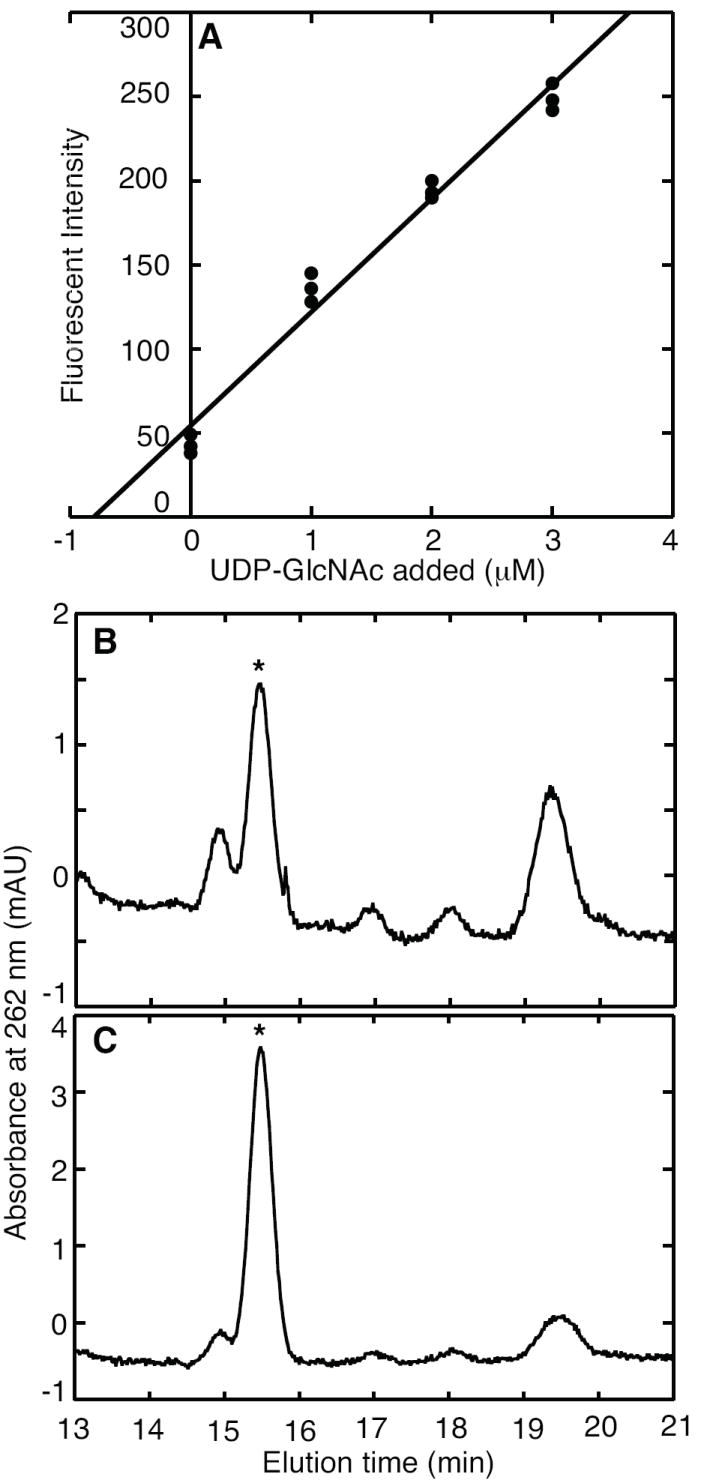
Yeast cells use GlcNAc in N-linked protein glycosylation, in glycosylphosphatidylinositol protein-anchors to the membrane, and in the chitin layer of their cell walls [28]. While S. cerevisiae cell walls have a relatively low chitin content (1-2%), the walls of other fungi contain a high proportion of chitin [29]. Metabolites were extracted from S. cerevisiae cells by bead-beating in the presence of TCA. The enzymatic assay measured 0.17 ± 0.03 μmoles UDP-GlcNAc per g of dry yeast cells (Figure 5). This value was confirmed by HPLC analysis, which estimated the UDP-GlcNAc concentration to be 0.14 μmoles per g. However, this sugar nucleotide pool also contained a compound that co-eluted with UDP-GalNAc, close to the UDP-GlcNAc peak. HPLC analysis of UDP-GlcNAc in eukaryotic extracts is limited by the resolving power of the method and the accuracy of peak integration.
Figure 5.
UDP-GlcNAc determination in S. cerevisiae DAY4 extract. Part A shows the standard addition plot for enzymatic reactions containing extract, MMP0352, NAD+ and the indicated concentrations of UDP-GlcNAc. These cells contained 0.17 ± 0.03 μmol UDP-GlcNAc g-1 dry mass. Part B shows a chromatogram of compounds in the S. cerevisiae extract, with the peak corresponding to UDP-GlcNAc indicated by an asterisk. Part C shows a chromatogram of the extract after the standard addition of UDP-GlcNAc, which indicates a concentration of 0.14 μmol g-1 dry mass.
A previous chromatographic analysis of UDP-GlcNAc in S. cerevisiae reported 0.4 μmoles UDP-GlcNAc per g wet cells (approximately 1.6 μmoles per g dry weight) [30]. In that report, UDP-GlcNAc concentrations increased almost 10-fold in cells grown on medium supplemented with glucosamine; however, it is not clear whether the analytical method used for those measurements (a normal phase amino HPLC column) completely separated UDP-GlcNAc from UDP-Glc and other sugar nucleotides. Assuming that the dry weight of a S. cerevisiae cell is 15 × 10-12 g and the cell volume is 70 fl, the intracellular UDP-GlcNAc concentration measured here is approximately 34 μM [31].
Measurement of UDP-GlcNAc in HeLa cells
In mammalian cells, GlcNAc is a key component of N- and O- linked protein glycosylation as well as the proteoglycans that form the extracellular matrix. Enzymatic analysis determined the UDP-GlcNAc concentration of HeLa carcinoma cells to be 12 × 108 molecules per cell or 0.50 ± 0.07 μmoles per g of dry cells (assuming 19% dry weight [32]) (Figure 6). HPLC analysis confirmed that value, determining 0.44 μmoles UDP-GlcNAc per g of dry HeLa cells.
Figure 6.
UDP-GlcNAc determination in HeLa cell extract. Part A shows the standard addition plot for enzymatic reactions supplemented with the indicated concentrations of UDP-GlcNAc. These cells contained 0.50 ± 0.07 μmol g-1 dry mass. Part B shows a chromatogram of nucleotides from the extract, where the UDP-GlcNAc peak is indicated by an asterisk. Part C shows a chromatogram after the standard addition of UDP-GlcNAc, indicating a concentration of 0.44 μmol g-1 dry mass.
For comparison, a previous chromatographic analysis of UDP-GlcNAc concentrations in HT29 human colon cancer cells measured approximately 8 × 10⁷ UDP-GlcNAc molecules per cell [33]. An ion-pair chromatographic analysis of mammalian CHO cells measured 5 × 10⁷ UDP-GlcNAc molecules per cell [6]. An optimized extraction procedure for Madin–Darby canine kidney cells measured 3 × 10⁸ UDP-GlcNAc molecules per cell [34]. Adipocytes grown without glucose contained approximately 0.04 μmoles per g of dry cells, but this value almost doubled when the cells were grown with glucose [35]. The broad range of UDP-GlcNAc concentrations found in mammalian cells illustrates the need for analytical methods to monitor sugar nucleotide pools.
Potential applications and enhancements
Recent advances in liquid chromatography and capillary electrophoresis have fostered increasingly sensitive analytical methods that identify and quantify a large number of analytes simultaneously. Each of these methods has significant fixed and variable costs. Analysis times range from 20 min to more than an hour per sample, excluding sample preparation that is required to remove interferences, concentrate analytes and protect columns or capillaries. Therefore there has been little improvement in the throughput of these methods. In contrast, the enzymatic method described here only measures UDP-GlcNAc, but requires minimal processing time and could be readily adapted to high-throughput methods using quartz microwell plates. By coupling NADH formation to tetrazolium dye reduction, it may be possible to perform this assay using a standard spectrophotometer without sacrificing sensitivity [36].
In principle, the UDP-GlcNAc 6-dehydrogenase enzyme could be used to develop a UDP-GlcNAc assay with enhanced sensitivity, because each UDP-GlcNAc molecule reduces two NAD+ molecules to NADH. The S. typhi TviB enzyme specifically catalyzed this reaction with kinetic parameters similar to those of the MMP0352 described here [20]. However, the TviB enzyme requires 10 mM DTT to prevent enzyme inactivation, probably due to oxidation of a catalytic cysteine thiol. Therefore the TviB enzyme cannot be purified by a single affinity chromatographic procedure [20], and it may be susceptible to oxidation by components of the sample matrix.
Acknowledgments
This work was supported in part by Public Health Service grant AI064444 from the National Institute of Allergy and Infectious Diseases and by the Petroleum Research Foundation (44382-G4).
We thank Dr. Mehdi Moini and Dr. Lara Mahal for helpful discussions, and Susan Anderson for the gift of HeLa cells.
Footnotes
The abbreviations used are: GlcNAc, N-acetyl-d-glucosamine; UDP-GlcNAc, uridine diphosphate N-acetyl-d-glucosamine; UDP-GalNAc, UDP-N-acetyl-d-galactosamine; CHES, 2-(cyclohexylamino)ethanesulfonate; TCA, trichloroacetic acid; and DTT, dithiothreitol.
Publisher's Disclaimer: This is a PDF file of an unedited manuscript that has been accepted for publication. As a service to our customers we are providing this early version of the manuscript. The manuscript will undergo copyediting, typesetting, and review of the resulting proof before it is published in its final citable form. Please note that during the production process errors may be discovered which could affect the content, and all legal disclaimers that apply to the journal pertain.
References
- 1.Varki A, Cummings R, Esko J, Freeze H, Hart G, Marth J, editors. Essentials of Glycobiology. Cold Spring Harbor Laboratory Press; New York: 1999. [PubMed] [Google Scholar]
- 2.Zachara NE, Hart GW. Cell signaling, the essential role of O-GlcNAc! Biochim Biophys Acta. 2006;1761:599–617. doi: 10.1016/j.bbalip.2006.04.007. [DOI] [PubMed] [Google Scholar]
- 3.Mengin-Lecreulx D, Siegel E, van Heijenoort J. Variations in UDP-N-acetylglucosamine and UDP-N-acetylmuramyl-pentapeptide pools in Escherichia coli after inhibition of protein synthesis. J Bacteriol. 1989;171:3282–3287. doi: 10.1128/jb.171.6.3282-3287.1989. [DOI] [PMC free article] [PubMed] [Google Scholar]
- 4.Taylor RP, Parker GJ, Hazel MW, Soesanto Y, Fuller W, Yazzie MJ, McClain DA. Glucose deprivation stimulates O-GlcNAc modification of proteins through up-regulation of O-linked N-acetylglucosaminyltransferase. J Biol Chem. 2008;283:6050–6057. doi: 10.1074/jbc.M707328200. [DOI] [PubMed] [Google Scholar]
- 5.Räbinä J, Mäki M, Savilahti EM, Järvinen N, Penttilä L, Renkonen R. Analysis of nucleotide sugars from cell lysates by ion-pair solid-phase extraction and reversed-phase high-performance liquid chromatography. Glycoconj J. 2001;18:799–805. doi: 10.1023/a:1021107602535. [DOI] [PubMed] [Google Scholar]
- 6.Kochanowski N, Blanchard F, Cacan R, Chirat F, Guedon E, Marc A, Goergen JL. Intracellular nucleotide and nucleotide sugar contents of cultured CHO cells determined by a fast, sensitive, and high-resolution ion-pair RP-HPLC. Anal Biochem. 2006;348:243–51. doi: 10.1016/j.ab.2005.10.027. [DOI] [PubMed] [Google Scholar]
- 7.Tomiya N, Ailor E, Lawrence SM, Betenbaugh MJ, Lee YC. Determination of Nucleotides and Sugar Nucleotides Involved in Protein Glycosylation by High-Performance Anion-Exchange Chromatography: Sugar Nucleotide Contents in Cultured Insect Cells and Mammalian Cells. Anal Biochem. 2001;293:129–137. doi: 10.1006/abio.2001.5091. [DOI] [PubMed] [Google Scholar]
- 8.Ritter JB, Genzel Y, Reichl U. High-performance anion-exchange chromatography using on-line electrolytic eluent generation for the determination of more than 25 intermediates from energy metabolism of mammalian cells in culture. J Chromatogr B. 2006;843:216–226. doi: 10.1016/j.jchromb.2006.06.004. [DOI] [PubMed] [Google Scholar]
- 9.Blake DA, Goldstein IJ. Resolution of nucleotide sugars and oligosaccharides by lectin affinity chromatography. Anal Biochem. 1980;102:103–109. doi: 10.1016/0003-2697(80)90324-3. [DOI] [PubMed] [Google Scholar]
- 10.Turnock DC, Ferguson MAJ. Sugar nucleotide pools of Trypanosoma brucei, Trypanosoma cruzi, and Leishmania major. Eukaryotic Cell. 2007;6:1450–1463. doi: 10.1128/EC.00175-07. [DOI] [PMC free article] [PubMed] [Google Scholar]
- 11.Creuzenet C, Belanger M, Wakarchuk WW, Lam JS. Expression, purification, and biochemical characterization of WbpP, a new UDP-GlcNAc C4 epimerase from Pseudomonas aeruginosa serotype O6. J Biol Chem. 2000;275:19060–19067. doi: 10.1074/jbc.M001171200. [DOI] [PubMed] [Google Scholar]
- 12.Sener K, Shen Z, Newburg DS, Jarroll EL. Amino sugar phosphate levels in Giardia change during cyst wall formation. Microbiology. 2004;150:1225–1230. doi: 10.1099/mic.0.26898-0. [DOI] [PubMed] [Google Scholar]
- 13.Sweet CR, Ribeiro AA, Raetz CRH. Oxidation and transamination of the 3″-position of UDP-N-Acetylglucosamine by enzymes from Acidithiobacillus ferrooxidans: role in the formation of lipid A molecules with four amide-linked acyl chains. J Biol Chem. 2004;279:25400–25410. doi: 10.1074/jbc.M400596200. [DOI] [PubMed] [Google Scholar]
- 14.Burrows LL, Charter DF, Lam JS. Molecular characterization of the Pseudomonas aeruginosa serotype O5 (PAO1) B-band lipopolysaccharide gene cluster. Mol Microbiol. 1996;22:481–495. doi: 10.1046/j.1365-2958.1996.1351503.x. [DOI] [PubMed] [Google Scholar]
- 15.Westman EL, McNally DJ, Rejzek M, Miller WL, Kannathasan VS, Preston A, Maskell DJ, Field RA, Brisson J-R, Lam JS. Identification and biochemical characterization of two novel UDP-2,3-diacetamido-2,3-dideoxy-α-D-glucuronic acid 2-epimerases from respiratory pathogens. Biochem J. 2007;405:123–130. doi: 10.1042/BJ20070017. [DOI] [PMC free article] [PubMed] [Google Scholar]
- 16.Melançon CE, Yu W-l, Liu H-w. TDP-Mycaminose biosynthetic pathway revised and conversion of desosamine pathway to mycaminose pathway with one gene. J Am Chem Soc. 2005;127:12240–12241. doi: 10.1021/ja053835o. [DOI] [PubMed] [Google Scholar]
- 17.Namboori SC, Graham DE. Acetamido sugar biosynthesis in the Euryarchaea. J Bacteriol. 2008;190:2987–2996. doi: 10.1128/JB.01970-07. [DOI] [PMC free article] [PubMed] [Google Scholar]
- 18.Helgadóttir S, Rosas-Sandoval G, Söll D, Graham DE. Biosynthesis of phosphoserine in the Methanococcales. J Bacteriol. 2007;189:575–582. doi: 10.1128/JB.01269-06. [DOI] [PMC free article] [PubMed] [Google Scholar]
- 19.Bader M. A systematic approach to standard addition methods in instrumental analysis. J Chem Educ. 1980;57:703–706. [Google Scholar]
- 20.Zhang H, Zhou Y, Bao H, Liu H-w. Vi Antigen biosynthesis in Salmonella typhi: characterization of UDP-N-acetylglucosamine C-6 dehydrogenase (TviB) and UDP-N-acetylglucosaminuronic acid C-4 epimerase (TviC) Biochemistry. 2006;45:8163–8173. doi: 10.1021/bi060446d. [DOI] [PMC free article] [PubMed] [Google Scholar]
- 21.Chan SY, Appling DR. Regulation of S-adenosylmethionine levels in Saccharomyces cerevisiae. J Biol Chem. 2003;278:43051–43059. doi: 10.1074/jbc.M308696200. [DOI] [PubMed] [Google Scholar]
- 22.Miller WL, Wenzel CQ, Daniels C, Larocque S, Brisson J-R, Lam JS. Biochemical characterization of WbpA, a UDP-N-acetyl-D-glucosamine 6-dehydrogenase involved in O-antigen biosynthesis in Pseudomonas aeruginosa PAO1. J Biol Chem. 2004;279:37551–37558. doi: 10.1074/jbc.M404749200. [DOI] [PubMed] [Google Scholar]
- 23.Müller T, Schmidt RR. Thymidine Diphospho-6-deoxy-α-D-ribo-3-hexulose--Synthesis of a central intermediate in the biosynthesis of di- and trideoxysugars. Angew Chem Int Ed Engl. 1995;34:1328–1329. [Google Scholar]
- 24.Rajan SS, Yang X, Collart F, Yip VLY, Withers SG, Varrot A, Thompson J, Davies GJ, Anderson WF. Novel catalytic mechanism of glycoside hydrolysis based on the structure of an NAD+/Mn2+-dependent phospho-α-glucosidase from Bacillus subtilis. Structure. 2004;12:1619–1629. doi: 10.1016/j.str.2004.06.020. [DOI] [PubMed] [Google Scholar]
- 25.Roskoski RJ. Determination of pyridine nucleotides by fluorescence and other optical techniques. In: Dolphin D, Avramović O, Poulson R, editors. Pyridine Nucleotide Coenzymes. John Wiley & Sons; New York: 1987. pp. 173–188. [Google Scholar]
- 26.Oppenheimer NJ. Chemical stability and reactivity of pyridine nucleotide coenzymes. In: Dolphin D, Avramović O, Poulson R, editors. Pyridine Nucleotide Coenzymes. John Wiley & Sons; New York: 1987. pp. 323–365. [Google Scholar]
- 27.Neidhardt FC. Chemical composition of Escherichia coli. Escherichia coli and Salmonella typhimurium. Cellular and Molecular. 1987;1:3–6. [Google Scholar]
- 28.Milewski S, Gabriel I, Olchowy J. Enzymes of UDP-GlcNAc biosynthesis in yeast. Yeast. 2006;23:1–14. doi: 10.1002/yea.1337. [DOI] [PubMed] [Google Scholar]
- 29.Lesage G, Bussey H. Cell wall assembly in Saccharomyces cerevisiae. Microbiol Mol Biol Rev. 2006;70:317–343. doi: 10.1128/MMBR.00038-05. [DOI] [PMC free article] [PubMed] [Google Scholar]
- 30.Bulik DA, Olczak M, Lucero HA, Osmond BC, Robbins PW, Specht CA. Chitin synthesis in Saccharomyces cerevisiae in response to supplementation of growth medium with glucosamine and cell wall stress. Eukaryotic Cell. 2003;2:886–900. doi: 10.1128/EC.2.5.886-900.2003. [DOI] [PMC free article] [PubMed] [Google Scholar]
- 31.Sherman F. Getting started with yeast. Methods Enzymol. 2002;350:3–41. doi: 10.1016/s0076-6879(02)50954-x. [DOI] [PubMed] [Google Scholar]
- 32.Wickson-Ginzburg M, Solomon AK. Electrolyte metabolism in HeLa cells. J Gen Physiol. 1963;46:1303–1315. doi: 10.1085/jgp.46.6.1303. [DOI] [PMC free article] [PubMed] [Google Scholar]
- 33.Haltiwanger RS, Grove K, Philipsberg GA. Modulation of O-linked N-acetylglucosamine levels on nuclear and cytoplasmic proteins in vivo using the peptide O-GlcNAc-β-N-acetylglucosaminidase inhibitor O-(2-acetamido-2-deoxy-D-glucopyranosylidene)amino-N-phenylcarbamate. J Biol Chem. 1998;273:3611–3617. doi: 10.1074/jbc.273.6.3611. [DOI] [PubMed] [Google Scholar]
- 34.Ritter JB, Genzel Y, Reichl U. Simultaneous extraction of several metabolites of energy metabolism and related substances in mammalian cells: Optimization using experimental design. Anal Biochem. 2008;373:349–369. doi: 10.1016/j.ab.2007.10.037. [DOI] [PubMed] [Google Scholar]
- 35.Marshall S, Nadeau O, Yamasaki K. Dynamic actions of glucose and glucosamine on hexosamine biosynthesis in isolated adipocytes. J Biol Chem. 2004;279:35313–35319. doi: 10.1074/jbc.M404133200. [DOI] [PubMed] [Google Scholar]
- 36.Michal G, Möllering H, Siedel J. Chemical design of indicator reactions for the visible range. In: Bergmeyer HU, et al., editors. Methods of Enzymatic Analysis. Verlag Chemie; Weinheim: 1983. pp. 197–232. [Google Scholar]