

Summary
Purpose
Arterial spin labeling (ASL) is a developing magnetic resonance imaging (MRI) method for noninvasive measurement of cerebral blood flow (CBF). The purpose of this study was to evaluate the usefulness of ASL for detecting interictal temporal hypoperfusion in temporal lobe epilepsy (TLE). ASL-derived CBF measurements were compared with those derived from H215O positron emission tomography (PET).
Methods
11 normal controls and 10 patients with medically intractable TLE were studied. Pulsed ASL (PASL) with quantitative imaging of perfusion using a single subtraction, second version (QUIPSS II) was performed in all subjects and H215O PET was performed in patients. Regional CBF values in the mesial and lateral temporal lobes were measured utilizing quantitative analysis of perfusion images. A perfusion asymmetry index (AI) was calculated for each region.
Results
In patients, mean CBF in the mesial temporal lobe was not significantly different between PASL and H215O PET, and ipsilateral mesial temporal CBF was lower than contralateral CBF with both techniques. PASL detected significant mesial temporal perfusion asymmetry agreeing with EEG laterality in four patients. H215O PET found ipsilateral interictal hypoperfusion in three. Both scans found unilateral hypoperfusion in one patient with bilateral EEG discharges.
Conclusions
Pulsed ASL may be a promising approach to detecting interictal hypoperfusion in TLE. This method has potential as a clinical alternative to H215O PET due to noninvasiveness and easy accessibility.
Keywords: Arterial spin labeling, Magnetic resonance imaging, Cerebral blood flow, Temporal lobe epilepsy, H215O PET
1. Introduction
Precise localization of the epileptogenic zone is essential for successful surgical treatment of temporal lobe epilepsy (TLE), the most common type of medically intractable epilepsy in adults (Hardy et al., 2003). In addition to structural magnetic resonance imaging (MRI), functional imaging, including measurement of regional cerebral blood flow (CBF) and metabolism in temporal epileptogenic zones has been investigated widely (Duncan 1992; Duncan 1997). Interictal [18F] fluorodeoxyglucose-positron emission tomography (18FDG-PET) is reported to have sensitivity of 60–90% (Theodore et al., 1983; Engel et al., 1990; Spencer 1994; Theodore et al., 1997; Van Paesschen et al., 2007). In contrast, interictal CBF studies using single photon emission computed tomography (SPECT) or H215O PET scan have not provided reliable localizing information (Stefan et al., 1987; Rowe et al., 1991; Spencer 1994; Theodore et al., 1994). A meta-analysis found that sensitivity for interictal SPECT was 44% (32.3–55.3%) (Devous et al., 1998). Relatively poor spatial resolution of current perfusion techniques may be one of the reasons why CBF measurement has limited localizing value, although uncoupling of metabolism and perfusion in the epileptogenic zone remains possible (Gaillard et al., 1995; Lee et al., 2001).
Recently several new magnetic resonance imaging (MRI) methods have been introduced to study local cerebral perfusion in TLE (Detre and Alsop 1999; Wu et al., 1999; Liu et al., 2001; Wolf et al., 2001; Alsop et al., 2002; O’Brien et al., 2007). Perfusion MRI has substantial advantages over SPECT and PET, including non-invasiveness, no radiation exposure, easier accessibility, and higher spatial resolution, especially at high magnetic field (Calamante et al., 1999; Carroll et al., 2002; Zappe et al., 2007). Arterial spin labeling (ASL), a developing MRI technique, is capable of quantifying local CBF by measuring the inflow of magnetically labeled arterial blood into the target region (Detre et al., 1992; Williams et al., 1992; Wong et al., 1997; Buxton et al., 1998; Wong et al., 1999). However, systemic errors in CBF quantitation such as transit delays and contamination by intravascular signal have hindered clinical application of ASL (Wong et al., 1997; Golay et al., 2004; Wong 2005). Quantitative imaging of perfusion using a single subtraction, second version (QUIPSS II) is a pulsed ASL (PASL) technique, which has been developed to reduce these limitations (Wong et al., 1997, 1998a, b; Luh et al., 1999; Wong et al., 1999; Barbier et al., 2001).
The purpose of this study was to determine whether PASL MRI using QUIPSS II saturated pulse could be a useful clinical tool to lateralize epileptic foci in TLE. We used high-resolution PASL MRI to provide better spatial coverage and higher temporal resolution than previous studies. To assess the feasibility of PASL for detection of lateralized temporal hypoperfusion, we compared the CBF values obtained from PASL to those derived from H215O PET.
2. Methods
2.1. Subject Selection
We included 11 healthy volunteers (6 men and 5 women; mean age ± SD, 34.8 ± 13.1 years; range, 17–56 years) and 10 patients (7 men and 3 women; mean age ± SD, 35.9 ± 14.8; range 19–56 years), referred to the Clinical Epilepsy Section, National Institute of Neurological Disorders and Stroke, National Institute of Health. All patients received ictal scalp video-electroencephalography (EEG) monitoring to localize epileptozenic foci, and four patients underwent subdural EEG monitoring after all imaging studies. Patients with evidence of structural lesions on MRI (except mesial temporal sclerosis) or progressive neurologic process were excluded. None of the patients had a seizure for at least 72 hours prior to brain perfusion imaging or a secondarily generalized tonic clonic seizure for at least 1 week before the studies. Informed consent was obtained from all subjects. The study was approved by the NINDS Institutional Review Board.
Lateralization based on ictal video-EEG and structural routine MRI is summarized in Table 1. The epileptic foci were left-sided in seven patients and right-sided in two patients. One had bilateral temporal lobe epilepsy. Four patients showed abnormal MRI findings compatible with mesial temporal sclerosis on the same side of EEG lateralization. Temporal lobe resection was carried out in three patients (1, 5, and 6) and hippocampal sclerosis was present on histopathological examination.
Table 1.
Clinical characteristics of patients
| Patient no. | Age (years) | Sex | EEG focus | MRI findings |
|---|---|---|---|---|
| 1 | 55 | M | Left | Left HS |
| 2 | 27 | M | Left | Normal |
| 3 | 56 | M | Right | Right HA |
| 4 | 24 | M | Left | Normal |
| 5 | 27 | F | Left | Normal |
| 6 | 46 | F | Left | Left HS |
| 7 | 19 | M | Right | Normal |
| 8 | 30 | M | Bilateral | Normal |
| 9 | 53 | M | Left | Left HS |
| 10 | 22 | F | Left | Normal |
M, male; F, female; HS, hippocampal sclerosis; HA, hippocampal atrophy.
2.2. Magnetic Resonance Imaging
Perfusion MRI scans were performed on patients and controls, using a GE Signa 3T MRI scanner. ASL perfusion image was obtained with QUIPSS II sequence, which is based on a proximal inversion with a control for off resonance effects (PICORE) (Wong et al., 1997, 1998b; Luh et al., 1999). A 10-cm tagging slab was generated by a 15-ms hyperbolic secant inversion pulse, leaving a 1-cm gap between the distal end of the tag and the proximal edge of the imaging slice. Each perfusion scan comprised a series of 150 echo-planer images (EPI) in which blood was alternately tagged and untagged. The former was referred to as the tag image and the latter as the control image. For each scan, a volume consisting of five oblique axial slices with 7 mm thickness was chosen to cover the temporal area. Imaging parameters were as follows: TR/TE = 2500 ms/30 ms, TI1 (the first inversion time in the QUIPSS II) = 700 ms, TI2 (the second inversion time) = 1400 ms, field of view (FOV) = 24-cm and matrix size =64 × 64. A short imaging series comprising 10 volumes of EPI, with the same slices and resolution as the perfusion sequence, were additionally acquired. Anatomical MRI was collected using a high-resolution three-dimensional (3D) spoiled gradient recalled echo (SPGR) sequence.
2.3. H215O PET Imaging
H215O PET studies were performed on all patients using a GE Advance Tomography (GE, Waukesha, WI), which simultaneously makes 35 simultaneous slices with 4.25 mm inter-slice separation. The spatial resolution in all directions was 6 mm full width at half maximum (FWHM) after reconstruction. A molded thermoplastic facemask was applied to reduce head motion, and EEG was continuously recorded to ensure the interictal state. Eight-minute transmission scan was acquired for the purpose of attenuation correction. Following the transmission scan, an intravenous bolus of 10 mCi 15O-H2O was administrated and continuous arterial blood measurements were performed with an automatic blood counter. A single 60-second scan was acquired in 3D mode and quantitative CBF maps were generated using the measured arterial input function (Giovacchini et al., 2005).
2.4. Data Processing
ASL data were corrected for head motion using a 3D rigid body registration algorithm. To improve efficacy of registration, non-brain tissue was first removed from structural MRI using the Brain Extraction Tool (Smith 2002). The 150th volume of ASL images was co-registered to the de-skulled high-resolution anatomical MRI with the FMRIB’s Linear Image Registration Tool (FLIRT) using 6 degrees of freedom (DOF) and the mutual information cost function (Jenkinson and Smith 2001). The fit was qualitatively assessed by fusion of the co-registered ASL image with structural MRI. This fused image was also used to determine on which MRI sections the regions of interest (ROI) could be drawn such that the ASL and anatomical MRI images spatially overlapped well. The H215O PET flow image was also registered to the structural MRI using a 6 DOF registration with mutual information cost function. The PET data were corrected for partial volume effects (Giovacchini et al., 2005).
ROIs were manually defined in mesial and lateral temporal lobes by one investigator (Y.M.L.) to maintain consistency. Medial temporal ROIs included amygdala, hippocampus, and parahippocampus; Lateral temporal ROIs included superior, middle, and inferior temporal lobes. Large regions were ensured to boost signal-to-noise ratio (SNR) and the specification of individual structures was not done. All ROI drawn on anatomical MRI were then applied to both registered ASL and H215O PET images. Mean CBF values for each ROI were calculated by the following methods (See the detailed description below).
2.5. Quantitation of Regional CBF
In pulsed ASL, a difference signal between tag and control images (ΔM) is proportional to CBF and given by:
| (1a) |
| (1b) |
where T1B is the T1 of blood that is assumed to be 1.5 seconds at 3T. q is a correction factor depending on the exchange time and tissue T1, which is assumed to be 1 for gray matter. MOB is the signal intensity of fully relaxed blood in the signal unit and is estimated as:
| (2) |
The factor 1.06 is the ratio of blood to white matter from a proton density image as measured in a previous study (Wong et al., 1998b). MOW is the signal intensity of white matter in EPI sequence with infinite TR. This value can be obtained from the first image of the short imaging run of EPI. T *2W is the T2* of white matter and T*2B is the T 2* of arterial blood. T *2W is assumed to be 40 ms and T*2B is estimated to be 100 ms. Due to T 2*decay, the average signal intensity measured from pure white matter (SW) is MOW · exp(−TE/T*2B). The measured ASL signal difference (ΔS) has also T 2* weighting since it is acquired with EPI, and consequently it can be expressed as: ΔS = ΔM · exp(−TE/*2B). In order to compute local CBF from measured ASL intensities, equation (1b) can be rewritten as:
| (3) |
Assuming the brain density of 1g/mL, the CBF value in s−1 can be converted to 6000 (mL of blood)/(100 mL of tissue)/min.
2.6. Statistical Analysis
For patients, a perfusion asymmetry index (AI) was calculated from the mean CBF values identified in each region, using the following formula: AI (%) = 100·(ipsilateral − contralateral)/[(ipsilateral + contralateral)/2]. A negative AI implies relative hypoperfusion in the affected temporal lobe. For controls, AI was calculated by the left-right asymmetry: AI (%) = 100·(left − right)/[(left + right)/2]. For comparison of patients and controls, the mean values of absolute PASL AI were compared using a Mann-Whitney U test. The correlation of AI values between PASL and PET was examined by Spearman correlation coefficients. A Wilcoxon signed rank test was applied to compare mean mesial temporal CBF estimates between two methods and to find side to side difference in each technique.
3. Results
Table 2 shows mean mesial temporal blood flow obtained from PASL MRI and H215O PET in patients. The mean mesial temporal blood flow on PASL was comparable to PET flow measurement, although there was a non-significant trend for PET estimates to be higher (p > 0.1). Mesial temporal CBF was significantly decreased ipsilateral to the seizure focus on PASL MRI (p < 0.01) as well as H215O PET (p = 0.02). In controls, PASL-derived mean CBF ± SD was 37.99 ± 6.38 mL/100g/min on the left side and 39.31 ± 5.09 mL/100g/min on the right side (p= 0.29).
Table 2.
Mean mesial temporal blood flows measured with PASL MRI and H215O PET
| PASL CBF (Mean ± SD, mL/100g/min) | PET CBF (Mean ± SD, mL/100g/min) | p value | |
|---|---|---|---|
| Ipsilateral MTL | 37.69 ± 17.12 | 50.06 ± 17. 09 | 0.11 |
| Contralateral MTL | 45.12 ± 20.92 | 54.72 ± 17.42 | 0.24 |
CBF, cerebral blood flow; PASL, pulsed arterial spin labeling; MTL, mesial temporal lobe.
The mean absolute AI ± SD for the mesial temporal region (Fig. 1) was 11.02 ± 7.81 (range, 0.48–23.32) in controls and 18.16 ± 13.37 (range, 1.83–37.67) in patients (p = 0.26); for the lateral temporal region, it was 10.29 ± 6.78 (range, 0.19–20.42) in controls and 10.64 ± 7.38 (range, 0.33–22.95) in patients (p = 0.94).
Figure 1.

Bar graph comparing mean absolute asymmetric indices of temporal perfusion between patients and controls. Patients had greater perfusion asymmetry in the mesial temporal lobe than controls, but the difference between groups did not reach statistical significance (p = 0.26). Data are expressed as mean ± standard error of the mean. AI, asymmetric index; MTL, mesial temporal lobe; LTL, lateral temporal lobe.
Table 3 shows individual AI data derived from both techniques. Mesial temporal perfusion asymmetries in PASL were greater than H215O PET in six patients. PASL found mesial temporal perfusion asymmetries exceeding 1-SD of control mean value in five patients (patient 2, 5, 6, 8, and 9). Significant asymmetries were still observed in three, using the threshold of 2-SD beyond control mean. Based on our laboratory H215O PET data, the mean absolute perfusion AI for hippocampal region is 8.58 ± 6.34 (range, 0.17–16.59) in normal controls. This value was used as control mean ± SD for H215O PET data. H215O PET found significant hypoperfusion in the affected temporal lobe in three (patient 1, 4 and 9) at the 1-SD threshold of control mean and in one (patient 1) at the 2-SD threshold. The direction of the asymmetry with PASL was in agreement with ictal video -EEG lateralization in each case except for patient 8. While EEG showed bilateral seizure foci in patient 8, PASL found interictal hypoperfusion in the left mesial temporal lobe and 18FDG-PET scan revealed glucose hypometabolism in the left lateral temporal region. Figure 2 is an example of the CBF images acquired from the same slices of PASL and H215O PET in patient 6. Compared with H215O PET image, the PASL CBF map showed a more prominent perfusion decrease in the mesial temporal lobe ipsilateral to the EEG focus. In patient 5, PASL indicated left mesial temporal hypoperfusion, which coincided with EEG laterality, whereas H215O PET indicated mild contralateral temporal hypoperfusion that was statistically insignificant. There was no significant correlation between PASL-based AI and PET-derived AI for the mesial temporal lobe (r=−0.10, p = 0.77).
Table 3.
Asymmetric indices of temporal lobe perfusion in TLE patients
| Patient no. | PASL MRI AI (%)
|
H215O PET AI (%)
|
||
|---|---|---|---|---|
| MTL | LTL | MTL | LTL | |
| 1 | −9.55 | −7.70 | −22.80 | −16.31 |
| 2 | −26.48 | −0.33 | −5.20 | −7.97 |
| 3 | −1.94 | −15.91 | −3.30 | 1.27 |
| 4 | −1.83 | −2.57 | −15.84 | 3.61 |
| 5 | −37.67 | −11.49 | 5.23 | 0.47 |
| 6 | −28.03 | −18.88 | −8.98 | −6.29 |
| 7 | −5.77 | −3.19 | −8.32 | 10.83 |
| 8 | −35.40 | −10.28 | −12.05 | −37.30 |
| 9 | −19.10 | −22.95 | −17.04 | −24.92 |
| 10 | −15.80 | −13.10 | −5.42 | −14.44 |
PASL, pulsed arterial spin labeling; AI, asymmetric index; MTL, mesial temporal lobe; LTL, lateral temporal lobe.
Figure 2.
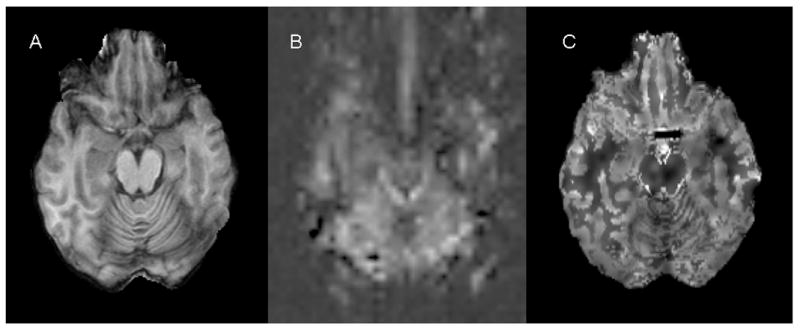
Anatomical MR and perfusion images obtained from a patient with left temporal lobe epilepsy (patient 6). Panel A: axial spoiled gradient recalled echo (SPGR) image; Panel B: pulsed arterial spin labeling (PASL) image at the same anatomic level; Panel C: H215O PET CBF image at the same anatomic level. PASL CBF map (B) shows more prominent perfusion decrease in the ipsilateral mesial temporal lobe as compared to H215O PET CBF image (C).
4. Discussion
The results of this study suggest that PASL with QUIPSS II is worthy of further study as a potential method for lateralization of epileptic foci by detecting interictal asymmetries in mesial temporal perfusion, particularly in patients with normal MRI. Mesial temporal perfusion asymmetries in PASL were relatively greater than in H215O PET in our study, suggesting PASL MRI might be more sensitive than H215O PET to detect interictal perfusion asymmetries. PASL showed correct lateralization in patient 5, whereas H215O PET did not. Only one patient did not show agreement in PASL with ictal video-EEG lateralization (case 8). The patient had bitemporal seizure foci, but both CBF procedures showed left temporal hypoperfusion, suggesting the possibility of lateralization.
Previous ASL studies reported similar findings in patients with TLE. In a study of continuous ASL (CASL) MRI, mesial temporal perfusion was more asymmetric in patients than in controls, and the perfusion AI correlated with asymmetries derived from FDG PET metabolism and hippocampal volume (Wolf et al., 2001). PASL may be superior to CASL. CASL theoretically has higher signal-to-noise ratio (SNR) than PASL, but in practice, the ratio advantage is only 0 to 25% because of flow-velocity dependent imperfect tagging efficiency and vascular artifact (Wong et al., 1999). CASL is more sensitive to magnetization transfer (MT) effects than PASL due to a long-off resonance radiofrequency (RF) pulse. MT related attenuation of the tissue signal is negligible in PASL (Wong et al., 1998b; Calamante et al., 1999; Buxton 2005). Moreover, PASL may be more practical at high magnetic fields (≥ 3.0T) because CASL needs more RF power at high fields for the same RF amplitude (Wong et al., 1999) and can be restricted by system performance capability and FDA guidelines about RF energy absorption per unit mass (Liu and Brown 2007).
In another study using flow-sensitive alternating inversion recovery with half-Fourier single shot turbo spin-echo (FAIR-HASTE), the temporal perfusion AI on PASL correlated with those on H215O PET (Liu et al., 2001). However, lateralization based on PASL was not compared with seizure laterality based on EEG. Unlike the FAIR-HASTE study, there was no correlation of AI values between PASL and PET in our study. The reasons are not clear why there is discrepancy between two measurements. Several factors could account for the discrepancy, including different spatial resolution and partial volume effects (Ye et al., 2000). In prototype PASL techniques including echoplanar imaging and signal targeting with alternating RF (EPISTAR) and FAIR, there are spatially variable transit delays of blood from the tagging region to the imaging slice. QUIPSS II is a modification of conventional PASL techniques that attempts to minimize transit time effects by application of additional saturation pulse to directly control the time duration of the tag (Wong et al., 1997, 1998a, b; Luh et al., 1999; Golay et al., 2004). This method does not require an additional coil for tagging and allows multislice acquisition. However, incomplete saturation of arterial spins and spatial mismatch between the distal saturation edge and inversion slice profiles can make CBF measurement inaccurate (Luh et al., 1999).
As compared to PET scan, ASL provides better spatial and temporal resolution, assuming adequate SNR, and performs multiple repeated measurements as clinically indicated (Carroll et al., 2002; Wintermark et al., 2005; Donahue et al., 2006; Zappe et al., 2007). It is entirely noninvasive, easily accessible, and requires no injection or ionizing radiation, allowing CBF imaging for children (Wintermark et al., 2005; Petersen et al., 2006; Zappe et al., 2007). ASL has been reported to have favorable reproducibility, although this could be restricted by low SNR (Parkes et al., 2004; Jahng et al., 2005).
Perfusion decrease in the affected mesial temporal lobe could result from mesial temporal atrophy. However, clear perfusion asymmetry on PASL was identified despite normal structural MRI in cases 2, 5 and 8. Moreover, high field PASL imaging used in this study was acquired at high spatial resolution, reducing alterations of true CBF values due to partial volume effect (Donahue et al., 2006). It is possible that functional alterations such as receptor loss, hypoperfusion, or hypometabolism may precede structural atrophy in the epileptic zone (Giovacchini et al., 2005).
In summary, the results of this study suggested that PASL may have potential as a clinical alternative to H215O PET for quantitative assessment of CBF in patients with epilepsy.
References
- Alsop DC, Connelly A, Duncan JS, Hufnagel A, Pierpaoli C, Rugg-Gunn FJ. Diffusion and Perfusion MRI in Epilepsy. Epilepsia. 2002;43:69–77. [Google Scholar]
- Barbier EL, Lamalle L, Decorps M. Methodology of brain perfusion imaging. J Magn Reson Imaging. 2001;13:496–520. doi: 10.1002/jmri.1073. [DOI] [PubMed] [Google Scholar]
- Buxton RB, Frank LR, Wong EC, Siewert B, Warach S, Edelman RR. A general kinetic model for quantitative perfusion imaging with arterial spin labeling. Magn Reson Med. 1998;40:383–396. doi: 10.1002/mrm.1910400308. [DOI] [PubMed] [Google Scholar]
- Buxton RB. Quantifying CBF with arterial spin labeling. J Magn Reson Imaging. 2005;22:723–726. doi: 10.1002/jmri.20462. [DOI] [PubMed] [Google Scholar]
- Calamante F, Thomas DL, Pell GS, Wiersma J, Turner R. Measuring cerebral blood flow using magnetic resonance imaging techniques. J Cereb Blood Flow Metab. 1999;19:701–735. doi: 10.1097/00004647-199907000-00001. [DOI] [PubMed] [Google Scholar]
- Carroll TJ, Teneggi V, Jobin M, Squassante L, Treyer V, Hany TF, Burger C, Wang L, Bye A, Von Schulthess GK, Buck A. Absolute quantification of cerebral blood flow with magnetic resonance, reproducibility of the method, and comparison with H215O positron emission tomography. J Cereb Blood Flow Metab. 2002;22:1149–1156. doi: 10.1097/00004647-200209000-00013. [DOI] [PubMed] [Google Scholar]
- Detre JA, Leigh JS, Williams DS, Koretsky AP. Perfusion imaging. Magn Reson Med. 1992;23:37–45. doi: 10.1002/mrm.1910230106. [DOI] [PubMed] [Google Scholar]
- Detre JA, Alsop DC. Perfusion magnetic resonance imaging with continuous arterial spin labeling: methods and clinical applications in the central nervous system. Eur J Radiol. 1999;30:115–124. doi: 10.1016/s0720-048x(99)00050-9. [DOI] [PubMed] [Google Scholar]
- Devous MD, Sr, Thisted RA, Morgan GF, Leroy RF, Rowe CC. SPECT brain imaging in epilepsy: a meta-analysis. J Nucl Med. 1998;39:285–293. [PubMed] [Google Scholar]
- Donahue MJ, Lu H, Jones CK, Pekar JJ, van Zijl PC. An account of the discrepancy between MRI and PET cerebral blood flow measures. A high-field MRI investigation. NMR Biomed. 2006;19:1043–1054. doi: 10.1002/nbm.1075. [DOI] [PubMed] [Google Scholar]
- Duncan JS. Imaging and epilepsy. Brain. 1997;120:339–377. doi: 10.1093/brain/120.2.339. [DOI] [PubMed] [Google Scholar]
- Duncan R. Epilepsy, cerebral blood flow, and cerebral metabolic rate. Cerebrovasc Brain Metab Rev. 1992;4:105–121. [PubMed] [Google Scholar]
- Engel J, Jr, Henry TR, Risinger MW, Mazziotta JC, Sutherling WW, Levesque MF, Phelps ME. Presurgical evaluation for partial epilepsy: relative contributions of chronic depth-electrode recordings versus FDG-PET and scalp-sphenoidal ictal EEG. Neurology. 1990;40:1670–1677. doi: 10.1212/wnl.40.11.1670. [DOI] [PubMed] [Google Scholar]
- Gaillard WD, Fazilat S, White S, Malow B, Sato S, Reeves P, Herscovitch P, Theodore WH. Interictal metabolism and blood flow are uncoupled in temporal lobe cortex of patients with complex partial epilepsy. Neurology. 1995;45:1841–1847. doi: 10.1212/wnl.45.10.1841. [DOI] [PubMed] [Google Scholar]
- Giovacchini G, Toczek MT, Bonwetsch R, Bagic A, Lang L, Fraser C, Reeves-Tyer P, Herscovitch P, Eckelman WC, Carson RE, Theodore WH. 5-HT 1A receptors are reduced in temporal lobe epilepsy after partial-volume correction. J Nucl Med. 2005;46:1128–1135. [PMC free article] [PubMed] [Google Scholar]
- Golay X, Hendrikse J, Lim TC. Perfusion imaging using arterial spin labeling. Top Magn Reson Imaging. 2004;15:10–27. doi: 10.1097/00002142-200402000-00003. [DOI] [PubMed] [Google Scholar]
- Hardy SG, Miller JW, Holmes MD, Born DE, Ojemann GA, Dodrill CB, Hallam DK. Factors predicting outcome of surgery for intractable epilepsy with pathologically verified mesial temporal sclerosis. Epilepsia. 2003;44:565–568. doi: 10.1046/j.1528-1157.2003.39202.x. [DOI] [PubMed] [Google Scholar]
- Jahng GH, Song E, Zhu XP, Matson GB, Weiner MW, Schuff N. Human brain: reliability and reproducibility of pulsed arterial spin-labeling perfusion MR imaging. Radiology. 2005;234:909–916. doi: 10.1148/radiol.2343031499. [DOI] [PMC free article] [PubMed] [Google Scholar]
- Jenkinson M, Smith S. A global optimisation method for robust affine registration of brain images. Med Image Anal. 2001;5:143–156. doi: 10.1016/s1361-8415(01)00036-6. [DOI] [PubMed] [Google Scholar]
- Lee DS, Lee JS, Kang KW, Jang MJ, Lee SK, Chung JK, Lee MC. Disparity of perfusion and glucose metabolism of epileptogenic zones in temporal lobe epilepsy demonstrated by SPM/SPAM analysis on 15O water PET, [18F]FDG-PET, and [99mTc]-HMPAO SPECT. Epilepsia. 2001;42:1515–1522. doi: 10.1046/j.1528-1157.2001.21801.x. [DOI] [PubMed] [Google Scholar]
- Liu HL, Kochunov P, Hou J, Pu Y, Mahankali S, Feng CM, Yee SH, Wan YL, Fox PT, Gao JH. Perfusion-weighted imaging of interictal hypoperfusion in temporal lobe epilepsy using FAIR-HASTE: comparison with H2 15O PET measurements. Magn Reson Med. 2001;45:431–435. doi: 10.1002/1522-2594(200103)45:3<431::aid-mrm1056>3.0.co;2-e. [DOI] [PubMed] [Google Scholar]
- Liu TT, Brown GG. Measurement of cerebral perfusion with arterial spin labeling: Part 1. Methods. J Int Neuropsychol Soc. 2007;13:1–9. doi: 10.1017/S1355617707070646. [DOI] [PubMed] [Google Scholar]
- Luh WM, Wong EC, Bandettini PA, Hyde JS. QUIPSS II with thin-slice TI1 periodic saturation: a method for improving accuracy of quantitative perfusion imaging using pulsed arterial spin labeling. Magn Reson Med. 1999;41:1246–1254. doi: 10.1002/(sici)1522-2594(199906)41:6<1246::aid-mrm22>3.0.co;2-n. [DOI] [PubMed] [Google Scholar]
- O’Brien TJ, David EP, Kilpatrick CJ, Desmond P, Tress B. Contrast-enhanced perfusion and diffusion MRI accurately lateralize temporal lobe epilepsy: a pilot study. J Clin Neurosci. 2007;14:841–849. doi: 10.1016/j.jocn.2006.07.003. [DOI] [PubMed] [Google Scholar]
- Parkes LM, Rashid W, Chard DT, Tofts PS. Normal cerebral perfusion measurements using arterial spin labeling: reproducibility, stability, and age and gender effects. Magn Reson Med. 2004;51:736–743. doi: 10.1002/mrm.20023. [DOI] [PubMed] [Google Scholar]
- Petersen ET, Zimine I, Ho YC, Golay X. Non-invasive measurement of perfusion: a critical review of arterial spin labelling techniques. Br J Radiol. 2006;79:688–701. doi: 10.1259/bjr/67705974. [DOI] [PubMed] [Google Scholar]
- Rowe CC, Berkovic SF, Austin MC, Saling M, Kalnins RM, McKay WJ, Bladin PF. Visual and quantitative analysis of interictal SPECT with technetium-99m-HMPAO in temporal lobe epilepsy. J Nucl Med. 1991;32:1688–1694. [PubMed] [Google Scholar]
- Smith SM. Fast robust automated brain extraction. Hum Brain Mapp. 2002;17:143–155. doi: 10.1002/hbm.10062. [DOI] [PMC free article] [PubMed] [Google Scholar]
- Spencer SS. The relative contributions of MRI, SPECT, and PET imaging in epilepsy. Epilepsia. 1994;35(Suppl 6):S72–89. doi: 10.1111/j.1528-1157.1994.tb05990.x. [DOI] [PubMed] [Google Scholar]
- Stefan H, Pawlik G, Bocher-Schwarz HG, Biersack HJ, Burr W, Penin H, Heiss WD. Functional and morphological abnormalities in temporal lobe epilepsy: a comparison of interictal and ictal EEG, CT, MRI, SPECT and PET. J Neurol. 1987;234:377–384. doi: 10.1007/BF00314081. [DOI] [PubMed] [Google Scholar]
- Theodore WH, Newmark ME, Sato S, Brooks R, Patronas N, De La Paz R, DiChiro G, Kessler RM, Margolin R, Manning RG, et al. [18F]fluorodeoxyglucose positron emission tomography in refractory complex partial seizures. Ann Neurol. 1983;14:429–437. doi: 10.1002/ana.410140406. [DOI] [PubMed] [Google Scholar]
- Theodore WH, Gaillard WD, Sato S, Kufta C, Leiderman D. Positron emission tomographic measurement of cerebral blood flow and temporal lobectomy. Ann Neurol. 1994;36:241–244. doi: 10.1002/ana.410360220. [DOI] [PubMed] [Google Scholar]
- Theodore WH, Sato S, Kufta CV, Gaillard WD, Kelley K. FDG-positron emission tomography and invasive EEG: seizure focus detection and surgical outcome. Epilepsia. 1997;38:81–86. doi: 10.1111/j.1528-1157.1997.tb01081.x. [DOI] [PubMed] [Google Scholar]
- Van Paesschen W, Dupont P, Sunaert S, Goffin K, Van Laere K. The use of SPECT and PET in routine clinical practice in epilepsy. Curr Opin Neurol. 2007;20:194–202. doi: 10.1097/WCO.0b013e328042baf6. [DOI] [PubMed] [Google Scholar]
- Williams DS, Detre JA, Leigh JS, Koretsky AP. Magnetic resonance imaging of perfusion using spin inversion of arterial water. Proc Natl Acad Sci U S A. 1992;89:212–216. doi: 10.1073/pnas.89.1.212. [DOI] [PMC free article] [PubMed] [Google Scholar]
- Wintermark M, Sesay M, Barbier E, Borbely K, Dillon WP, Eastwood JD, Glenn TC, Grandin CB, Pedraza S, Soustiel JF, Nariai T, Zaharchuk G, Caille JM, Dousset V, Yonas H. Comparative overview of brain perfusion imaging techniques. Stroke. 2005;36:e83–99. doi: 10.1161/01.STR.0000177884.72657.8b. [DOI] [PubMed] [Google Scholar]
- Wolf RL, Alsop DC, Levy-Reis I, Meyer PT, Maldjian JA, Gonzalez-Atavales J, French JA, Alavi A, Detre JA. Detection of mesial temporal lobe hypoperfusion in patients with temporal lobe epilepsy by use of arterial spin labeled perfusion MR imaging. AJNR Am J Neuroradiol. 2001;22:1334–1341. [PMC free article] [PubMed] [Google Scholar]
- Wong EC, Buxton RB, Frank LR. Implementation of quantitative perfusion imaging techniques for functional brain mapping using pulsed arterial spin labeling. NMR Biomed. 1997;10:237–249. doi: 10.1002/(sici)1099-1492(199706/08)10:4/5<237::aid-nbm475>3.0.co;2-x. [DOI] [PubMed] [Google Scholar]
- Wong EC, Buxton RB, Frank LR. A theoretical and experimental comparison of continuous and pulsed arterial spin labeling techniques for quantitative perfusion imaging. Magn Reson Med. 1998a;40:348–355. doi: 10.1002/mrm.1910400303. [DOI] [PubMed] [Google Scholar]
- Wong EC, Buxton RB, Frank LR. Quantitative imaging of perfusion using a single subtraction (QUIPSS and QUIPSS II) Magn Reson Med. 1998b;39:702–708. doi: 10.1002/mrm.1910390506. [DOI] [PubMed] [Google Scholar]
- Wong EC, Buxton RB, Frank LR. Quantitative perfusion imaging using arterial spin labeling. Neuroimaging Clin N Am. 1999;9:333–342. [PubMed] [Google Scholar]
- Wong EC. Quantifying CBF with pulsed ASL: technical and pulse sequence factors. J Magn Reson Imaging. 2005;22:727–731. doi: 10.1002/jmri.20459. [DOI] [PubMed] [Google Scholar]
- Wu RH, Bruening R, Noachtar S, Arnold S, Berchtenbreiter C, Bartenstein P, Drzezga A, Tatsch K, Reiser M. MR measurement of regional relative cerebral blood volume in epilepsy. J Magn Reson Imaging. 1999;9:435–440. doi: 10.1002/(sici)1522-2586(199903)9:3<435::aid-jmri11>3.0.co;2-j. [DOI] [PubMed] [Google Scholar]
- Ye FQ, Berman KF, Ellmore T, Esposito G, van Horn JD, Yang Y, Duyn J, Smith AM, Frank JA, Weinberger DR, McLaughlin AC. H215O PET validation of steady-state arterial spin tagging cerebral blood flow measurements in humans. Magn Reson Med. 2000;44:450–456. doi: 10.1002/1522-2594(200009)44:3<450::aid-mrm16>3.0.co;2-0. [DOI] [PubMed] [Google Scholar]
- Zappe AC, Reichold J, Burger C, Weber B, Buck A, Pfeuffer J, Logothetis NK. Quantification of cerebral blood flow in nonhuman primates using arterial spin labeling and a two-compartment model. Magn Reson Imaging. 2007;25:775–83. doi: 10.1016/j.mri.2006.11.028. [DOI] [PubMed] [Google Scholar]