

Summary
We previously reported the cellular, functional and cytogenetic characterization of immunoresistant (IR) 13-06-IR29 and 13-06-IR30 human glioma cell clones isolated after immunoselection with alloreactive cytotoxic T lymphocytes (aCTL). Relative to the 13-06-MG parental cells, both clones resisted aCTL lysis at multiple effector to target ratios; the resistant phenotype was maintained for 13-41 cell doublings after cloning and when selective pressure was removed; cross-resistance to other inducers of apoptosis/cell death was also observed (Gomez et al, 2006; Gomez and Kruse, 2007). In this study we further characterize the IR clones for factors that may contribute to the resistance. Data obtained by in-vitro quantitative morphologic and 7-amino actinomycin D flow cytometric assays revealed reduced apoptotic cell death when IR clones were coincubated with aCTL, relative to the parental cells. Since changes in apoptosis were observed, we examined the expression patterns of apoptosis-related genes in several extracts of parental cells and IR clones using pathway-specific cDNA microarray analysis. In general, the apoptotic factors were downregulated in the IR clones. From three separate extracts analyzed separately on microarrays, three factors, ATM, caspases 3 and 8, were statistically downregulated in both IR clones. Immunoblotting of the proteins confirmed the findings. Therefore, a possible mechanism for immunoresistance in gliomas may be achieved by the downregulation of one or more genes in the apoptotic pathway.
Keywords: Apoptosis, Astrocytoma, Cellular Therapy, Adoptive Immunotherapy, CTL
I. Introduction
The cellular heterogeneity and genomic instability of malignant gliomas prevents their complete eradication even with aggressive administration of therapies that include surgery, radiation and chemotherapy (Stupp et al, 2005). The inability of the host to mount an effective anti-tumoral immune response is in part due to their location in a semi-privileged immune site. As well, gliomas may evade host-mediated immune responses by expressing FasL or by secreting immunosuppressive factors including transforming growth factor-beta and prostaglandin E2 (Baxevanis et al, 1993; Fakhrai et al, 1996; Walker et al, 1997). Both active and passive forms of immunotherapy or combinations of them have been investigated as a means to stimulate and/or enhance anti-tumoral immune responses in glioma patients and to circumvent glioma-induced immunosuppression (Virasch and Kruse, 2001). The observation that glioma cells, unlike normal neurons and glia, express relatively abundant levels of class I human leukocyte antigens (HLA) indicated that gliomas would be amenable to cellular therapy with HLA-restricted, ex-vivo activated, alloreactive cytotoxic T lymphocytes (aCTL) sensitized to patient HLA (Lampson and Hickey, 1986; Read et al, 2003).
In-vitro and in-vivo studies demonstrated that aCTL displayed potent lytic activity towards human and rat glioma cells, extended survival or cured glioma-bearing rats (Kruse et al, 1990,1994; Fleshner et al, 1992; Redd et al, 1992; Kruse and Beck, 1997; Kruse and Merchant, 1997). Based on these studies, a Phase I clinical trial was performed involving local adoptive immunotherapy with recombinant human interleukin-2 (IL-2) and aCTL (Kruse et al, 1997; Kruse and Rubinstein, 2001). Three of six recurrent glioma patients treated may have responded to the therapy (Kruse and Rubinstein, 2001). Despite this and other Phase I immunotherapy trials for glioma patients (Quattrocchi et al, 1999; Plautz et al, 2000; Liau et al, 2005) further Phase II and III testing has not followed. Thus, immunotherapy is not yet an accepted treatment for glioma patients.
To enhance adoptive immunotherapy with aCTL, it is important to determine the reasons why not all brain tumor cells were eradicated by the treatment. Among several plausible explanations, one is the survival of intrinsically immunoresistant glioma cells to the therapy. We decided to generate aCTL resistant glioma cell models for study using in vitro immunoselection (Gomez et al, 2006). Immunoselective pressure was applied with multiple aCTL populations to 13-06-MG glioma cells obtained from a patient at initial diagnosis. Two glioma cell clones, 13-06-IR29 and 13-06-IR30, were isolated from continuously immunoselected 13-06-MG cell populations. The immunoselected clones resisted aCTL lysis in the absence of immunoselection and expressed HLA class I antigens (Gomez and Kruse, 2007). Cytogenetic anomalies were identified that were associated with the IR phenotype (Gomez et al, 2006). Here we present data to expand the characterization of the IR clones. After observing an inhibition in apoptosis induction in the IR clones, we performed pathway specific cDNA array analysis to detect gene expression changes of apoptosis-related genes between aCTL sensitive cells (13-06-MG) and the two IR clones. To our knowledge this is the first study to link apoptosis gene expression changes in primary glioma cells with resistance to HLA-restricted CTL-induced apoptotic cell death. Our findings may have implications for other cellular immune therapy strategies.
II. Materials and methods
A. Human glioma and aCTL cell culture
The parental 13-06-MG glioma cells, and related in vitro aCTL-immunoselected glioma cell clones, 13-06-IR29 and 13-06-IR30, were all maintained in RPMI-1640 (Mediatech, Herdon, VA) containing 10% fetal bovine serum (FBS, Gemini-Bioproducts, Woodland, CA). Sensitization and expansion of aCTL occurred as previously described (Read et al, 2003; Gomez et al, 2006). The ability of the aCTL to induce glioma cell injury was always tested between 14 to 28 days after their initial sensitization.
B. Quantitative cell morphologic assay to determine apoptosis
Cell morphology studies were performed to discern apoptotic figures in hematoxylin and eosin (H&E) stained glioma cells after a 4 hr coincubation with aCTL (Gomez et al, 2004). Briefly, parental or IR cells (1 × 10⁴) were plated onto sterile Lab-Tek 4-well glass chamber slides (Nalge Nunc International, Naperville, IL) for 48 hr, a period of time in which cell doublings were not likely to occur (Gomez et al, 2006), prior to the addition of aCTL (2.5 × 10⁵). The mixtures were incubated in 5% CO2 in a 37°C humidified chamber for 4 hr. After removal of the medium, the chambers were rinsed with phosphate buffered saline (PBS) before the cells were fixed in 10% phosphate buffered formalin for 30 min before H&E staining. Glioma cell nuclear morphology was examined with a 60X objective by light microscopy. In two independent experiments, a minimum of 800 glioma cells of each type were examined and segregated into groups identified as live, apoptotic, or mitotic.
C. Detection of glioma cell injury using 7-amino actinomycin D (7AAD)
Detection of glioma cell injury by 7AAD uptake was performed as described (Gomez et al, 2004). Briefly, glioma cells (1 × 10⁵) were plated into 6 well plates for 48 hr and then labeled with 0.25 μM carboxyfluorescein diacetate succinimidyl ester (CFSE) in PBS following manufacturer instructions (Molecular Probes, Eugene, OR). aCTL were added to the wells at a 10:1 E:T ratio for 4 hr at 5% CO2 in a 37°C humidified chamber. The cells in suspension were collected and the adherent cells were harvested by treatment with 0.1% trypsin. The adherent cells were then combined with the nonadherent cells. After centrifugation, 100 μl of 7AAD (20 μg/ml) in PBS was incubated with the cells for 20 min at 4°C. Regions were drawn around the populations having negative (live cells), bright (dead cells) or dim (apoptotic) 7AAD fluorescence. Using annexin-V staining, we previously confirmed that the majority of cells within the apoptotic region expressed phosphatidylserine, the early apoptotic marker (Gomez et al, 2004). The percentages of glioma cells within the segregated live, apoptotic, and late apoptotic/necrotic populations were determined.
D. Total RNA isolation and purification
Total RNA was isolated using the AquaPure RNA Isolation Kit (Bio-Rad Laboratories, Hercules, CA) according to manufacturer instructions. Glioma cells of similar passage number were seeded into 75 cm2 flasks and allowed to expand 3-5 days prior to RNA isolation. Yield of total RNA from the cultures was approximately 10 μg/106 cells. RNA purity was determined from the ratio of absorbance at 260 and 280 nm. To increase RNA purity, if needed, a final concentration of 0.3 M sodium acetate and 2.5 vol of absolute ethanol were added to RNA samples for 30 min at -20°C. Samples were centrifuged for 15 min at 13,000 g, the pellets washed in 70% ice-cold ethanol and allowed to air dry at room temperature for 15 min prior to rehydration. Treatment of samples with sodium acetate yielded high purity RNA (260/280 ratio > 1.8). Aliquots of 1 μg of RNA from each sample were separated on 1.2% agarose gels to examine RNA integrity. RNA was stored at -80°C.
E. cDNA gene expression microarray analysis
The gene expression profiles of parental and IR glioma cells were analyzed using the GEArray Q Series Human Apoptosis Gene Arrays (SuperArray Bioscience Corp., Frederick, MD). The nylon-based arrays contain 96 apoptosis-related gene specific cDNA fragments as well as 4 housekeeping genes for normalization of the data. For each array, 5 μg of total RNA was reverse transcribed and the resulting cDNA probes amplified (GeneAmp PCR System 9700, Applied Biosystems, Foster City, CA) according to manufacturer instructions. Prior to hybridization, biotin-labeling efficiency of the probes was determined according to manufacturer instructions. Hybridization of the probes to the membranes was detected by chemiluminescence and the hybridization signals captured on X-ray film. The X-ray images were scanned and converted to grayscale TIF files. Hybridization signals were converted into raw numerical data using the ScanAlyze software program (developed by Dr. Michael Eisen, http://rana.lbl.gov/EisenSoftware.htm). All raw intensity signals were corrected for background by subtracting the minimum value of the data set and normalized to the housekeeping gene RPL13A (ribosomal protein L13A). Gene expression changes between the gliomas were determined with the GEArray Analyzer software program. Additionally, normalized data from three separate microarrays, each performed with separate cell extracts, were analyzed with the Prism statistics program (Graphpad Software Inc., San Diego, CA) by 2-way ANOVA. Bonferroni posttests were performed to compare the parental cells to the immunoresistant clones and determine which genes were significantly different.
F. Immunoblotting and densitometry
Adherent glioma cells of similar passage number to those used for RNA extraction were harvested and snap frozen before homogenization. Samples were homogenized in a modified RIPA buffer containing 100 mM Tris at pH 7.5, 1 mM EDTA, 150 mM NaCl, 1% deoxycholic acid, 1% Triton X-100, 0.1% sodium dodecyl sulfate (SDS), 2 mM phenylmethylsulphonylfluoride, 500 mM NaF, 1 mM vanadate and a half tablet of protease inhibitor cocktail (Roche Diagnostics, Mannheim, Germany). The total amount of protein isolated was determined using the BCA protein assay reagent (Pierce, Rockford, IL) according to manufacturer instructions. Equivalent amounts of protein (20 μg) were separated in pre-cast 10% SDS polyacrylamide gels (Invitrogen, Carlsbad, CA), except for the ATM immunoblots performed with individually-cast 6% gels, transferred to nitrocellulose membranes with a semidry transfer apparatus, and blocked in 5% milk in Tris buffered saline Tween-20 at room temperature for 30 min. Anti-human actin was purchased from Santa Cruz Biotechnology (Santa Cruz, CA). Antibodies to Apaf-1 and caspase 3 were from eBiosciences (San Diego, CA) and those to caspase 8 and ATM were from Anaspec (San Jose, CA). The primary antibodies were detected with a horseradish peroxidase (HRP)-conjugated goat anti-rabbit antibody (Santa Cruz). HRP activity was detected using the Supersignal West Pico Chemiluminescent substrate (Pierce). Apaf-1 and actin antibodies were diluted 1:3000 and 1:1500, respectively, in 5% milk and incubated with the membranes overnight at 4°C on a horizontal shaker platform.
After exposure of the X-ray film, the films were scanned and converted to grayscale TIF files. Densitometry values for the immunoblotted proteins and actin were obtained with the Image J software program. For each protein extract, the densitometry value of the analyzed protein was divided by the actin value to normalize for differences in protein loading. After normalization, the ratios obtained with the IR cell protein extracts were divided by the parental cell ratios.
III. Results
A. Detection of apoptosis in adherent glioma cells using an in vitro quantitative morphologic assay
Chromium release cytotoxicity assays were routinely used to determine the sensitivity of glioma cell clones isolated from 13-06-MG cell populations given selective pressure with aCTL (Gomez et al, 2006). These assays do not distinguish between the lysis of cells by necrotic or apoptotic pathways. However, preliminary observations indicated a predominance of apoptotic morphology. For determination of apoptotic cells, quantitative morphologic analyses of H&E stained 13-06-MG, 13-06-IR29, and 13-06-IR30 cell monolayers were performed when they were or were not cocultured with aCTL for 4 hr (25:1 E:T). Figure 1 shows the percentages of apoptotic glioma cells that displayed morphologic changes indicative of apoptosis including those with nuclear DNA condensation, fragmented nuclear DNA, and shedding of apoptotic bodies when they were or were not incubated with aCTL. The parental 13-06-MG and IR cells incubated alone had basal levels of apoptotic cells that never exceeded 5%. Upon parental cell coincubation with aCTL, nearly 50% were identified as apoptotic, whereas the IR clones were half as likely as the parental cells to apoptose in that same period.
Figure 1.
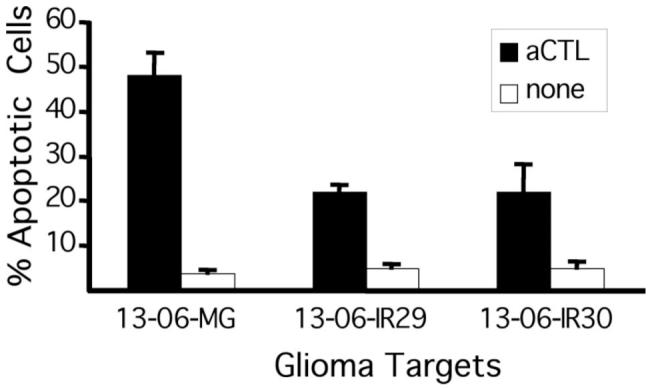
Apoptosis of parental glioma cells and IR clones, detected by an in vitro quantitative morphologic assay, increases upon their coincubation with aCTL. Monolayer cultures were washed after coincubation with aCTL at a 25:1 E:T ratio for 4 hr. After fixing, the adherent glioma cells were stained with hematoxylin and eosin. The percentages of apoptotic glioma cells ± standard deviation were determined from a total of 800 cell counts (400 cell counts/glioma cell type/experiment) taken under high-power microscopy.
B. Detection of glioma cell injury using a 7AAD flow cytometric assay
The morphologic assay has the constraint of monitoring only the adherent cells for injury. For that reason, we proceeded to perform a flow cytometric assay employing 7AAD fluorescent DNA dye uptake where the end analyses included the adherent and nonadherent glioma cells present at the end of the aCTL coincubation. Live cells exclude the dye, therefore, dye uptake is in direct proportion to membrane permeability and the degree of cell injury. Scattergrams were generated to segregate the CFSE-labeled glioma cells into live, apoptotic, and dead (necrotic/late apoptotic) cells. The scattergrams shown in Figure 2 were obtained from 13-06-MG, 13-06-IR29 and 13-06-IR30 cells alone (Figures 2A, 2C and 2E, respectively) or those incubated with aCTL (Figures 2B, 2D and 2F, respectively) for 4 hr. All of the parental and IR glioma cells coincubated with the aCTL exhibited cells with increased incorporation of 7AAD. In agreement with the results of the morphologic assays, the percentages of early apoptotic and dead (late apoptotic/necrotic) cells in the parental population (73%) was higher than that observed with both of the IR clones (49-51%) when coincubated with the same population of aCTL.
Figure 2.

Glioma cell injury, detected by 7AAD uptake, increases upon their coincubation with aCTL. Flow cytometric scattergrams are shown of CFSE-labeled 13-06-MG parental glioma cells or of IR clones that were (bottom panels) or were not (upper panels) coincubated with aCTL for 4 hr at a 10:1 E:T ratio. The cell percentages obtained for the live, apoptotic, or dead (late apoptotic/necrotic) categories are given. (A) 13-06-MG, (B) 13-06-MG + aCTL, (C) 13-06-IR29, (D) 13-06-IR29 + aCTL, (E) 13-06-IR30, (F) 13-06-IR30 + aCTL.
C. Microarray analysis of apoptosis-related genes in parental glioma cells and IR clones
The above data demonstrate that the IR clones resist apoptosis induction caused by the aCTL more so than the parental cells. The complexity of the apoptotic pathway necessarily meant that modulation of one or more of many apoptosis genes could have occurred in the IR clones. To efficiently test for apoptosis gene differences, we obtained gene expression profiles of the parental glioma cells and IR clones using apoptosis pathway-specific 96 gene cDNA arrays. From three microarray experiments run on three separate extracts of each cell type, we show representative inverted images from the first array experiment for the parental and IR clones in Figure 3a. The data show that differential apoptosis gene expression patterns exist between the parental and the IR cells. Relative to the parental cells, clone 13-06-IR29 had 41 genes with a 2-fold or greater change in expression, and clone 13-06-IR30 had 26 differentially expressed genes. In Figure 3b a list of 17 genes is displayed with 2-fold or greater changes in expression that were in common to both clones. Interestingly, the gene expression changes for 13-06-IR29 (black bars) and 13-06-IR30 (white bars) were all downregulations. Compared to the parental cells, Apaf-1, a key member of the apoptosome complex, was not detected in clone 13-06-IR30 and was decreased approximately 20-fold in 13-06-IR29. The Bfl-1 gene was below detection level in 13-06-IR29. Additional significant downregulations (≥8-fold) of ATM occurred in 13-06-IR29 and Cardiac/Rip2 occurred in 13-06-IR30. Within the concordant gene list, reduced expression of the initiator caspase, caspase 8, and the executioner caspase, caspase 3, was observed in both clones. Overall, the array data from this particular experiment provided a list of candidate genes in both IR clones that by downregulation, potentially were involved in providing resistance to injury by the aCTL.
Figure 3.

Apoptosis pathway specific microarrays of parental 13-06-MG glioma cells and related IR glioma clones, along with identification of differentially expressed apoptosis genes associated with the IR phenotype. Total RNA (5 μg) from aCTL -sensitive parental and aCTL-resistant glioma clones was isolated, reverse transcribed and the resulting cDNA hybridized to apoptosis pathway specific arrays. (a) Inverted images show hybridization signals on the apoptosis arrays from the parental and IR cDNA. The location of the negative controls and housekeeping genes (HKG) are in the two bottom rows. The apoptotic protease activating factor -1 (Apaf-1), the ataxia telangiectasia mutated (ATM), the caspase 3 and caspase 8 genes are shown in boxes at column/row positions, going left to right, for each array at 1,1; 1,3; 4,4, and 1,5). (b) Differentially expressed apoptosis associated genes in common to both IR clones at ≥ 2 fold differences compared to the parental glioma cells, as determined with the GEArray Analyzer software program. An asterisk indicates that a particular gene was not expressed.
D. Protein expressions by the parental and IR glioma cells
To determine if the downregulated gene expressions correlated with decreased protein expression, protein extracts of the glioma cells were placed onto SDS-polyacrylamide gels. After separation of the proteins on the gels and their transfer onto nitrocellulose membranes, they were immunoblotted with antibodies to Apaf-1, ATM, caspase 3, or caspase 8. The bottom bands in Figure 4 show the actin controls for each of the cell protein extracts to be similarly loaded. The bands for caspase 8, caspase 3 and ATM all appear to be downregulated in both IR clones compared to the 13-06-MG parental cells. The fold changes for caspase 8 in the 13-06-IR29 and 13-06-IR30 cells relative to the parental cells were 3.6 and 1.9, respectively; for caspase 3 the fold changes were 4.2 and 4.4, respectively, and for ATM were 11.7 and 1.3, respectively. The bands for the Apaf-1 protein show only a 1.8-fold downregulation of Apaf-1 in the 13-06-IR29 clone, but not the 13-06-IR30 clone, compared to the parental glioma cells. To confirm the Western immunoblot findings, flow cytometry of the permeabilized and fixed cells was performed with fluorescently bound Apaf-1 antibody. The parental 13-06-MG and 13-06-IR30 cells were 89% and 93% positive for Apaf-1 protein, respectively, whereas half that many (47%) of the 13-06-IR29 cells were positive for Apaf-1. Furthermore, the relative antigen densities for Apaf-1, expressed as MFIs, were consistently lower in clone 13-06-IR29 (MFI=46) relative to the parental 13-06-MG cells (MFI=76) and the 13-06-IR30 clone (MFI= 68) (data not shown). Therefore, the decreased Apaf-1 gene expression correlated with decreased protein expression in only the 13-06-IR29 clone.
Figure 4.
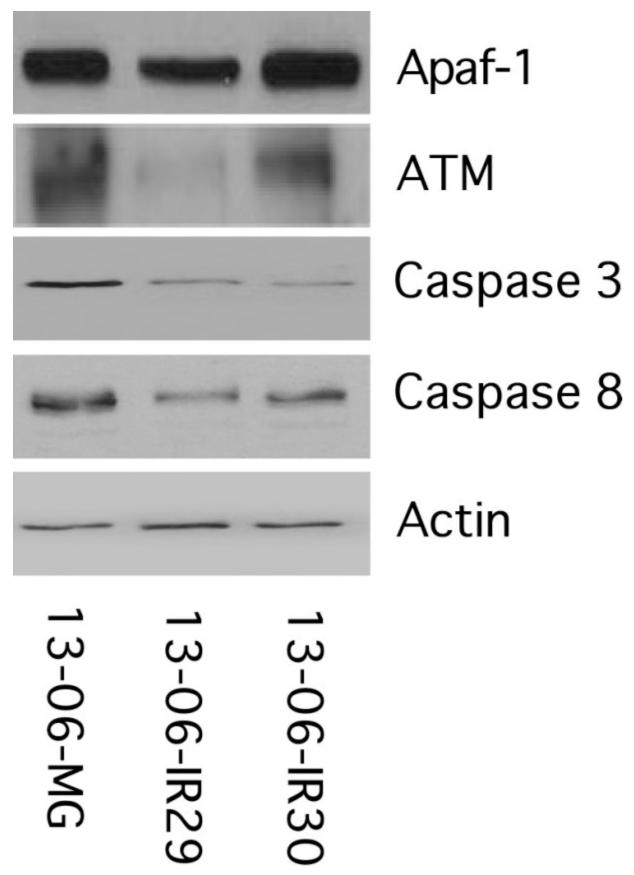
Apaf-1, ATM, caspase 3, caspase 8 and actin protein expression by immunoblotting of parental 13-06-MG glioma cells and IR clones, 13-06-IR29 and 13-06-IR30.
F. Bonferroni post-test of the microarray data
The disparate findings between the Apaf-1 mRNA and protein data and also the small 1.3 fold change obtained with the ATM protein in the 13-06-IR30 cells compared to that obtained by microarray findings suggested that sources of variability, such as sample collection, processing, hybridization, and nonspecific transcript detection by the probes may yield spurious gene expression data. To minimize the rate of false interpretations, the normalized data from the three separate microarray experiments were analyzed by 2-way ANOVA analysis and a Bonferroni post-test to compare the differential gene expression of the IR clones to the 13-06-MG parental glioma cells (Table 1). The genes that were significantly different (p<0.0001) for both IR clones were ATM, caspase 3 and caspase 8. All other factors including Apaf-1, as indicated in the separately run microarrays for the IR clones, were not statistically distinct from the parental cells.
Table 1.
Bonferroni post-test from 3 separate microarrays reveals statistically significant dowregulation of ATM, Caspases 3 and 8 in the 13-06-IR29 and 13-06-IR30 clones
| Glioma | Gene | Differencea | 95% CIb | p-valuec |
|---|---|---|---|---|
| 13-06-IR29 | ||||
| Apaf-1 | -0.076 | -0.254 to 0.103 | P > 0.05 | |
| ATM | -0.476 | -0.655 to -0.298 | P<0.001 | |
| Bfl-1 | -0.082 | -0.261 to 0.096 | P > 0.05 | |
| Caspase-3 | -0.291 | -0.469 to -0.113 | P<0.001 | |
| p53 | 0.006 | -0.173 to 0.184 | P > 0.05 | |
| TRAF3/CRAF1 | -0.047 | -0.226 to 0.131 | P > 0.05 | |
| Caspase-8 | -0.499 | -0.699 to -0.299 | P<0.001 | |
| 13-06-IR30 | ||||
| Apaf-1 | -0.114 | -0.315 to 0.087 | P > 0.05 | |
| ATM | -0.525 | -0.726 to -0.324 | P<0.001 | |
| Bfl-1 | -0.064 | -0.265 to 0.137 | P > 0.05 | |
| Caspase-3 | -0.313 | -0.514 to -0.112 | P<0.001 | |
| p53 | 0.047 | -0.154 to 0.248 | P > 0.05 | |
| TRAF3/CRAF1 | -0.018 | -0.219 to 0.183 | P > 0.05 | |
| Caspase-8 | -0.423 | -0.669 to -0.177 | P<0.001 |
Bonferroni post test difference of the means derived from three separate datasets. Differences of the means between 13-06-IR29 and parental and between 13-06-IR30 and parental datasets are given.
The 95% confidence interval (CI) for the difference between the two means. The confidence intervals adjust for multiple comparisons, such that there is 95% certainty that all the intervals contain the true difference between means.
The p-value indicates whether to accept or reject the null hypothesis that the two means for each gene are identical. The null hypothesis is rejected when the p-value is ≤ 0.05. Rejection of the null hypothesis indicates that the difference in gene expression observed is likely not due to a coincidence of random sampling but rather a significant and real difference in expression. ATM, caspases 3 and 8 were downregulated at high statistical significance (p<0.0001). These data confirm that visually seen in the Figure 3 microarray (see boxed positions for ATM, caspases 3 and 8).
IV. Discussion
We previously isolated and partially characterized two IR glioma cell clones that resisted aCTL lysis (Gomez et al, 2006). Their decreased sensitivity to aCTL lysis in chromium release assays implicated defects in apoptosis as a plausible cause for the resistance. In agreement with this rationale, we observed significantly less apoptosis in the IR clones relative to the parental cells after coincubation with aCTL in morphologic and 7AAD assays (Figures 1 and 2). To identify genes that might be involved in the apoptosis resistance, apoptosis pathway specific microarray analyses were performed (Figure 3).
Among the differentially expressed apoptosis genes, downregulated Apaf-1 mRNA expression initially appeared to correlate with glioma cell sensitivity to aCTL-induced cell death in both IR clones. This finding was of interest since we previously observed a relative gain of chromosome 12, chromosomal location of the Apaf-1 gene (Fujimoto et al, 2004), in the parental cells, compared to no gain or loss in the IR clones (Gomez et al, 2006). Others also found that Apaf-1 mediated apoptosis (Zou et al, 1997; Cain et al, 2002) and CNS responses to cytotoxic agents (Yoshida et al, 1998). The finding that 86% of primary glioblastomas exhibited loss of heterozygosity at the Apaf-1 locus, 12q22-23, suggested that abrogation of Apaf-1 mediated apoptosis was involved in the pathogenesis of gliomas (Watanabe et al, 2003). Immunblotting and flow cytometric analysis for Apaf-1 protein demonstrated that the protein downregulation only existed in clone 13-06-IR29. At the protein level, Apaf-1 expression was similar in parental and 13-06-IR30 cells. Although in depth studies on the stability of the Apaf-1 mRNA have not been conducted, evidence in the literature suggests that the Apaf-1 mRNA contains an internal ribosome entry site (IRES) that maintains constant cellular Apaf-1 protein levels, even under conditions where cap-dependent translation is compromised (Coldwell et al, 2000). It has also been demonstrated that the activity of the IRES in different cell lines depends upon the level of polypyrimidine tract binding (PTB) upstream of N-ras (unr) proteins (Mitchell et al, 2001). In addition, Apaf-1 mRNA and protein levels are positively regulated by p53 and the E2F1 transcription factor (Moroni et al, 2001). Collectively, the differential expression of these Apaf-1 regulating factors may account for the discrepancy between the microarray and western blot results. In addition, the low dynamic range of detection likely accounts for the relatively high false discovery and false negative rate percentages associated with microarrays (Tibshirani R, 2006), which can be as high as 5%, meaning that approximately 5 genes in the 96 gene array would be incorrectly identified as being differentially regulated in our experiments.
Application of a two-way ANOVA analysis and a Bonferroni post-test on the datasets obtained from three independent microarray experiments revealed a significant and consistent downregulation of ATM, caspases 3 and 8 in both IR clones. We validated the downregulation of ATM at the protein level in both IR clones. Clone 13-06-IR30 revealed a 1.3 fold decrease of ATM levels relative to the parental cells while clone 13-06-IR29 demonstrated a 12-fold decrease of ATM. The mutated AT gene (ATM) gives rise to the ATM protein that is required for activating DNA repair proteins, cell cycle arrest and apoptosis in response to DNA damage (Khanna et al, 2001). Low ATM levels in low passage primary glioma cell explants renders the glioma cells highly sensitive to radiation-induced cell death (Tribius et al, 2001). Predicated upon this and another study (Guha et al, 2000), one might predict that lowered ATM expression would render the IR clones more susceptible to aCTL damage. However, more established glioma cell lines display lowered ATM levels yet remain radioresistant (Tribius etal, 2001). In addition, the role of ATM in facilitating CTL-induced target cell apoptosis is not known. It is likely that downmodulation of ATM in the IR clones serves to protect them from the initiation of apoptosis in response to the DNA damage exerted by effector cytolytic T cell proteins such as granzyme-B (Thomas et al, 2000).
Caspases are central mediators of apoptosis induced by multiple cytotoxic agents. Remarkably downregulation of caspases 3 and 8 were consistently observed in both IR clones by microarray and in immunoblot experiments. It is also of interest that the cytogenetic characterization of the IR clones revealed that greater than 60% of the IR cells analyzed for both clones displayed a loss of chromosome 2q and 4, the locations of the caspase-8 and -3 genes, respectively, compared to no loss in the parental cells (Gomez et al, 2006). The relative loss of chromosome 12, the location of Apaf-1, observed in the IR clones was not as dramatic as the chromosome 2q and 4 losses and may help explain why Apaf-1 was not downregulated in clone 13-06-IR30. Decreased caspase 3 and 8 expressions also may account for the display of the IR clones cross-resistance to other effector cells, lymphokine activated killer and TALL-104 cells, and to radiation-induced cell death (Gomez and Kruse, 2007). Other reports demonstrate that caspase-8 expression is silenced in gliomas and that caspase-8 gene silencing renders glioma cells resistant to apoptosis induced by TRAIL, anti-CD95 antibody and TNF-α (Fulda et al, 2001; Eramo et al, 2005; Li et al, 2006). In addition, genomic loss of chromosome 2q (caspase-8) and 4 (caspase-3) was associated with resistance to TRAIL-induced cell death in glioma cell lines and primary glioma cultures (Li et al, 2006). It is interesting to note that granzyme B, a component of cytotoxic T lymphocyte granules, induces target cell apoptosis through the cleavage of procaspase-3 and -8 (Thomas et al, 2000). Perhaps the downregulation of caspases-3 and -8 in the IR clones renders them relatively insensitive to granzyme-B induced cell death. In support of this hypothesis, we found that the aCTL lyse the immunosensitive parental glioma cell targets primarily through the granule-exocytosis pathway (Gomez and Kruse, 2007) while the lysis of the IR clones by this pathway is significantly inhibited.
In summary, the contribution of the genes implicated in the IR phenotype identified in this study would need to be further explored. It would be important to transduce each of these factors (ATM, caspases 3 and 8) back into the IR clones followed by cytotoxicity experiments to definitively confirm whether each individual factor plays a role in contributing to the observed immunoresistance. Alternatively, knockdown of the specific factors with siRNA might be performed with the IS clone followed by cytotoxicity experiments to help distinguish each individual factor’s role in providing immunoresistance or immunosensitivity to aCTL. Should one or all of these factors appear to play a role in IR glioma cells, appropriate technology could be developed to target immunoresistant tumor cells remaining following immunotherapy (Gomez and Kruse, 2006). Additionally, isolation and analysis of IR glioma cell clones derived from other glioma cell explants given selective pressure with aCTL may help to identify other factor(s) that might be universally involved in the IR phenotype. The development of more IR glioma cell models as tools to understand the mechanism(s) of IR may prove useful for the diagnosis, prognosis, and therapy of brain tumors.
Acknowledgments
This work was partially supported by National Institutes of Health grants F31 CA94834 to GGG, NS046463, NS056300, CA121258, NS054093 to CAK, and the R. Herbert & Alma S. Manweiler Memorial Research Fund. GGG performed some of the experimental work in partial fulfillment of his doctoral dissertation work for the Experimental Pathology Program at the University of Colorado Health Sciences Center, Denver, CO. Chiron, Inc. supplied the IL-2 for these studies. We thank Dr. L.E. Gerschenson for critical review of the manuscript.
Abbreviations
- (7AAD)
7-amino actinomycin D
- (aCTL)
alloreactive cytotoxic T lymphocytes
- (Apaf-1)
apoptotic protease-activating factor-1
- (ATM)
ataxia telangiectasia mutated
- (CFSE)
carboxyfluorescein diacetate succinimidyl ester
- (FBS)
fetal bovine se rum
- (H&E)
hematoxylin and eosin
- (HLA)
human leukocyte antigens
- (IR)
Immunoresistant
- (MF I)
mean fluorescence intensities
- (PBS)
phosphate buffered saline
- (SDS)
sodium dodecyl sulfate
References
- Baxevanis CN, Reclos GJ, Gritzapis AD, Dedousis GV, Missitzis I, Papamichail M. Elevated prostaglandin E2 production by monocytes is responsible for the depressed levels of natural killer and lymphokine-activated killer cell function in patients with breast cancer. Cancer. 1993;72:491–501. doi: 10.1002/1097-0142(19930715)72:2<491::aid-cncr2820720227>3.0.co;2-1. [DOI] [PubMed] [Google Scholar]
- Cain K, Bratton SB, Cohen GM. The Apaf-1 apoptosome: a large caspase-activating complex. Biochimie. 2002;84:203–14. doi: 10.1016/s0300-9084(02)01376-7. [DOI] [PubMed] [Google Scholar]
- Coldwell MJ, Mitchell SA, Stoneley M, MacFarlane M, Willis AE. Initiation of Apaf-1 translation by internal ibosome entry. Oncogene. 2000;19:899–905. doi: 10.1038/sj.onc.1203407. [DOI] [PubMed] [Google Scholar]
- Eramo A, Pallini R, Lotti F, Sette G, Patti M, Bartucci M, Ricci-Vitiani L, Signore M, Stassi G, Larocca LM, Crinò L, Peschle C, De Maria R. Inhibition of DNA methylation sensitizes glioblastoma for tumor necrosis factor-related apoptosis-inducing ligand-mediated destruction. Cancer Res. 2005;65:11469–77. doi: 10.1158/0008-5472.CAN-05-1724. [DOI] [PubMed] [Google Scholar]
- Fakhrai H, Dorigo O, Shawler DL, Lin H, Mercola D, Black KL, Royston I, Sobol RE. Eradication of established intracranial rat gliomas by transforming growth factor beta antisense gene therapy. Proc Natl Acad Sci USA. 1996;93:2909–14. doi: 10.1073/pnas.93.7.2909. [DOI] [PMC free article] [PubMed] [Google Scholar]
- Fleshner M, Watkins LR, Redd JM, Kruse CA, Bellgrau D. A 9L gliosarcoma transplantation model for studying adoptive immunotherapy into the brains of conscious rats. Cell Transpl. 1992;1:307–12. doi: 10.1177/096368979200100408. [DOI] [PubMed] [Google Scholar]
- Fujimoto A, Takeuchi H, Taback B, Hsueh EC, Elashoff D, Morton DL, Hoon DS. Allelic imbalance of 12q22-23 associated with APAF-1 locus correlates with poor disease outcome in cutaneous melanoma. Cancer Res. 2004;64:2245–50. doi: 10.1158/0008-5472.can-03-2932. [DOI] [PubMed] [Google Scholar]
- Fulda S, Küfer MU, Meyer E, van Valen F, Dockhorn-Dworniczak B, Debatin KM. Sensitization for death receptor-or drug-induced apoptosis by re-expression of caspase-8 through demethylation or gene transfer. Oncogene. 2001;20:5865–77. doi: 10.1038/sj.onc.1204750. [DOI] [PubMed] [Google Scholar]
- Gomez GG, Kruse CA. Mechanisms of malignant glioma immune resistance and sources of immunosuppression. Gene Ther Mol Biol. 2006;10:133–146. [PMC free article] [PubMed] [Google Scholar]
- Gomez GG, Kruse CA. Cellular and functional characterization of immunoresistant human glioma cell clones selected with alloreactive cytotoxic T lymphocytes reveals their up-regulated synthesis of biologically active TGF-β. J Immunother. 2007;30:261–273. doi: 10.1097/01.cji.0000211339.81211.25. [DOI] [PMC free article] [PubMed] [Google Scholar]
- Gomez GG, Read SB, Gerschenson LE, Santoli D, Zweifach A, Kruse CA. Interactions of the allogeneic effector leukemic T cell line, TALL-104, with human malignant brain tumors. Neuro-Oncol. 2004;6:83–95. doi: 10.1215/S1152851703000140. [DOI] [PMC free article] [PubMed] [Google Scholar]
- Gomez GG, Varella-Garcia M, Kruse CA. Isolation of immunoresistant human glioma cell clones after selection with alloreactive cytotoxic T lymphocytes: cytogenetic and molecular cytogenetic characterization. Cancer Genet Cytogenet. 2006;165:121–134. doi: 10.1016/j.cancergencyto.2005.08.009. [DOI] [PMC free article] [PubMed] [Google Scholar]
- Guha C, Guha U, Tribius S, Alfieri A, Casper D, Chakravarty P, Mellado W, Pandita TK, Vikram B. Antisense ATM gene therapy: a strategy to increase the radiosensitivity of human tumors. Gene Ther. 2000;7:852–8. doi: 10.1038/sj.gt.3301174. [DOI] [PubMed] [Google Scholar]
- Khanna KK, Lavin MF, Jackson SP, Mulhern TD. ATM, a central controller of cellular responses to DNA damage. Cell Death Differ. 2001;8:1052–65. doi: 10.1038/sj.cdd.4400874. [DOI] [PubMed] [Google Scholar]
- Kruse CA, Beck LT. Artificial-capillary-system development of human alloreactive cytotoxic T-lymphocytes that lyse brain tumours. Biotech Appl Biochem. 1997;25:197–205. [PubMed] [Google Scholar]
- Kruse CA, Cepeda L, Owens B, Johnson SD, Stears J, Lillehei KO. Treatment of recurrent glioma with intracavitary alloreactive cytotoxic T lymphocytes and interleukin-2. Cancer Immunol Immunother. 1997;45:77–87. doi: 10.1007/s002620050405. [DOI] [PMC free article] [PubMed] [Google Scholar]
- Kruse CA, Lillehei KO, Mitchell DH, Kleinschmidt-DeMasters B, Bellgrau D. Analysis of interleukin 2 and various effector cell populations in adoptive immunotherapy of 9L rat gliosarcoma: allogeneic cytotoxic T lymphocytes prevent tumor take. Proc Natl Acad Sci USA. 1990;87:9577–81. doi: 10.1073/pnas.87.24.9577. [DOI] [PMC free article] [PubMed] [Google Scholar]
- Kruse CA, Merchant RE. Cellular Therapy of Brain Tumors - Clinical Trials. In: Kornblith PL, Walker MD, editors. Advances in Neuro-Oncology II. Futura Pub Co; Armonk, N.Y: 1997. pp. 487–504. [Google Scholar]
- Kruse CA, Rubinstein D. Cytotoxic T-lymphocytes reactive to patient major histocompatibility complex proteins for therapy of brain tumors. In: B. D. Liau LM, Cloughesy TF, Bigner DD, editors. Brain Tumor Immunotherapy. Humana Press; Totowa, N.J: 2001. pp. 149–170. [Google Scholar]
- Kruse CA, Schiltz PM, Bellgrau D, Kong Q, Kleinschmidt-DeMasters BK. Intracranial administrations of single or multiple source allogeneic cytotoxic T lymphocytes: chronic therapy for primary brain tumors. J Neuro-Oncol. 1994;19:161–8. doi: 10.1007/BF01306458. [DOI] [PubMed] [Google Scholar]
- Lampson LA, Hickey WF. Monoclonal antibody analysis of MHC expression in human brain biopsies: tissue ranging from “histologically normal” to that showing different levels of glial tumor involvement. J Immunol. 1986;136:4054–62. [PubMed] [Google Scholar]
- Li YC, Tzeng CC, Song JH, Tsia FJ, Hsieh LJ, Liao SJ, Tsai CH, Van Meir EG, Hao C, Lin CC. Genomic alterations in human malignant glioma cells associate with the cell resistance to the combination treatment with tumor necrosis factor-related apoptosis-inducing ligand and chemotherapy. Clin Cancer Res. 2006;12:2716–29. doi: 10.1158/1078-0432.CCR-05-1980. [DOI] [PubMed] [Google Scholar]
- Liau LM, Prins RM, Kiertscher SM, Odesa SK, Kremen TJ, Giovannone AJ, Lin JW, Chute DJ, Mischel PS, Cloughesy TF, Roth MD. Dendritic cell vaccination in glioblastoma patients induces systemic and intracranial T- cell responses modulated by the local central nervous system tumor microenvironment. Clin Cancer Res. 2005;11:5515–25. doi: 10.1158/1078-0432.CCR-05-0464. [DOI] [PubMed] [Google Scholar]
- Mitchell SA, Brown EC, Coldwell MJ, Jackson RJ, Willis AE. Protein Factor Requirements of the Apaf-1 Internal Ribosome Entry Segment: Roles of Polypyrimidine Tract Binding Protein and upstream of N-ras. Mol Cellular Biology. 2001;21:3364–74. doi: 10.1128/MCB.21.10.3364-3374.2001. [DOI] [PMC free article] [PubMed] [Google Scholar]
- Moroni MC, Hickman ES, Denchi EL, Caprara G, Colli E, Cecconi F, Muller H, Helin K. Apaf-1 is a transcriptional target for E2F and p53. Nature Cell Biology. 2001;3:552–8. doi: 10.1038/35078527. [DOI] [PubMed] [Google Scholar]
- Plautz GE, Miller DW, Barnett GH, Stevens GH, Maffett S, Kim J, Cohen PA, Shu S. T cell adoptive immunotherapy of newly diagnosed gliomas. Clin Cancer Res. 2000;6:2209–18. [PubMed] [Google Scholar]
- Quattrocchi KB, Miller CH, Cush S, Bernard SA, Dull ST, Smith M, Gudeman S, Varia MA. Pilot study of local autologous tumor infiltrating lymphocytes for the treatment of recurrent malignant gliomas. J Neuro-Oncol. 1999;45:141–57. doi: 10.1023/a:1006293606710. [DOI] [PubMed] [Google Scholar]
- Read SB, Kulprathipanja NV, Gomez GG, Paul DB, Winston KR, Robbins JM, Kruse CA. Human alloreactive CTL interactions with gliomas and with those having upregulated HLA expression from exogenous IFN-gamma or IFN-gamma gene modification. J Int Cyt Res. 2003;23:379–93. doi: 10.1089/107999003322226032. [DOI] [PubMed] [Google Scholar]
- Redd JM, Lagarde AC, Kruse CA, Bellgrau D. Allogeneic tumor-specific cytotoxic T lymphocytes. Cancer Immunol Immunother. 1992;34:349–54. doi: 10.1007/BF01741557. [DOI] [PMC free article] [PubMed] [Google Scholar]
- Stupp R, Mason WP, van den Bent MJ, Weller M, Fisher B, Taphoorn MJ, Belanger K, Brandes AA, Marosi C, Bogdahn U, Curschmann J, Janzer RC, Ludwin SK, Gorlia T, Allgeier A, Lacombe D, Cairncross JG, Eisenhauer E, Mirimanoff RO, European Organisation for Research and Treatment of Cancer Brain Tumor and Radiotherapy Groups. National Cancer Institute of Canada Clinical Trials Group Radiotherapy plus concomitant and adjuvant temozolomide or glioblastoma. N Engl J Med. 2005;352:987–96. doi: 10.1056/NEJMoa043330. [DOI] [PubMed] [Google Scholar]
- Thomas DA, Du C, Xu M, Wang X, Ley TJ. DFF45/ICAD can be directly processed by granzyme B during the induction of apoptosis. Immunity. 2000;12:621–32. doi: 10.1016/s1074-7613(00)80213-7. [DOI] [PubMed] [Google Scholar]
- Tibshirani R. A simple method for assessing sample sizes in microarray experiments. BMC Bioinformatics. 2006;7:106. doi: 10.1186/1471-2105-7-106. [DOI] [PMC free article] [PubMed] [Google Scholar]
- Tribius S, Pidel A, Casper D. ATM protein expression correlates with radioresistance in primary glioblastoma cells in culture. Int J Radiat Oncol Biol Phys. 2001;50:511–23. doi: 10.1016/s0360-3016(01)01489-4. [DOI] [PubMed] [Google Scholar]
- Virasch N, Kruse CA. Strategies using the immune system for therapy of brain tumors. Hematol Oncol Clin No Am. 2001;15:1053–71. doi: 10.1016/s0889-8588(05)70267-7. [DOI] [PubMed] [Google Scholar]
- Walker PR, Saas P, Dietrich PY. Role of Fas ligand (CD95L) in immune escape: the tumor cell strikes back. J Immunol. 1997;158:4521–4. [PubMed] [Google Scholar]
- Watanabe T, Hirota Y, Arakawa Y, Fujisawa H, Tachibana O, Hasegawa M, Yamashita J, Hayashi Y. Frequent LOH at chromosome 12q22-23 and Apaf-1 inactivation in glioblastoma. Br Pathol. 2003;13:431–9. doi: 10.1111/j.1750-3639.2003.tb00474.x. [DOI] [PMC free article] [PubMed] [Google Scholar]
- Yoshida H, Kong YY, Yoshida R, Elia AJ, Hakem A, Hakem R, Penninger JM, Mak TW. Apaf1 is required for mitochondrial pathways of apoptosis and brain development. Cell. 1998;94:739–50. doi: 10.1016/s0092-8674(00)81733-x. [DOI] [PubMed] [Google Scholar]
- Zou H, Henzel WJ, Liu X, Lutschg A, Wang X. Apaf-1, a human protein homologous to C. elegans CED-4, participates in cytochrome c-dependent activation of caspase-3. Cell. 1997;90:405–13. doi: 10.1016/s0092-8674(00)80501-2. [DOI] [PubMed] [Google Scholar]