Abstract
To optimize 19F MR tracking of stem cells, we compared cellular internalization of cationic and anionic perfluoro-15-crown-5-ether (PFCE) nanoparticles using cell culture plates with different surface coatings. The viability and proliferation of anionic and cationic PFCE-labeled neural stem cells (NSCs) did not differ from unlabeled cells. Cationic PFCE nanoparticles (19F T1/T2= 580/536 ms at 9.4T) were superior to anionic particles for intracellular fluorination. Best results were obtained with modified polystyrene culture dishes coated with both carboxylic and amino groups rather than conventional carboxyl-coated dishes. After injecting PFCE-labeled NSCs into the striatum of mouse brain, cells were readily identified in vivo by 19F MRI without changes in signal or viability over a 2-week period post-grafting. These results demonstrate that neural stem cells can be efficiently fluorinated with cationic PFCE nanoparticles without using transfection agents and visualized in vivo over prolonged periods with an MR sensitivity of approximately 140 pmol of PFCE/cell.
Keywords: Stem cell, transplantation, cell tracking, fluorine imaging, nanoparticle
Introduction
Magnetic resonance imaging (MRI) allows visualization of labeled cells in vivo in real time, providing new insights into the biodynamics of cell trafficking and migration. This technique has been used to track the efficacy of stem cell therapy, primarily with using cells labeled with (super)paramagnetic metal contrast agents (1,2). Recently, fluorine labeling has emerged as an alternative method for MRI cell tracking (3–6). With either method, cells are incubated with the contrast agent in vitro in order to pre-label cells before administration.
While still in its infancy, 19F MRI cell tracking may offer some unique advantages that have generated considerable interest. There is, in principle, no barrier to the use of perfluorocarbons in clinical applications. Fluorine emulsions of perfluorocarbons, and, specifically, the perfluoro-15-crown-5-ether (PFCE), has been used in many other applications, such as the measurement of the partial pressure of oxygen in tissue (7,8). Among the advantages of 19F-NMR is the fact that 19F is 100% naturally abundant, its NMR sensitivity is comparable to that of protons (around 0.86), and there is a negligible 19F background signal, thus enabling “hot spot” MR imaging in an analogous fashion as nuclear medicine applications (9). In PFCE, there are a large number of chemically equal fluorine atoms present, resulting in a 19F spectrum with a single narrow resonance (avoiding chemical shift artifacts), thus making it an ideal 19F tracer for cellular 19F MR imaging.
So far, few studies on cellular 19F pre-labeling in vitro have been reported. In order to induce sufficient intracellular uptake, PFPE emulsions can be mixed with transfection agents. i.e. lipofectamine (4) or FuGENE (6). In this study, we have investigated the labeling effectiveness of PFCE nanoparticles with different surface charges without the use of transfection agents. In addition, we evaluated the potential interference of coated (charged) cell culture plates, that compete with cells for charged nanoparticle binding. It is shown that the surface charge of both the nanoparticles and cell culture plates play an important role in determining the efficacy of label uptake. We further show that PFCE-labeled neural stem cells (NSCs) retain PFCE nanoparticles for at least 2 weeks following intrastriatal transplantation, allowing sustained “hot spot” MR imaging of their cellular distribution in vivo.
Materials and Methods
19 F nanoparticle formulations
Two different perfluorocarbon nanoparticles were synthesized. Nanoparticle preparations were prepared by microfluidization as previously descibed (10). The nanoparticle emulsions comprised 20% (v/v) perfluoro-15-crown-5 ether (PFCE, Exfluor Research, TX), 2.0% (w/v) of a surfactant co-mixture, 1.7% (w/v) glycerin, and water for the balance. The surfactant co-mixture for the cationic rhodamine nanoparticles included 0.1 mole% rhodamine-phosphatidylethanolamine, 15 mole% phosphatidylcholine (PC), 5 mole% cholesterol, 59.9 mole% 1,2-dioleoyl-3-trimethylammonium propane (DOTAP), and 20 mole% 1,2-dioleoylphosphatidylphosphoethanolamine (DOPE). For anionic rhodamine nanoparticles, the surfactant co-mixture included 0.1 mole% rhodamine-phosphatidylethanolamine, 15 mole% PC, 5 mole% cholesterol, 59.9 mole% dipalmitoyl phosphatidylserine, and 20 mole% DOPE. Nanoparticle size and zeta potential measurements were determined using a Brookhaven ZetaPALS with 90Plus/BI-MAS particle sizing option (Brookhaven Intruments Corporation, Holtsville, NY).
Stem cell culture and labeling
Neural stem cell labeling experiments were performed with LacZ-transfected (β-galactosidase+) C17.2 mouse NSCs (11,12) (courtesy of Drs. E.Y. Snyder and J.H. Wolfe). C17.2 cells were cultured in standard culture media (DMEM, 10% FCS, 5% horse serum, supplemented with 1% L-glutamine and 1.85 g/L sodium bicarbonate), either in conventional polystyrene cell 10 cm diameter round culture dishes having a carboxylic acid coating (Cat #353003 standard tissue-culture treated BD Biosciences, Rockville, MD), or in 10 cm diameter round modified dishes coated with both carboxylic acid and amino groups (Cat #353803 “Primaria”, BD Biosciences, Rockville, MD). The effect of two different culture plate surface coatings was investigated for optimal cell labeling, that is, optimal cell adherence to the culture plates (as assessed by cell counting using a hemocytometer) and optimal intracellular fluorination of cells (as assessed by visual inspection of labeled cells vs. non-specific sticking of free PFCE nanoparticles to the differentially charged culture plates). Cells were grown until 50%–70% confluence (approximately 5×10⁶ C17.2 cells per plate) before labeling.
For cell labeling, 4 or 8 μL of either nanoparticle formulation was added per mL of culture medium (corresponding to 2.4 or 4.8 mM final PFCE concentration). The diluted nanoparticle cell culture medium was dispersed just before by 5 min sonication using a digital sonifier (S450D; Branson Ultrasonics Corp., Danbury, CT) with 40% total power, and then filtered through a Corning 0.22 μm syringe filter (Corning Glass Works, Corning, NY). After PFCE-incubation, dead cells were removed by triple washing of cell culture dishes with PBS, and adherent cells were collected following trypsinization. Cells were then washed again three times with PBS to remove residual trace amounts of PFCE.
Assessment of cellular labeling, viability and proliferation
After the end of the cell incubation period, cells were washed three times with PBS and cell culture dishes were examined directly using a fluorescent microscope (see below) following fixation for 10 min with PBS containing 4% paraformaldehyde. Cell viability following labeling was assessed by trypan blue exclusion. For cell proliferation meaurements, 1×10⁴ cells were plated into 96-well plates. The metabolic assimilation rate was determined using a 3-(4,5-dimethylthiazol-2-yl)-5-(3-carboxymethoxyphenyl)-2-(4-sulfophenyl)-2H-tetrazolium (MTS) assay (Promega, Madison, WI). Cells were incubated for 4h either with cationic or anionic nanoparticles (2.4 and 4.8 mM final PFCE concentration). The label medium was removed, cells were washed three times, and fresh culture medium (without label) was added. The absorbance values for the different labeling conditions were calculated as a percentage of the absorbance for unlabeled control cells. The MTS assay was done immediately after 4 hours of labeling, and at 24 hours and 48 hours post-labeling. Multi-way ANOVA was used to assess whether the cell viability was significantly different between unlabeled cells and cells with cationic or anionic nanoparticles. Statistical analysis was performed with use of the R software (R Development Core Team, 2008). Comparisons between groups were performed with a two-way ANOVA and Scheffe’s F test to determine significance using data from five independent experiments.
In vitro MRI and relaxation measurements
In order to determine the 19F MR relaxation times of cationic PFCE particles, 5 mm NMR glass tubes (New Era, Vineland, NJ) were filled with 500 μL of 60 mM PFCE particles in 4% w/v gelatin. To further determine the sensitivity of particle-bound PFCE as 19F agent, five 1 mm glass capillary tubes containing 60 μL of cationic PFCE particles (concentration range 30–60 mM PFCE in culture medium and 4% w/v gelatin) were inserted in a 5 mm NMR glass tube. The latter phantom setup was chosen as to represent the in vivo experiments (see below), mimicking small injection volumes (2–10 μL cell suspensions). For labeled cell phantoms, PFCE-labeled NSCs were suspended in 4% w/v gelatin at a density of 1×10⁶ cells/ml.
Proton and 19F MRI was performed using a 9.4 T Bruker Biospec spectrometer using multi-slice (10 × 1 mm slices, no gap), and FOV=2.5×2.5 cm for all sequences. For 1H, a spin echo (SE) sequence (TR/TE 1000/15 ms) with 128×128 matrix size, was used; for 19F, a fast spin echo sequence with TR/TE: 1080/47 ms, 64 averages, echo train length = 8, matrix=64×32 was used. For T1 acquisition, SE saturation recovery images were acquired with TE=15 ms and variable TR (100–5000 ms). T2 values were obtained using a CPMG sequence with 20 echoes, TE=50 ms, and TR=5000 ms. The 19F T1 and T2 values were calculated on a pixel-by-pixel basis using a monoexponential decay.
Neural stem cell transplantation
Animal experiments were performed in accordance to a protocol approved by our institutional Animal Care and Use Committee. PFCE-labeled NSCs were suspended in PBS at a concentration of 4×10⁴ cells/μl. Six C15/BL6 male mice (weighing 20 g) were anesthetized with ketamine/xylazine (100/15 mg/kg), and positioned in a stereotaxic device (Stoelting, Wood Dale, IL). A small skin incision was made in the midline to expose the skull. Using a motorized nanoinjector (Stoelting) and a 10 μl Hamilton syringe (Hamilton, Reno, NV) with an attached 33G needle, single or multiple doses of 4×10⁴–3×10⁵ cells were injected into the striatum according to the following coordinates: AP=0.0, ML=2.0, DV=3.0. Cells were injected slowly over 4 min, and the needle was left in place for 1 min before being withdrawn. The incision was suture-closed, and post-operative analgesia was provided with Ketofen at 5 mg/kg for 72 h.
In vivo MRI and histology
In vivo MRI of mice injected with cationic PFCE particle-labeled NSCs was performed for up two weeks after cell transplantation using a 9.4 T Bruker horizontal bore magnet. Mice were anesthetized with ketamine/acepromazine (100/5 mg/kg) to circumvent 19F background signal arising from conventional gas (isoflurane) anesthesia. Animals were immobilized in a custom-built slotted tube RF resonator (9.4 T) tunable between 1H and 19F frequencies and operating in the transmitter-receiver mode. The body temperature was maintained at 37 °C, and animals were monitored using a respiratory sensory pad (SA Instruments, Stony Brook, NY) throughout the entire experiment. Serial in vivo 1H and 19F MRI was performed up to 2 weeks after injection on a 9.4 T Bruker Biospec spectrometer (Bruker Biospin MRI, Billerica, MA, USA). 19F MR images were obtained using a multi-slice (10×1 mm slices) fast spin echo sequence with TE=47 ms; TR=1079 ms; NA=64; FOV=2.5×2.5 cm and matrix=64×32. The fluorine images were overlaid on 1H MR images obtained with a multi-slice SE sequence (TR=1000 ms, TE=15 ms, matrix=128×128, 1 mm slice thickness).
Fluorescence microscopy and immunohistochemistry
For tissue immunohistochemistry, following the last MR scan, animals were transcardially perfused with PBS containing 4% paraformaldehyde. The brains were removed, cryopreserved in 20% w/v sucrose for 24 h, and cryosectioned a 20 μm throughout the area of injection. Every two other sections were processed for fluorescence microscopy and immunohistochemistry. A mouse monoclonal antibody (#MAB16377, Chemicon, Temecula, CA, 1:500) was used as the primary antibody against beta-galactosidase (Cappel, Aurora, OH, USA), and Alexa Fluor® goat anti-mouse 488 (#A21125, Molecular Probes Inc. Eugene, OR, 1:1000) as secondary antibody. Microscopy was performed using Olympus BX51 and IX71 epifluorescence microscopes equipped with an Olympus DP-70 digital acquisition system.
Results
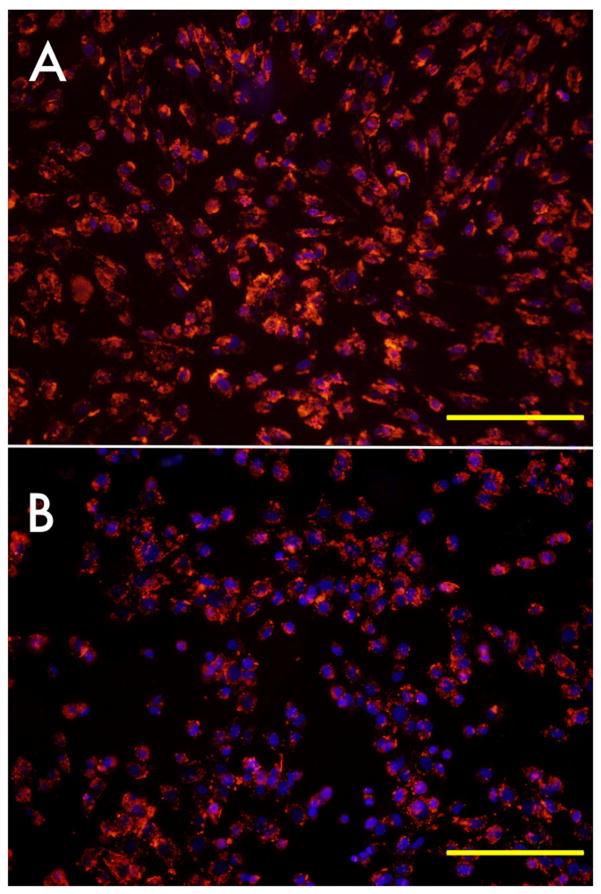
Zeta potential measurements revealed a surface charge of +62.8 mV for the cationic and -68.7 mV for the anionic nanoparticle formulations. The mean diameters/polydispersity were 158 nm/0.119 and 207 nm/0.09, respectively. Cationic nanoparticles labeled cells with high efficiency already at 4 hours of incubation (Fig. 1A). This was in contrast to the anionic nanoparticles at this early timepoint (Fig. 1B). An efficient intracellular accumulation with redistribution of label was apparent after longer incubation times (Figs. 1C, D). Optimal labeling results were always observed for plates coated with amino-carboxylic groups (Fig. 2A,B).
Figure 1.
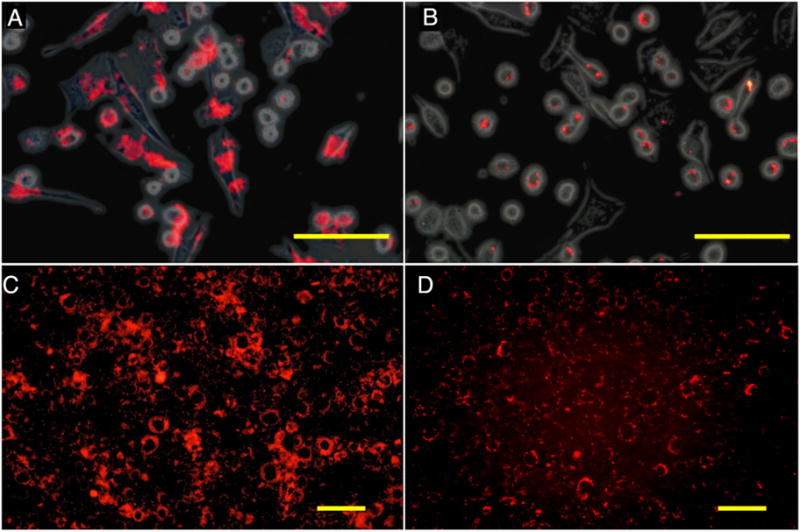
Fluorescence microscopy of cationic (A,C) and anionic (B,D) PFCE-labeled C17.2 mouse NSCs after 4 hours of incubation with 2.4 mM PFCE. (A,B) Rhodamin (red) on and phase contrast overlay image of cells immediately after 4 hours of incubation. (C,D) Rhodamin fluorescent images of cells cultured for an additional 18 hours following removal of PFCE at 4 hours of incubation. Note the transport and intracellular redistribution of label between the two time points. Size bar=100 μm in (A,B) and 50 μm in (C,D).
Figure 2.
Effect of culture dish surface treatment on cell labeling and cell adherence. (A) NSCs grown and incubated in amino-carboxylic coated dishes (red: rhodamin-PFCE; blue: DAPI/cell nuclei, overlaid with phase contrast image). (B). NSCs grown and incubated in carboxylic coated dishes. Cells were incubated with 4.8 mM PFCE for 18h. Size bar=200 μm.
Following PFCE-labeling, the proliferation of labeled C17.2 cells was not significantly different from unlabeled cells (p=0.961, 2-way ANOVA) (Fig. 3). Trypan blue staining revealed that the ratio of live:dead cells after 4–18 hours of either cationic or anionic PFCE incubation (2.4 and 4.8 mM) was >95%.
Figure 3.
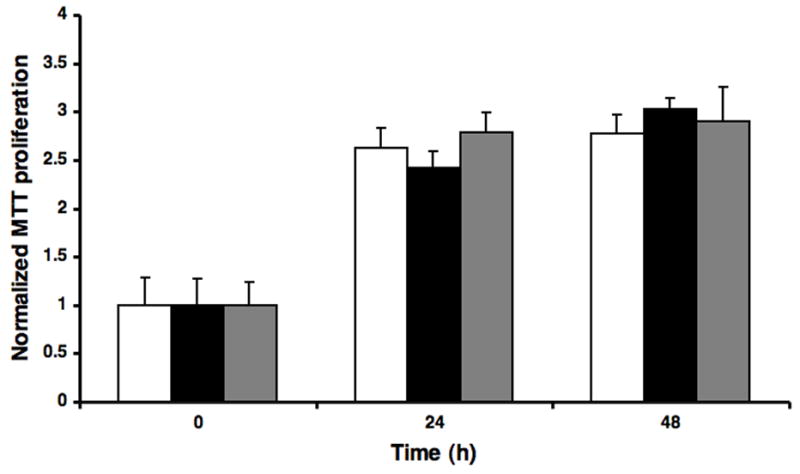
Proliferation index of PFCE-labeled C17.2 cells. Cells were incubated for 4 hours with 4.8 mM cationic (black filled bars) or anionic (gray filled bars) nanoparticles. There was no significant difference in proliferation as compared to unlabeled control cells (open bars).
Sensitivity measurements for 19F detection were made for cationic PFCE nanoparticle suspensions (Fig. 4A) and cationic PFCE particle-labeled cells (Fig. 4B). The measured relaxation times of the cationic PFCE in gelled culture medium at room temperature and 9.4 T were 580±32 (T1) and 536±5 ms (T2) ms for 30–60 mM PFCE samples (n=3). From Fig. 4A, it can be seen that, under the used conditions (i.e., a voxel of 20 μL and 8 min of acquisition time), the sensitivity of 19F detection is approximately 30 mM. For PFCE-labeled cells, incubation with anionic particles did not lead to any detectable 19F signal (Fig. 4B). In contrast, cationic particles induced signal at incubation concentrations as low as 0.6 mM.
Figure 4. In vitro 19F MR imaging and detection threshold of cationic free (unbound) PFCE nanoparticles.
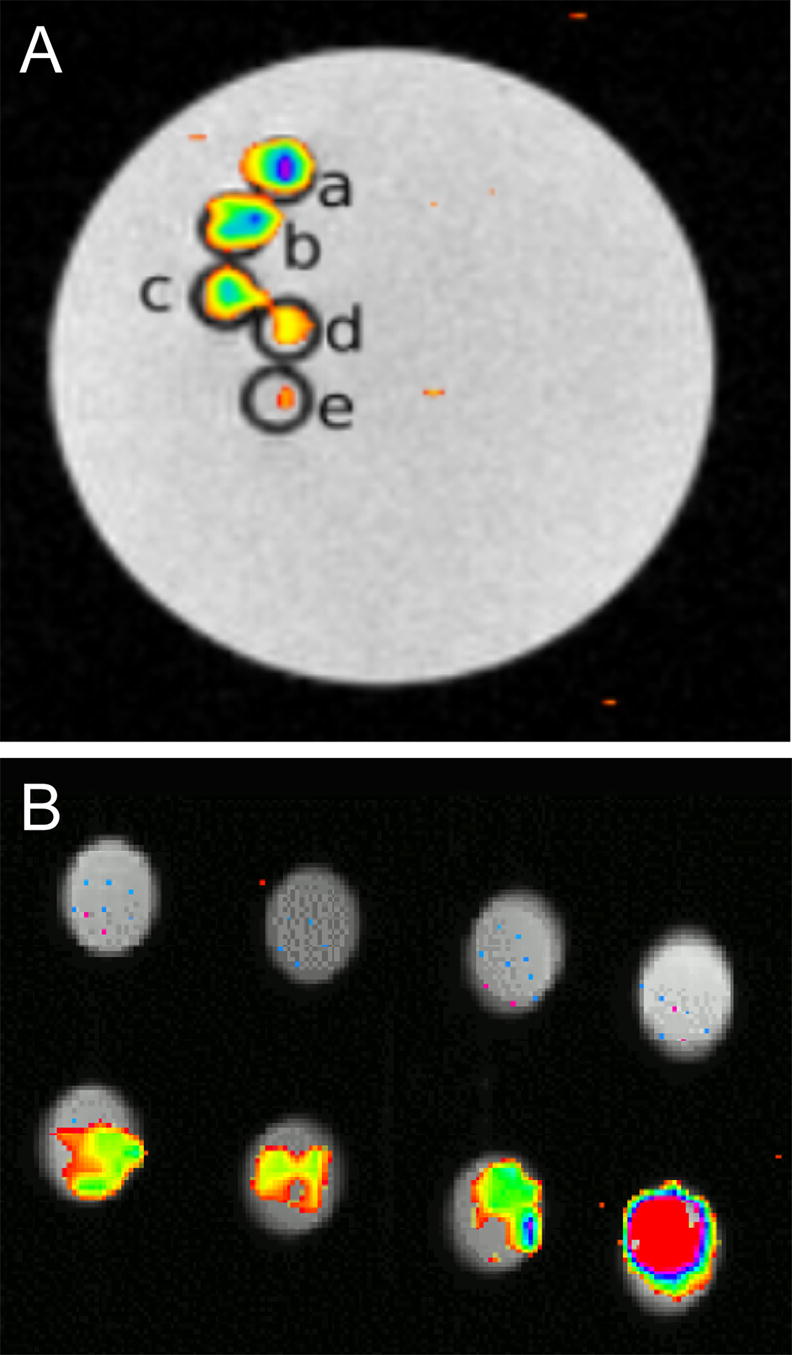
(A) and cationic PFCE-labeled C17.2 cells (B). (A) Each capillary tube (1 mm internal diameter) contains a 4% gelatin suspension containing decreasing amounts of cationic PFCE particles from top to bottom, corresponding to 60.7 (a), 48.5 (b), 42.5 (c), 36.4 (d), and 30.3 mM (e). (B) C17.2 cells were labeled with (from left to right) 0.6, 1.2, 1.8, and 2.4 mM anionic (top row) or cationic (bottom row) PFCE particles.
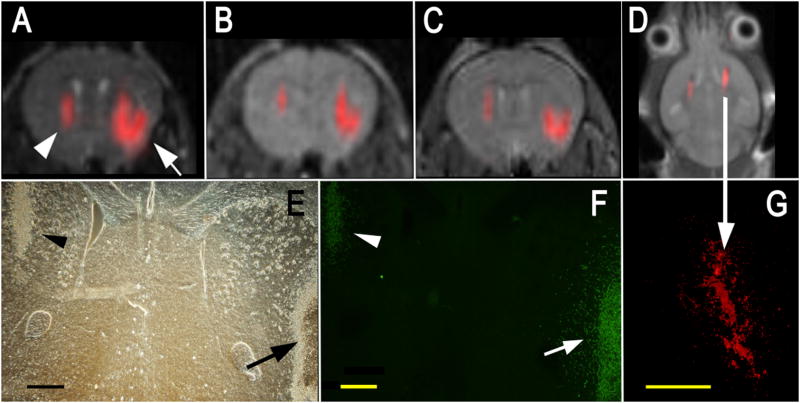
Cationic PFCE particle-labeled C17.2 NSCs were then implanted in the striata of mice at two different doses, i.e., 4×10⁴ and 3×10⁵ cells (Fig. 5). Cells could be readily detected in vivo for both injected doses. The observable 19F signal remained constant over a period of 1 week (Fig. 5B,C), and was visible for at least 14 days (Fig. 5D). Immunohistochemistry confirmed that a large number of cells were still present in both hemispheres after 1 week (Fig. 5E-G). Cells remained viable, as they continued to express β–galactosidase (Fig. 5F), and started to migrate into the brain parenchyma from the periphery of the injection site (see arrow in Fig 5F). No leakage or transfer of PFCE particles to the surrounding tissue could be observed (Fig. 5G).
Figure 5. In vivo MR imaging of transplanted C17.2 NSCs, with the 19F signal superimposed on the 1H MR images. Shown are MR images at 1 hr.
(A), 3 days (B), and 7 days (C) after injection of 4×10⁴ (left hemisphere, arrowhead in A) or 3×10⁵ (right hemisphere, arrow in A) cationic PFCE-labeled cells. Corresponding histopathology at day 7 with phase contrast (E) and anti-β-gal immunohistochemistry (F) demonstrates that implanted cells remain viable and continue to produce the marker enzyme. In F, the right arrow indicates cells migrating from the injection site into the brain parenchyma (D) MR image of a different animal at 14 days after injection of equal amounts of 4×10⁵ C17.2 cells in both hemispheres, demonstrating persistence of 19F signal for 2 weeks. (G) Corresponding histopathology showing rhodamin fluorescence from PFCE-labeled cells, co-localizing with the 19F signal. Size bars are 500 μm.
Discussion
Although 19F-containing compounds were first described in 1977 as an MR “tracer” molecule (13), its introduction in molecular (14,15) and cellular (4–6,9) MR imaging is much more recent. Given its increasing interest, we decided to investigate the suitability of cationic and anionic PFCE nanoparticles for fluorination of neural stem cells and have grafted these cells directly into mouse brain for investigating its detection by 19F MR imaging. We incorporated rhodamin as fluorescent label in order to determine the label efficiency at different time points by fluorescence microscopy. We found that the cationic nanoparticles were superior over anionic particles in terms of intracellular uptake (Fig. 1), which resulted in distinct differences of MR detectability of labeled cells (Fig. 4).
A cationic surface charge of nanoparticle MR contrast agents has previously been employed to label cells with iron oxide nanoparticles; in order to achieve this, the particles are first coated with cationic transfection agents such as poly-L-lysine (16) or SuperFect (17). Ahrens et al. have translated this approach for coating PFPE particles in order to give them a positive charge, which resulted in a successful and sustained intracellular 19F labeling (4,6). By endowing the particles directly with a cationic surface charge the use of transfection agents appears obsolete; this may facilitate future approval for clinical use as only one agent would need to be regulated.
However, the cationic nanoparticle preparation showed a strong electrostatic binding to the negative monolayer coating of traditional tissue culture dishes, and thus, were difficult to remove by washing steps. For this reason, we tested two types of commercially available culture dishes having different surface chemistry: one with the traditional surface coating of carboxylic acid groups, and thus, a slightly negative charge at pH=7, and a second with a surface coating of both amino and carboxylic groups, thus having both positive and negative charges. The latter dishes largely prevented non-specific binding of the cationic particles to the culture dish surface and were found to be optimal for fluorination of cells.
We were unable to observe any negative effects of PFCE labeling on the viability and proliferation of cells, both in vitro and in vivo (Figs. 3,5), consistent with previous reports (4,5). Cells remained viable and continued to produce the histological reporter gene, while peripherally located cells started to migrate into the brain parenchyma at one week post transplantation (Fig. 5F). Moreover, the MRI signal appeared to remain constant during that time, enabling serial tracking of cells over time. Ahrens et al. have reported a lower sensitivity threshold of about 7.5×10³ cells/voxel (6) that may potentially be further improved with optimized 19F labels and hardware instrumentation (i.e., coils). From the in vitro sensitivity measurements (Fig. 4), the in vivo MR images (Fig. 5), the number of cells injected (4×10⁴ and 4×10⁵ cells in each hemisphere), the number of voxels containing 19F signal, and the spatial resolution of the images, we estimate that the minimum detectable concentration per cell is about 140 pmol of PFCE/cell (at 5 mins of acquisition).
Thus, the detection sensitivity we observed at 9.4T is sufficient to detect injected cell doses that are currently used for cell therapy of neurodegenerative diseases in the central nervous system, which are in the order of 1×10⁵ cells or more. Therefore, 19F MRI-based stem cell tracking appears to be a viable alternative method to iron oxide-based stem cell tracking. Although its sensitivity is significantly lower than that with the use of T2*-based superparamagnetic agents, it may be particularly useful in scenarios where the use of SPIO-labeled cells is difficult to implement, such as in traumatic injury and other pathological conditions where hemorrhage may be present.
Acknowledgments
This work was supported by NIH grants RO1 NS045062 (JWMB) and U54 CA119342 (SAW). JRC was supported by a scholarship from the Spanish “Ministerio de Educación y Ciencia” (Programa de Movilidad del Personal Docente e Investigador) and grant NAN2004-08805. We are grateful to Mary McAllister for editorial assistance and Shelton Caruthers for his insight in discussing 19F relaxation.
References
- 1.Bulte JW, Kraitchman DL. Iron oxide MR contrast agents for molecular and cellular imaging. NMR in Biomedicine. 2004;17:484–499. doi: 10.1002/nbm.924. [DOI] [PubMed] [Google Scholar]
- 2.Modo M, Hoehn M, Bulte J. Cellular MR imaging. Mol Imaging. 2005;4:145–155. doi: 10.1162/15353500200505145. [DOI] [PubMed] [Google Scholar]
- 3.Nöth U, Morrissey SP, Deichmann R, Jung S, Adolf H, Haase A, Lutz J. Perfluoro-15-crown-5-ether labelled macrophages in adoptive transfer experimental allergic encephalomyelitis. Artif Cells Blood Substit Immobil Biotechnol. 1997;25:243–254. doi: 10.3109/10731199709118914. [DOI] [PubMed] [Google Scholar]
- 4.Ahrens ET, Flores R, Xu H, Morel PA. In vivo imaging platform for tracking immunotherapeutic cells. Nature Biotech. 2005;23:983–987. doi: 10.1038/nbt1121. [DOI] [PubMed] [Google Scholar]
- 5.Partlow KC, Chen J, Brant JA, Neubauer AM, Meyerrose TE, Creer MH, Nolta JA, Caruthers SD, Lanza GM, Wickline SA. 19F magnetic resonance imaging for stem/progenitor cell tracking with multiple unique perfluorocarbon nanobeacons. Faseb J. 2007;21:1647–1654. doi: 10.1096/fj.06-6505com. [DOI] [PubMed] [Google Scholar]
- 6.Srinivas M, Morel PA, Ernst LA, Laidlaw DH, Ahrens ET. Fluorine-19 MRI for visualization and quantification of cell migration in a diabetes model. Magn Reson Med. 2007;58:725–734. doi: 10.1002/mrm.21352. [DOI] [PubMed] [Google Scholar]
- 7.Nöth U, Jäger LJE, Lutz J, Haase A. Fast 19F-NMR imaging in vivo using FLASH-MRI. Magn Reson Imaging. 1994;12:149–153. doi: 10.1016/0730-725x(94)92362-0. [DOI] [PubMed] [Google Scholar]
- 8.Dardzinsky BJ, Sotak CH. Rapid tissue oxygen tension mapping using 19F inversion-recovery echo-planar imaging of perfluoro-15-crown-5-ether. Magn Reson Med. 1994;32:88–97. doi: 10.1002/mrm.1910320112. [DOI] [PubMed] [Google Scholar]
- 9.Bulte JWM. Hot spot MRI emerges from the background. Nature Biotech. 2005;23:945–946. doi: 10.1038/nbt0805-945. [DOI] [PubMed] [Google Scholar]
- 10.Schmieder AH, Winter PM, Caruthers SD, Harris TD, Williams TA, Allen JS, Lacy EK, Zhang H, Scott MJ, Hu G, Robertson JD, Wickline SA, Lanza GM. Molecular MR imaging of melanoma angiogenesis with alphanubeta3-targeted paramagnetic nanoparticles. Magn Reson Med. 2005;53:621–627. doi: 10.1002/mrm.20391. [DOI] [PubMed] [Google Scholar]
- 11.Ryder EF, Snyder EY, Cepko CL. Establishment and characterization of multipotent neural cell lines using retrovirus vector-mediated oncogene transfer. Journal of neurobiology. 1990;21(2):356–375. doi: 10.1002/neu.480210209. [DOI] [PubMed] [Google Scholar]
- 12.Snyder EY, Deitcher DL, Walsh C, Arnold-Aldea S, Hartwieg EA, Cepko CL. Multipotent neural cell lines can engraft and participate in development of mouse cerebellum. Cell. 1992;68:33–51. doi: 10.1016/0092-8674(92)90204-p. [DOI] [PubMed] [Google Scholar]
- 13.Holland GN, Bottomley PA, Hinshaw WS. 19F Magnetic Resonance Imaging. J Magn Reson. 1977;28:133–136. [Google Scholar]
- 14.Morawski AM, Winter PM, Crowder KC, Caruthers SD, Fuhrhop RW, Scott MJ, Robertson JD, Abendschein DR, Lanza GM, Wickline SA. Targeted Nanoparticles for Quantitative Imaging of Sparse Molecular Epitopes With MRI. Magn Reson Med. 2004;51:480–485. doi: 10.1002/mrm.20010. [DOI] [PubMed] [Google Scholar]
- 15.Caruthers SD, Neubauer AM, Hockett FD, Lamerichs R, Winter PM, Scott MJ, Gaffney PJ, Wickline SA, Lanza GM. In Vitro Demonstration Using 19F Magnetic Resonance to Augment Molecular Imaging With Paramagnetic Perfluorocarbon Nanoparticles at 1.5 Tesla. Invest Radiol. 2006;2006:305–212. doi: 10.1097/01.rli.0000199281.60135.6a. [DOI] [PubMed] [Google Scholar]
- 16.Frank JA, Miller BR, Arbab AS, Zywicke HA, Jordan EK, Lewis BK, Bryant LH, Jr, Bulte JW. Clinically applicable labeling of mammalian and stem cells by combining superparamagnetic iron oxides and transfection agents. Radiology. 2003;228:480–487. doi: 10.1148/radiol.2281020638. [DOI] [PubMed] [Google Scholar]
- 17.Hoehn M, Kustermann E, Blunk J, Wiedermann D, Trapp T, Wecker S, Focking M, Arnold H, Hescheler J, Fleischmann BK, Schwindt W, Buhrle C. Monitoring of implanted stem cell migration in vivo: a highly resolved in vivo magnetic resonance imaging investigation of experimental stroke in rat. Proc Natl Acad Sci U S A. 2002;99:16267–16272. doi: 10.1073/pnas.242435499. [DOI] [PMC free article] [PubMed] [Google Scholar]


