Abstract
Elasticity imaging is an emerging medical imaging modality that seeks to map the spatial distribution of tissue stiffness. Ultrasound radiation force excitation and motion tracking using pulse-echo ultrasound have been used in numerous methods. Dynamic radiation force is used in vibrometry to cause an object or tissue to vibrate, and the vibration amplitude and phase can be measured with exceptional accuracy. This paper presents a model that simulates harmonic motion detection in a vibrating scattering medium incorporating 3-D beam shapes for radiation force excitation and motion tracking. A parameterized analysis using this model provides a platform to optimize motion detection for vibrometry applications in tissue. An experimental method that produces a multifrequency radiation force is also presented. Experimental harmonic motion detection of simultaneous multifrequency vibration is demonstrated using a single transducer. This method can accurately detect motion with displacement amplitude as low as 100 to 200 nm in bovine muscle. Vibration phase can be measured within 10° or less. The experimental results validate the conclusions observed from the model and show multifrequency vibration induction and measurements can be performed simultaneously.
I. Introduction
An emerging area of biomedical imaging is elasticity imaging. Elasticity imaging seeks to measure and display the spatial distribution of tissue stiffness in the human body. Palpation has for centuries been a fundamental practice in medical examinations. Palpation is based on the premise that diseased tissue may “feel” different than surrounding healthy tissue. Studies have shown a positive correlation between an increase in stiffness in tissue and pathology [1]–[3].
Palpation has certain limitations including its subjectivity, dependence on the proficiency of the examiner, and inability to detect small and deep lesions [4]–[6]. To overcome some of these drawbacks, elasticity imaging has been proposed to offer an objective, reproducible, noninvasive, and high-resolution imaging modality to measure the spatial distribution of tissue stiffness.
Many different methods have been reported to perform elasticity imaging, but all of these methods have two common components, a way to impose a force to deform the tissue statically or dynamically and a way to measure the mechanical response. Over the last decade, there has been significant interest in combining the ultrasound radiation force to locally deform the tissue [7]–[15] and ultrasound imaging techniques to measure the motion [16]–[23].
Radiation force can be used to create shear waves in tissue. Shear wave speed can be used as an input to viscoelastic models to estimate material properties of tissue [8], [13], [24], [25]. Local deformation of tissue using radiation force has been used to infer information about the viscoelastic properties of the tissue [7], [11], [12], [14], [15], [26].
In acoustic radiation force impulse (ARFI) imaging, an array transducer is used to transmit a toneburst of ultrasound to push tissue, and then B-mode imaging and correlation techniques are used to measure the induced motion [12]. This technique produces a transient radiation force. Other investigators have used dynamic radiation force to vibrate tissue harmonically. Sarvazyan et al. presented a method called shear wave elasticity imaging that uses amplitude modulated ultrasound to create shear waves and a separate imaging transducer to measure the shear waves [8].
Fatemi and Greenleaf used two intersecting ultrasound beams of slightly different frequencies, Δf, to create a dynamic radiation force at Δf [9], [10]. This radiation force vibrates the object or tissue where the beams intersect at the focal region of the transducer. The resulting vibration is harmonic, that is, sinusoidal at a specific frequency. In vibro-acoustography, this vibration is used to create an acoustic response and this acoustic emission can be detected with a nearby hydrophone. In vibrometry, this induced vibration can be measured using a laser vibrometer or separate ultrasound transducer [27]–[30].
In local harmonic motion (LHM) imaging, amplitude-modulated ultrasound or intersecting ultrasound beams are used to create the dynamic radiation force, and the resulting motion is measured with a separate transducer [14], [26]. In these reports, the radiation force was created using ultrasound near 2.27 MHz or 3.75 MHz and 1.1 MHz pulse-echo ultrasound, and correlation techniques were used to perform motion tracking. LHM imaging has also been performed with a phased-array transducer with radiation force from a 1.1 MHz ultrasound beam and motion tracking using pulse-echo ultrasound near the fifth harmonic at 4.86 MHz [31].
Michishita et al. described a method that used gated tonebursts of an amplitude-modulated ultrasound wave to create a dynamic ultrasound radiation force at the modulation frequency of the ultrasound [15]. In this method, two separate 5.0 MHz transducers were used to create the radiation force and perform pulse-echo ultrasound for motion tracking.
Vibrometry provides complementary information to that obtained in vibro-acoustic imaging. Vibration velocity or displacement data can be used as inputs to models to estimate material properties of tissue. Vibrometry phase information has been useful in differentiating materials with different mass density [32]. Phase measurements have also been used to measure shear wave speed. Chen et al. reported that harmonic shear wave speed could be measured using two phase measurements at two locations along the shear wave propagation direction [25].
Although there are many potential benefits of vibrometry, its current practice has some limitations. Typically, the motion induced by radiation force excitation is measured with a Doppler laser vibrometer or a separate transducer operating in pulse-echo or Doppler mode [25], [27–30], [32], [33]. The laser vibrometer is restricted to measuring the motion of a surface and is not useful for tissue studies because of its inability to penetrate deeply into tissue.
In studies measuring shear wave propagation and propagating waves along an artery wall, separate transducers were used for radiation force excitation and motion detection either using Doppler or pulse-echo ultrasound [25], [30]. In clinical environments, the use of two transducers may not be desirable. Therefore, a single transducer to induce vibration and measure the motion would be ideal. In ARFI and one implementation of LHM imaging, the radiation force creation and motion detection is performed with a single transducer.
Harmonic vibration is a useful tool because sensitive signal processing techniques can be used to extract vibration amplitude and phase information. Also, the frequency response of an object or tissue can be evaluated easily. Harmonic motion detection of a vibrating reflective target was reported previously by Urban and Greenleaf [34]. However, the results of that study can only be applied to tissue structures that are very echogenic, such as an arterial wall. Most tissues can be represented as a collection of acoustic scatterers. Therefore, to extend harmonic motion detection in soft tissues, analysis of vibration and motion detection in a vibrating scattering medium is necessary.
In this paper, we present a model for harmonic motion detection of a vibrating scattering medium that incorporates 3-D beam shapes used for both motion induction and detection. We then present a method called harmonic pulsed excitation for vibrating tissue with a multifrequency radiation force created by repetitive gated tonebursts of ultrasound. Experimental measurements in a scattering gelatin phantom and section of bovine muscle are described and compared with the model results.
II. Methods
A. Harmonic Motion Detection
Motion detection can be performed using ultrasonic waves at frequency ωf to interrogate a collection of scatterers vibrating with frequency ωs, where ωs ≪ ωf. In this paper, the subscript f refers to fast time corresponding to ultrasonic time scale, which is on the order of microseconds, and the subscript s refers to slow time corresponding to the vibration time scale, which is on the order of milliseconds [23]. The displacement and the velocity of vibrating scatterers is modeled as
| (1) |
| (2) |
where D0 is the displacement amplitude, ϕs is the vibration phase, and v0 is the velocity amplitude (v0 = D0ωs). If an ultrasonic pulse at frequency ωf is used, the echo from the vibrating scatterers can be modeled as [23]
| (3) |
where tf is fast time, ts is slow time, A is the echo amplitude, ϕf is the initial phase of the ultrasound signal, and β is defined as
| (4) |
where θ is the Doppler angle, which we assume to be 0°, and c is the longitudinal sound speed of the medium.
For harmonic motion detection, D0 and ϕs are the parameters to be determined by measurements. However, both variables are embedded in the phase of the ultrasound echo in (3). Many groups have approached this problem from the standpoint that a phase shift can be thought of as a time shift between consecutive echoes. Therefore, estimation of the phase or time shift can be used to determine the displacement amplitude and vibration phase.
Two early methods used a 2-D autocorrelation approach [17], [18]. The significant difference between the algorithm proposed by Loupas et al. and Kasai et al. is that the Loupas method corrects for the mean ultrasound echo center frequency whereas the Kasai method uses the transmitted ultrasound center frequency. For applications where motion is induced by impulsive radiation force excitation or static mechanical compression, measurement of the displacement can be performed using cross-correlation supplemented with interpolation and spline estimation techniques [19]–[21], [35]–[38]. The methods using interpolation and especially the splines can be computationally expensive.
Zheng et al. proposed using quadrature demodulation to obtain the signal y(ts) = β sin(ωsts + ϕs). However, in the quadrature demodulation, the low-pass filtering step can introduce artifacts because of transient effects of the filters applied to short segments of echo signals are considered. A different method was used in these studies to obtain the embedded phase signal.
To evaluate the displacement tracked using pulse-echo ultrasound, Hasegawa and Kanai proposed a cross-spectrum method that corrects for the center frequency of the ultrasonic echo [22]. Denoting the nth and (n+1)th received echoes in slow-time as r(n) and r(n+1) and their corresponding frequency spectrums as Rn(f) and Rn+1(f), the cross-spectrum is calculated as
| (5) |
where Δθn(f) is the phase shift between the two echoes and * represents complex conjugation. The motion of the vibrating scatterers can then be extracted by performing this cross-spectral analysis for all echoes after each echo was windowed using a Hann window. The velocity can be estimated by
| (6) |
where the phase shift is evaluated at the center frequency, fc, of the cross-spectrum, and Tprf is the pulse repetition period of the pulse-echo interrogation. The center frequency of the echo is estimated by finding the frequency at which the maximum occurs in the magnitude of the cross-spectrum. The reason for the center frequency correction is that absorption mechanisms can downshift the center frequency of the received echo from that of the transmitted pulse. It has been reported that, if no correction is performed for the center frequency, the results can be biased [22].
Because the vibration is harmonic at ωs, the displacement signal can be obtained by Dn = vn/ωs. Once Dn has been found, a Kalman filter is used to extract amplitude and phase of the displacement where the only input needed is the vibration frequency, ωs [23]. The Kalman filter is a recursive state space based digital filter that estimates the state variables using a least mean squared error criteria [23].
B. Vibrating Scattering Medium
Significant studies have been performd in the ultrasound field to understand how scatterers in tissue give rise to the signature speckle seen in diagnostic ultrasound images [39], [40]. To understand this process, algorithms have been devised to simulate the speckle that results from insonification of a group of scatterers [40], [41]. For the purposes of the model presented in this article, the scatterers are uniformly distributed within a volume and each has unity reflectivity. The density of the scatterers is specified as scatterers per resolution cell, where the resolution cell of the ultrasound beam is defined as the volume encompassed by the ultrasound beam that has magnitude −6 dB below the peak value. To achieve fully developed speckle, that is, speckle with a signal-to-noise ratio of 1.91, Palmeri et al., demonstrated that a minimum of 11 scatterers/resolution cell volume was necessary [21].
One factor that has been investigated in motion detection is the shape of the ultrasound beams used for radiation force and for motion tracking. McAleavey et al., have reported that, in ARFI imaging, measurement bias of the displacement can occur because different beam shapes were used for excitation and motion detection [42]. McAleavey and his colleagues modeled the beam shapes as 2-D Gaussian functions and made the argument that the tracking beam samples a finite amount of the motion created by the excitation beam. However, because this distribution is not uniform, some averaging will occur, and the measured result will be less than the peak displacement. When the tracking beam is wide with respect to the excitation beam, then more decorrelation or negative bias will result in the measurements. A thin tracking beam with respect to the excitation beam is ideal so that the tracking beam intercepts the region where the peak displacement of the scatterer(s) occurs.
In this model, the beam shape dimensions in the azimuthal and elevation or x- and y-directions are considered. They assume that axially, or in the z-direction, the excitation, and therefore the motion, will be constant. This, however, will not be the case in practice because the excitation beam’s magnitude will vary with axial distance.
The beam shapes can be characterized by the full width at half maximum (FWHM) in each dimension for both the excitation and tracking beams. The FWHM of the excitation beam is scaled to fit a Gaussian model. In the x-, y-, and z-directions, the excitation beam parameters will be denoted as Ex, Ey, and Ez. Likewise, tracking beam parameters in the x-, y-, and z-directions will be denoted as Tx, Ty, and Tz. The E and T parameters represent half of the FWHM values in the respective directions. McAleavey et al. compare the size of the excitation and tracking beams using a ratio where Wi = Ei/Ti, and i = x, y, or z. For the circular, 3.0 MHz transducer used for experiments reported here with 45 mm diameter and focal length of 70 mm, Ex = Ey = 0.17 mm and Ez = 1.80 mm, which correspond to FWHM values of 0.80, 0.80, and 8.48 mm in the x-, y-, and z-directions. Because tracking pulses for experimental measurements are transmitted at 9.0 MHz using the same transducer, Tx = Ty = 0.078 mm and Tz = 0.83 mm, which corresponds to FWHM values of 0.365, 0.365, and 3.89 mm in the x-, y-, and z-directions. For these beam shape parameters, Wx = Wy = 2.19 and Wz = 2.18.
McAleavey et al. derived an analytic formula describing the effects of different values of Wx and Wy on the ability to track the peak displacement caused by a radiation force excitation toneburst. With the values for this transducer, the best results attainable would be tracking 92% of the peak displacement or at the least an 8% error [42]. With the addition of the axial beam shape, the error should increase although the error should only be represented as a displacement bias. The inclusion of the beam shape weighting in the z-direction is important to completing the model.
We can extend the model for a single vibrating reflective target [34] to calculate the motion and resulting echoes obtained from vibrating scatterers where the motion and tracked motion is weighted by the beam shapes of the excitation and motion tracking ultrasound beams. We can model the first received echo from a volume with N scatterers and the nth scatterer has position (xn, yn, zn) as
| (7) |
where I(xn, yn, zn) is the weighting function for the tracking beam focused at an axial distance of zF modeled as a 3-D Gaussian function defined as
| (8) |
and w(tf) is a Hann window applied to establish the pulse’s bandwidth, BW,
| (9) |
The kth echo in the sequence can be written as
| (10) |
where
| (11) |
| (12) |
| (13) |
Eq. (11) describes the time delay of the kth echo encountered for the nth scatterer. The function uz,k(xn, yn, zn) is the 3-D Gaussian weighting function for the excitation and A(kts) is the vibration amplitude for the kth echo.
The cross-spectral analysis proposed by Hasegawa and Kanai [22] is used for analysis of the echoes, and the Kalman filter for harmonic motion described by Zheng et al. [43] is used for extraction of the displacement amplitude and phase.
III. Experiments
A. Simulations
Many parameters enter into modeling the motion detection of a vibrating scattering medium. First, it is assumed that the scatterers are distributed uniformly. The parameters that are expected to most affect performance of this method are the displacement amplitude, D0, signal-to- noise ratio (SNR) of the ultrasound echoes, the number of cycles of vibration used, Nc, and the number of points sampled per vibration cycle, Np. Other parameters that may affect performance such as scatterer density, gate length, sampling frequency, and transducer bandwidth will also be explored.
Radiation force amplitude determines displacement amplitude. Radiation force is proportional to the ultrasound intensity, which is limited in practice because of bioeffect concerns. The intensities lying within the limits of the Food and Drug Administration produce small displacements, < 10 μm, in tissue. Therefore, a lower limit of displacement amplitude necessary to obtain reliable results needs to be determined.
The SNR of the ultrasound echoes will primarily be determined by scatterer backscatter strength and the electronic noise introduced in the pulse-echo system. In a scattering medium, the SNR can vary based on different types of tissue and anatomical structures.
The number of vibration cycles in each measurement will directly affect acquisition time for each measurement, T = Nc/fv, where T is the acquisition time and fv is the vibration frequency. For point measurements, the impact may be low, but if this method is employed for imaging, image acquisition time will be governed by Nc. Also, increasing Nc will extend the processing time for the displacement estimate as well as the potential for tissue heating.
The number of points sampled per vibration cycle, Np, will affect the pulse repetition frequency, fprf, used in the experiment as Np = fprf/fv. To avoid aliasing artifacts, Shannon sampling theorem must be satisfied by setting Np ≥ 2. The value of fprf is limited by the distance of the vibrating scatterer from the transducer, where the maximum pulse repetition frequency fprf,m = c/2z where c is the sound speed of the medium and z is the axial depth of the vibrating scatterer from the transducer. Increasing Np will increase processing time for the displacement estimate. Because Nc and Np are dimensionless, the results of this model can be extended for any value of fv and fprf within the limits described above.
To evaluate the performance of the method, we use two metrics, bias and jitter. These metrics originate from the estimation of time delays. The bias, xB, is the mean of the error, and the jitter, σJ, is the standard deviation of the error, and they are calculated as
| (14) |
| (15) |
where N is the number of data samples, xT is the true value, and x̄ is the mean of the data samples [35]. Minimizing bias and jitter is desired. The bias and jitter reflect the accuracy and precision, respectively, of the motion detection. Bias and jitter measures will be evaluated on both displacement amplitude and phase for 1000 iterations with different initial conditions for the noise added to adjust the SNR. The noise, n(tf, ts), was normally distributed and added to the simulated ultrasound echo data,
| (16) |
Experimentally, the added noise would be attributed to the combination of low scatterer signal and noise in the electronics of the ultrasound system.
To evaluate the effects of different parameters on the results of motion detection in a scattering medium, a parameterized analysis was performed. The default parameters for the parameter study are listed in Table I. A default value of D0 = 1000 nm was chosen because this is a typical value seen in experimentation. In vibrometry experiments, low frequency vibration on the order of a few hundred Hertz is used so fv = 200 Hz. The values of Nc = 5 and Np = 20 give values of T = 25 ms and fprf = 4.0 kHz. The default value for the number of scatterers/resolution cell is set to Ns = 11 to ensure fully developed speckle. The interrogating pulses have been windowed with a Gaussian window to reflect the bandwidth of the transducer, BW. The gate length, lg, is the spatial extent used for comparison of consecutive echoes and phase shift calculation. The sampling frequency, Fs, is the fast time sampling frequency for the ultrasound echoes.
TABLE I.
Parameter Study Default Parameters.
| D0 | Displacement amplitude | 1000 nm |
| ϕs | Vibration phase | 0° |
| Nc | Cycles of vibration | 5 |
| Np | Sampled points per vibration cycle | 20 |
| fv | Vibration frequency | 200 Hz |
| ff | Ultrasound frequency | 9.0 MHz |
| Fs | Sampling frequency | 100 MHz |
| BW | Transducer bandwidth | 6.5% |
| lg | Gate length | 1.0 mm |
| c | Speed of sound | 1540 m/s |
| Ns | Scatterers/resolution cell volume | 11 |
| Ex | Excitation beam width in x direction | 0.17 mm |
| Ey | Excitation beam width in y direction | 0.17 mm |
| Ez | Excitation beam width in z direction | 1.80 mm |
| Tx | Tracking beam width in x direction | 0.078 mm |
| Ty | Tracking beam width in y direction | 0.078 mm |
| Tz | Tracking beam width in z direction | 0.83 mm |
| xv | x dimension of scattering volume | 1.0 mm |
| yv | y dimension of scattering volume | 1.0 mm |
| zv | z dimension of scattering volume | 5.0 mm |
| N | Iterations | 1000 |
The displacement amplitude was varied over values of D0 = 100, 500, 1000, 5000, and 10 000 nm. The number of cycles of vibration used in the analysis was varied over values of Nc = 3, 5, 10, 15, and 20. The number of points sampled per vibration cycle was varied over values of Np = 5, 10, 15, 20, 25, and 30. The number of scatters/resolution cell volume was varied over values of Ns = 11, 16, 21, 27, and 33. The gate length was varied over values of lg = 0.5, 1.0, and 2.0 mm. The sampling frequency of the echoes was varied over values of Fs = 50, 100, and 200 MHz. The bandwidth of the tracking beam was varied over BW = 6.5, 20.0, 40.0, and 75.0%. The beam shape parameters, Wx, Wy, were varied from 0.1 to 10 and Wz, were varied to Wz = 0.1, 0.5, 1.0, and 2.18.
B. Gelatin Phantom Measurements
1) Gelatin Phantom Preparation and Characterization
To evaluate the ability to distinguish tissue of different stiffness with harmonic motion detection, three gelatin phantoms were made to test whether the detected frequency responses were different. Gelatin phantoms were made using 300 Bloom gelatin (Sigma-Aldrich, St. Louis, MO) with a concentration of 8, 12, and 15% by volume to achieve different values of the shear modulus. A preservative of potassium sorbate (Sigma-Aldrich, St. Louis, MO) was also added with concentrations of 10 g/L. Graphite particles (Sigma-Aldrich, St. Louis, MO) with size <45 μm were added with a concentration of 8% by volume to provide adequate ultrasonic scattering. It was assumed based on previous experience that the increase in gelatin concentration did not provide a considerable increase in ultrasound attenuation compared with that provided by the graphite. A 440-C stainless steel sphere with diameter 1.59 mm was embedded in each phantom so the gelatin’s material properties could be characterized. Using the method developed by Chen et al. [27] and the measurement techniques detailed by Urban and Greenleaf [34], the shear elasticity, μ1, and shear viscosity, μ2, were determined.
2) Harmonic Pulsed Excitation
To perform the measurements of the motion frequency response of the gelatin phantoms and bovine muscle, the signal-processing model that was previously discussed is used along with radiation force excitation with a method called harmonic pulsed excitation. Harmonic pulsed excitation (HPE) is a new method that combines attributes of ARFI and the method proposed by Michishita and his colleagues. In this method, gated tonebursts of ultrasound are applied in a repetitive manner to produce a dynamic radiation force. In between the tonebursts, pulse-echo ultrasound is used to obtain radiofrequency data for motion detection. This method does not require amplitude modulation of the ultrasound used for radiation force generation, which eliminates the need for a modulating signal. Another attribute is that radiation force excitation and motion detection can be performed with the same transducer as is done in the ARFI method.
Ultrasound tonebursts with length Tb and are repeated at a rate of fr, where fr = 1/Tr and Tr is the repetition period. The motion detection pulses are transmitted with a pulse repetition frequency of fprf where fprf = 1/Tprf and Tprf is the pulse repetition period. There may also be a delay, td, for the onset of the transmission of the motion detection pulses.
The radiation force function is proportional to the short-term time average of the energy density [10], proportional to a low-pass filtered version of the square of the ultrasound pressure, making the function a rectified rectangular pulse train. Using Bracewell’s conventions, we can describe this radiation force function, f(t), as the convolution of an impulse train, III(t), with a time-offset rectangle function, II(t) [44],
| (17) |
where a is the radiation force amplitude, which for this derivation will be unity and ⊗ indicates convolution. The Fourier transform of the radiation force function is [34]
| (18) |
where δ(·) is the impulse function.
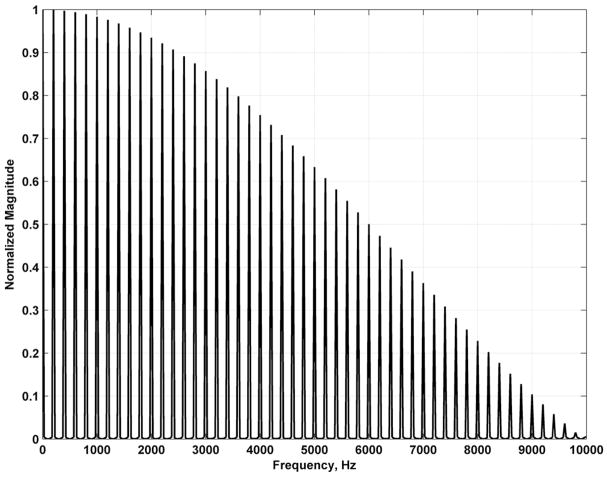
A few features are of note in (18). First, force components occur at all multiples of fr. Therefore, this is a multifrequency excitation method. The multifrequency force allows simultaneous measurement of motion at multiple frequencies. The velocity or displacement at vibration frequencies fv = nfr can be analyzed with the processing scheme with the Kalman filter and choosing an appropriate vibration frequency input. Second, the magnitude of the excitation components is modulated by a sinc-shaped envelope with zeros occurring at frequencies that are multiples of 1/Tb. The magnitude spectrum for the radiation force function, |F(f)|, with Tb = 100 μs and fr = 200 Hz is shown in Fig. 1.
Fig. 1.
Magnitude spectrum of radiation force function for harmonic pulsed excitation for Tb = 100 μs and fr = 200 Hz.
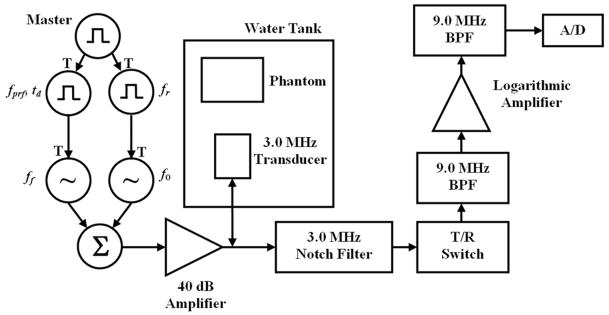
An experimental method for HPE and motion detection was reported by Urban and Greenleaf [34] and will be detailed here as well. The HPE method was initiated using a trigger signal from a signal generator producing one cycle of a TTL pulse. This master trigger signal triggered a signal generator to produce a 20-cycle rectangular pulse train with a frequency of fr = 100 Hz. This pulse train triggered a signal generator that produced a toneburst of length Tb = 50, 100, or 200 μs. The voltage amplitude of this toneburst was varied to change the radiation force amplitude. The master trigger was also applied to another signal generator (33250A, Agilent, Palo Alto, CA) that produced a rectangular pulse train with a frequency of fprf with variable delay td, which was adjusted to avoid interference between tonebursts used for radiation force and pulses used for motion tracking. The value of the fprf was varied during the experiment to assess its effects on the results. This pulse train was used as a trigger input to the analog-to-digital (A/D) converter board in a personal computer. The A/D converter produced a trigger signal for every pulse in the pulse train, and this triggered a signal generator to generate a 3-cycle pulse at 9.0 MHz. The pulse-echo interrogation was performed at 9.0 MHz to separate the excitation tonebursts and tracking pulses in frequency. The 3.0 MHz transducer was air-backed and responded adequately at 9.0 MHz (−16 dB with respect to 3.0 MHz peak) to acquire reliable echo signals. The radiation force toneburst and tracking pulse were added together using a hybrid junction (M/A-COM, Inc., Lowell, MA), and this signal was amplified with a 40 dB amplifier. This signal passed through a diode bridge to eliminate low-level noise from the amplifier and through a matching transformer to the transducer. The received echoes were filtered with a 3.0 MHz notch filter with a 50% bandwidth. The echoes then passed through a transmit/receive (T/R) switch and then filtered with a 9.0 MHz bandpass filter with 33% bandwidth, amplified by a logarithmic amplifier and finally filtered by another 9.0 MHz bandpass filter before being digitized at a sampling frequency of 100 MHz (ATS460, Alazartech, Montreal, QC, Canada). The experiments were performed in a water tank. A block diagram of the experimental setup of HPE and motion detection is shown in Fig. 2.
Fig. 2.
Experimental setup for harmonic pulsed excitation and motion tracking in various phantoms. For the excitation, a pulse train with frequency fr = 100 Hz is initiated by a master trigger (T indicates a trigger input), and each positive pulse triggers a toneburst of ultrasound at f0 = 3.0 MHz. For the tracking, a pulse train at fprf is initiated with specified time delay, td, and each positive pulse triggers a 3 cycle pulse at ff = 9.0 MHz to be transmitted. The excitation and tracking signals are summed together and amplified before being sent to the 3.0 MHz transducer in the water tank. For tracking, the gated echoes are filtered with a notch filter centered at 3.0 MHz before passing through a transmit/receive (T/R) switch and then filtered with a bandpass filter centered at 9.0 MHz. The signal is logarithmically amplified and filtered again with a bandpass filter centered at 9.0 MHz before being sent to the digitizer (A/D).
The cross-spectral analysis proposed by Hasegawa and Kanai was applied to the measured echoes [22]. A bandpass filter was used in software to isolate the information at the frequency of interest. A Hann windowed version of the displacement signal is used as the input to the Kalman filter [23]. The use of the Hann window decreases the strength of the signal by a factor of 2 so the final displacement result acquired after the Kalman filter is multiplied by 2.
C. Bovine Muscle Measurements
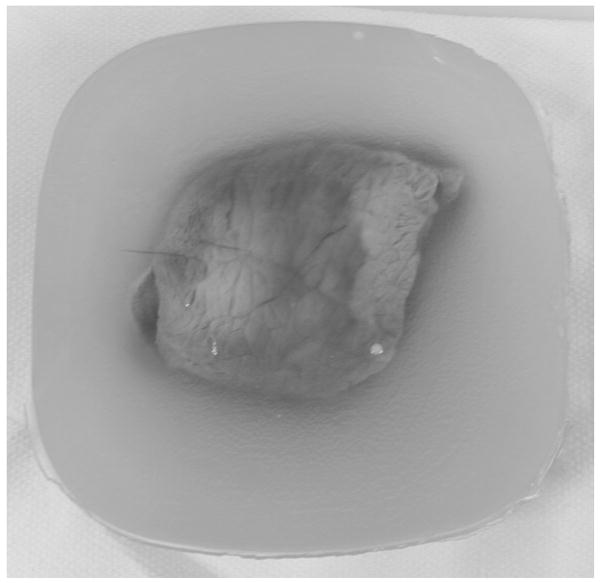
The media for the second experiment was a piece of beef roast that was cut into a 6.5 × 7.0 × 2.5 cm section. The bovine muscle was embedded in an agar mixture (Bacto Agar, Becton, Dickinson Company, Sparks, MD) made with a concentration of 3% by volume. The phantom is pictured in Fig. 3. Agar was used so that the water temperature in the water tank could be raised to approximately 37°C to mimic body temperature. Gelatin was not used because of its lower melting point. Harmonic pulsed excitation and motion detection as described in the previous section were used.
Fig. 3.
Photograph of bovine muscle section embedded in agar.
IV. Results
A. Simulation Results
Fig. 4 shows the displacement and phase results for the default conditions in Table I. Each data point and error bars represent the mean and one standard deviation, respectively, obtained from 1000 iterations. The dashed lines represent the target value, either D0 = 1000 nm or ϕs = 0°. As SNR increases, the displacement estimates level out to a constant value, and the error bar height decreases. For the phase, the same occurs, but no bias is evident in the results.
Fig. 4.
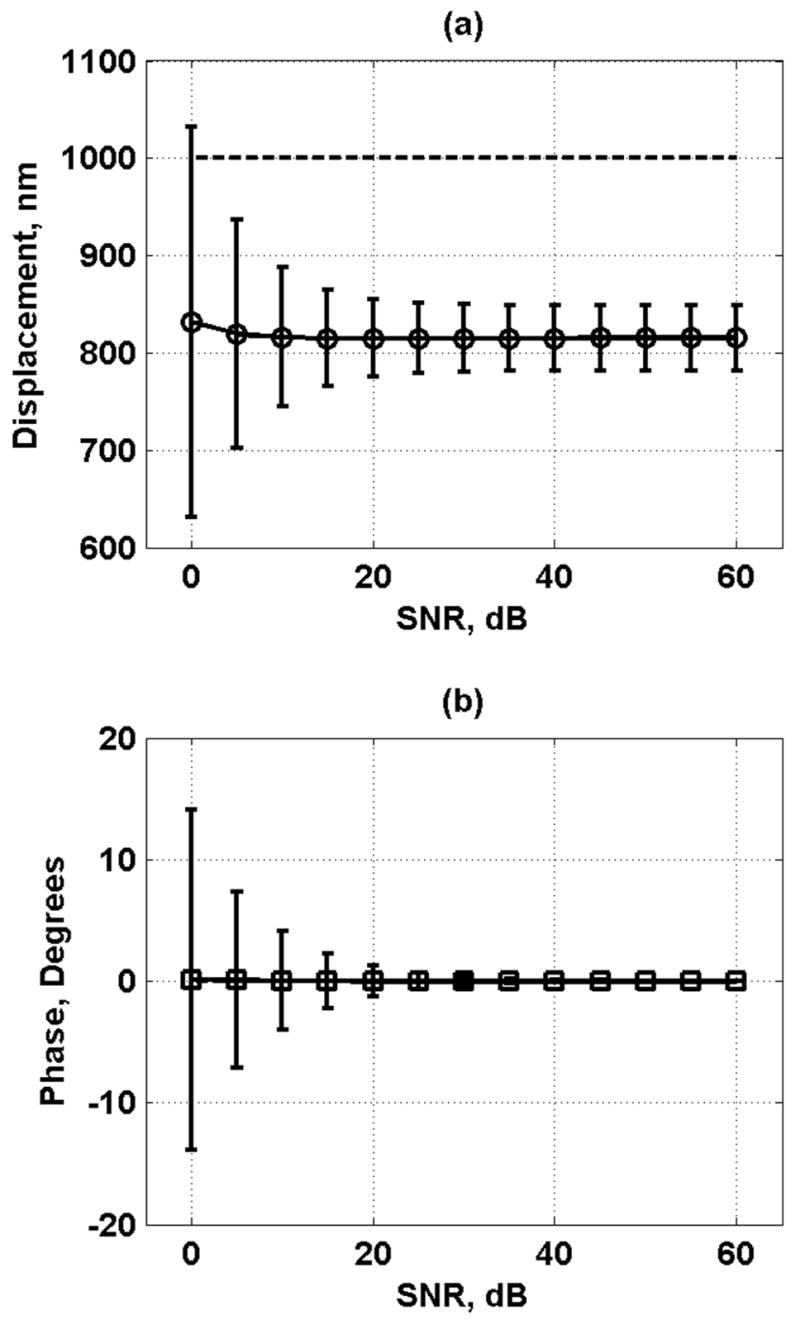
Displacement and phase results for default conditions in Table I. Each data point represents the mean, and the error bars represent one standard deviation. (a) Displacement amplitude results. The black dashed line is the target value of D0 = 1000 nm. (b) Phase results. The black dashed line is the target value of ϕs = 0°.
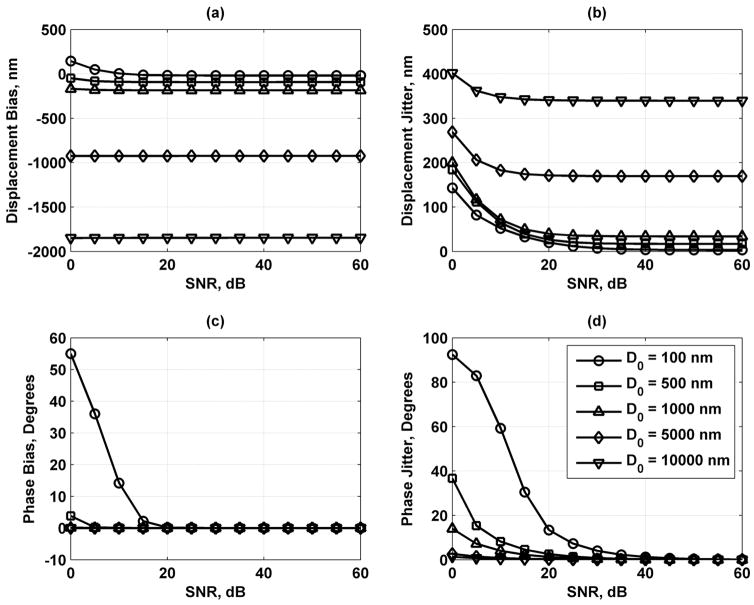
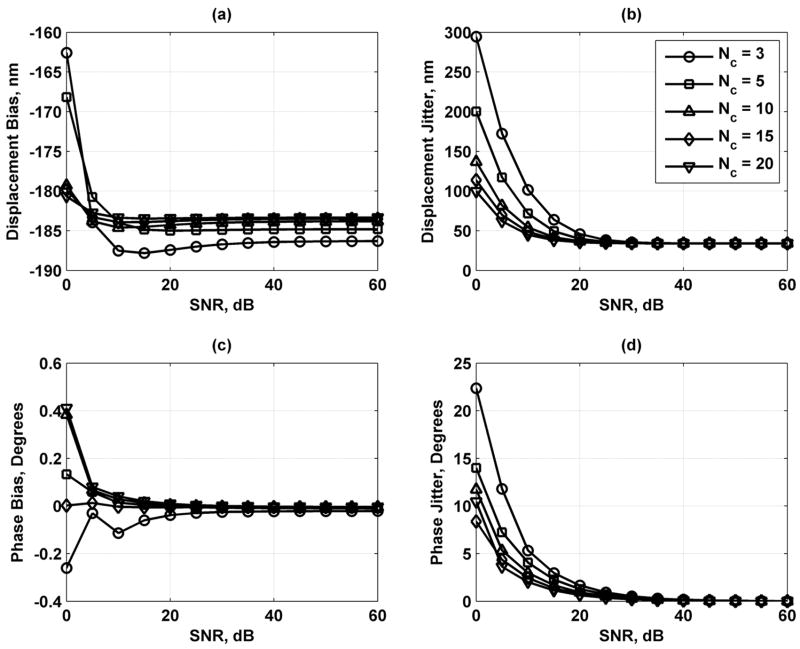
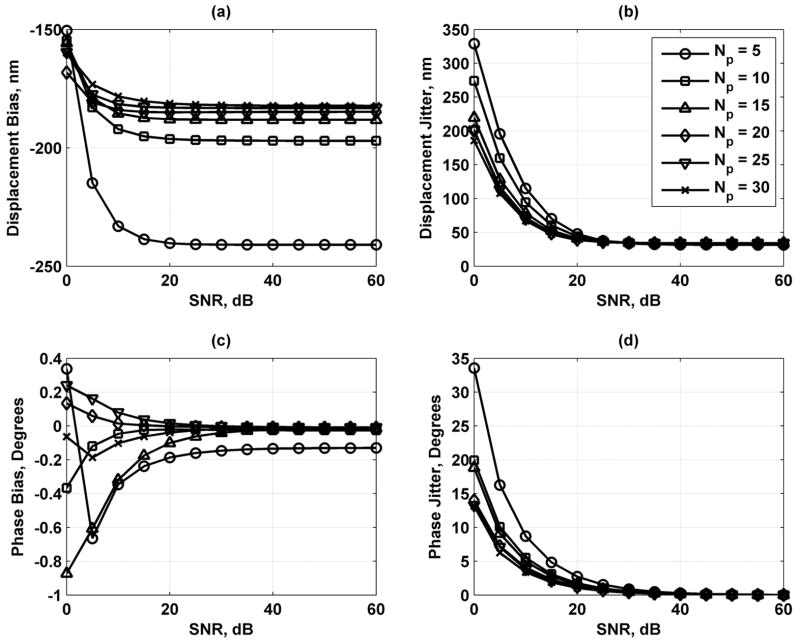
Fig. 5 shows the results of varying the displacement amplitude. The displacement bias and jitter decrease as D0 decreases. The phase bias and jitter decrease as the displacement amplitude increases. Fig. 6 shows the effects of varying the number of vibration cycles used for the motion detection. Displacement and phase jitter decrease as Nc increases, whereas the displacement and phase bias is not affected significantly by this parameter. In Fig. 7, the variation of the number of points sampled per vibration cycle shows that an increase in Np decreases the displacement bias and jitter and the phase jitter while having minimal effects on changing the phase bias.
Fig. 5.
Displacement and phase bias and jitter for displacement amplitude D0 = 100 (○), 500 (□), 1000 (Δ), 5000 (◇), and 10 000 (∇) nm. (a) Displacement bias; (b) displacement jitter; (c) phase bias; and (d) phase jitter. The legend in (d) applies to each panel.
Fig. 6.
Displacement and phase bias and jitter for number of vibration cycles Nc = 3 (○), 5 (□), 10 (Δ), 15 (◇), and 20 (∇). (a) Displacement bias; (b) displacement jitter; (c) phase bias; and (d) phase jitter. The legend in (b) applies to each panel.
Fig. 7.
Displacement and phase bias and jitter for number of points sampled per vibration cycle Np = 5 (○), 10 (□), 15 (Δ), 20 (◇), 25 (∇), and 30 (*). (a) Displacement bias; (b) displacement jitter; (c) phase bias; and (d) phase jitter. The legend in (b) applies to each panel.
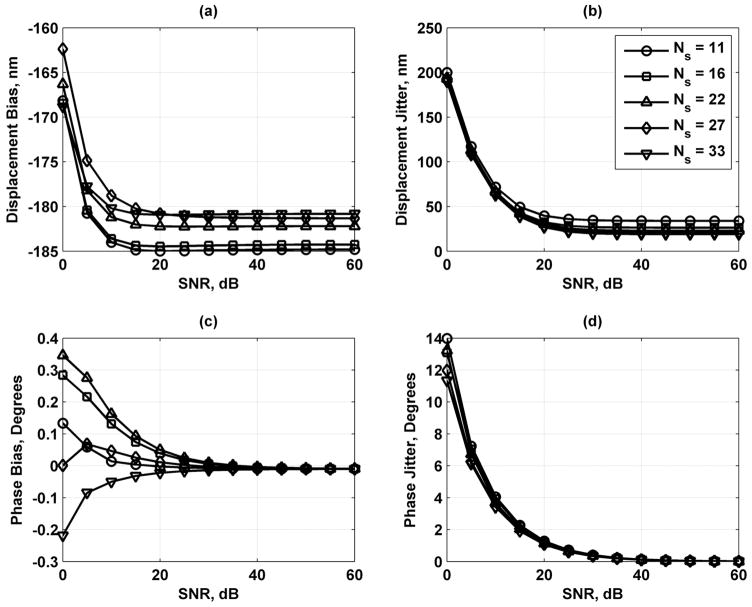
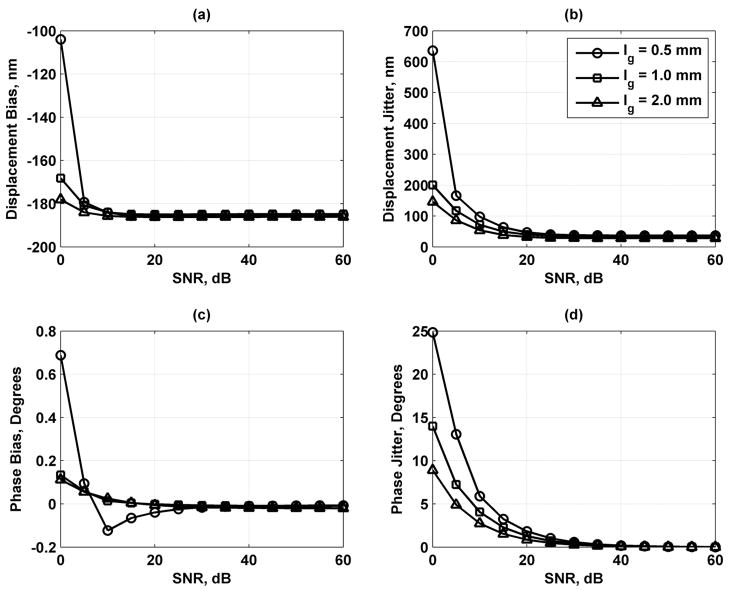
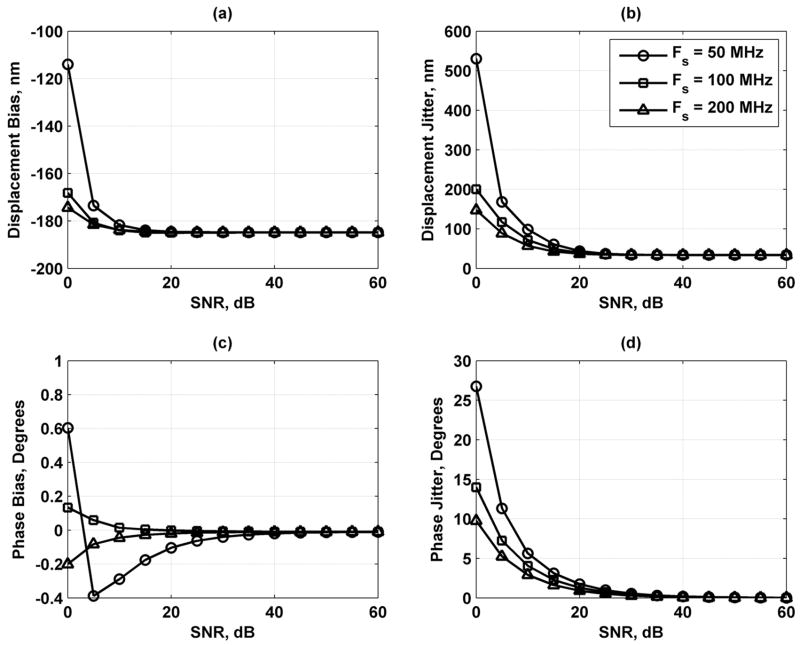
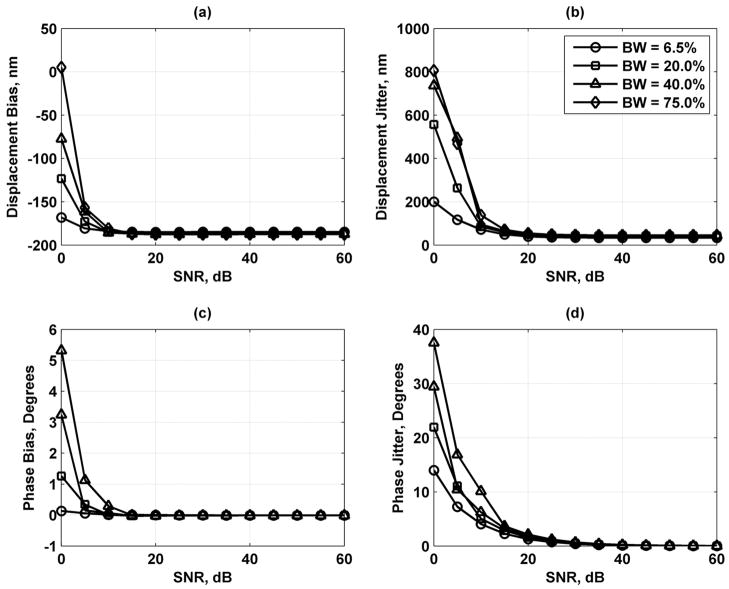
As the results in Fig. 8 show, increasing the number of scatterers contained in a resolution cell volume decreases the error in the displacement and phase estimates, but the variation is fairly small. Fig. 9 shows that lengthening the processing gate improves the displacement and phase results. Increasing the sampling frequency of the echoes also improves the displacement and phase jitter results as shown in Fig. 10. Fig. 11 shows that increasing the bandwidth of the tracking beam increases the error for both the displacement and phase, but the changes are only significant at low SNR.
Fig. 8.
Displacement and phase bias and jitter for number of scatterers/resolution cell volume Ns = 11 (○), 16 (□), 21 (Δ), 27 (◇), and 33 (∇). (a) Displacement bias; (b) displacement jitter; (c) phase bias; and (d) phase jitter. The legend in (b) applies to each panel.
Fig. 9.
Displacement and phase bias and jitter for range gate length lg = 0.5 (○), 1.0 (□), and 2.0 (Δ) mm. (a) Displacement bias; (b) displacement jitter; (c) phase bias; and (d) phase jitter. The legend in (b) applies to each panel.
Fig. 10.
Displacement and phase bias and jitter for sampling frequency Fs = 50 (○), 100 (□), and 200 (Δ) MHz. (a) Displacement bias; (b) displacement jitter; (c) phase bias; and (d) phase jitter. The legend in (b) applies to each panel.
Fig. 11.
Displacement and phase bias and jitter for transducer bandwidth BW = 6.5 (○), 20.0 (□), 40.0 (Δ), and 75.0 (◇) %. (a) Displacement bias; (b) displacement jitter; (c) phase bias; and (d) phase jitter. The legend in (b) applies to each panel.
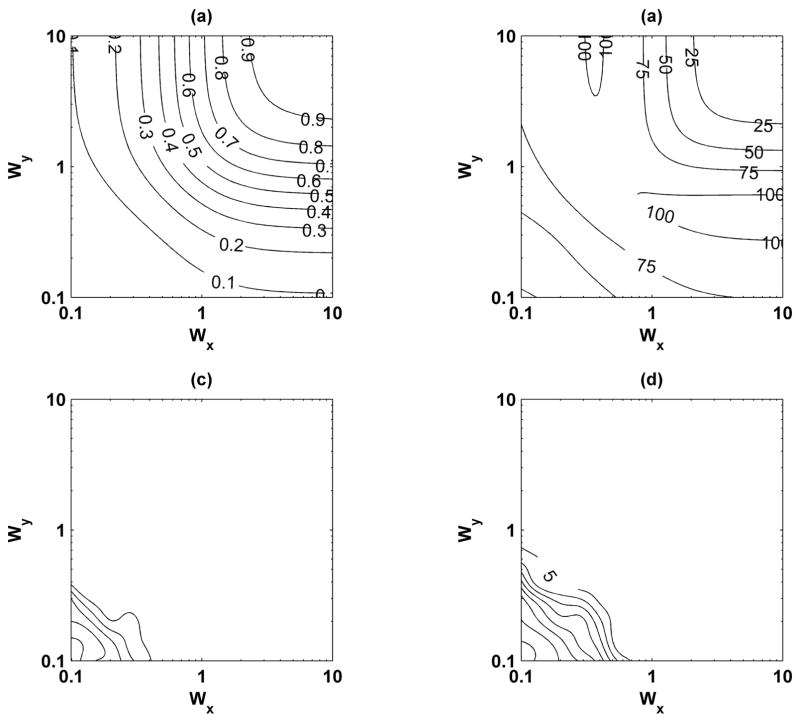
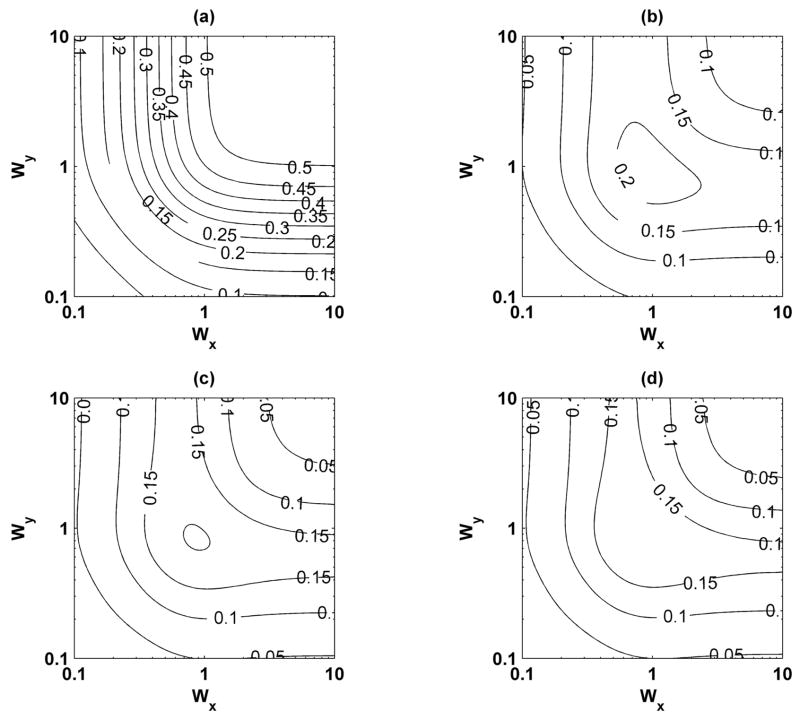
Variation of the beam shape parameters Wx, Wy, and Wz were carried out. An 11 × 11 grid of Wx and Wy was simulated with 100 iterations for each point. The results were interpolated to a 101 × 101 grid for display purposes. The normalized displacement is referenced to D0 = 1000 nm. Fig. 12 shows the normalized displacement, displacement jitter, and phase bias and jitter for Wz = 2.18. As was shown by McAleavey et al. [42], as Wx and Wy increase the normalized displacement increases, and the displacement jitter, phase bias, and phase jitter decrease. For the case Wx = Wy = 2.19, which describes the parameters for the experimental implementation, the normalized displacement is approximately 0.82, which is very close to the results found through the other simulations. The phase bias and jitter are smaller than 5° for Wx and Wy greater than 0.5. Fig. 13 shows the differences between the model proposed by McAleavey et al. [42] for Wz = 0.1, 0.5, 1.0, and 2.18. There are large differences, up to and greater than 0.5, when Wz = 0.1 and the differences decrease as Wz increases, which approaches the assumption made by McAleavey et al. that Wz → ∞. However, even as Wz increases, the errors can be as high as 0.15.
Fig. 12.
Motion detection results for variations of beam shape parameters Wx, Wy, and Wz = 2.18. (a) Normalized displacement; (b) displacement jitter in nanometers; (c) phase bias (distance between contour lines is 5° and first line begins at 5° closest to upper right corner); and (d) phase jitter in degrees (distance between contour lines is 10° and first line begins at 5°).
Fig. 13.
Differences of normalized displacement with reference to the theory of McAleavey et al. [42] for variations of beam shape parameters Wx, Wy, and Wz. (a) Wz = 0.1; (b) Wz = 0.5; (c) Wz = 1.0; and (d) Wz = 2.18.
B. Measurements of Motion in Gelatin Phantoms
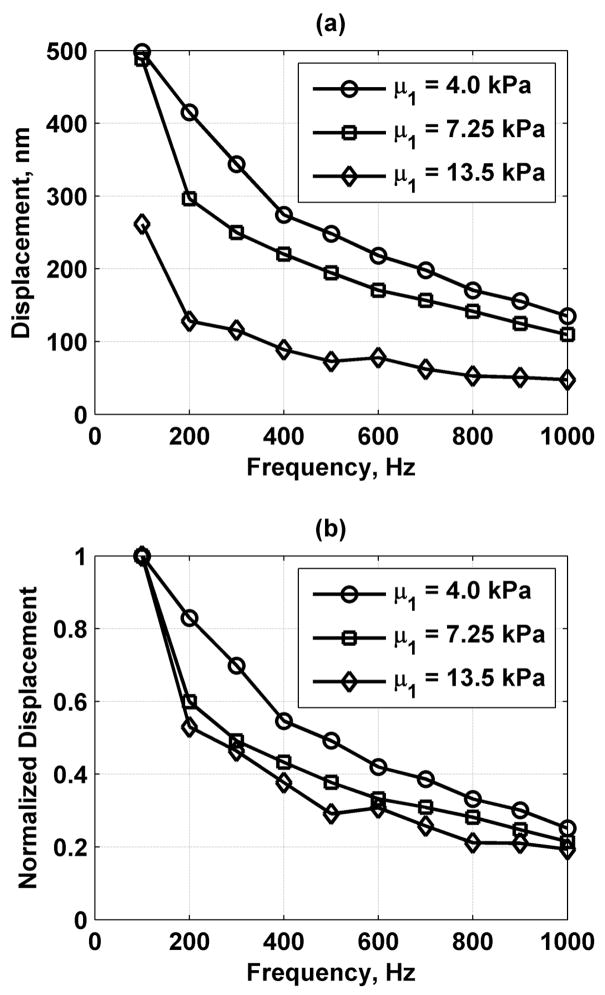
The shear elasticity for the phantoms with 8, 12, and 15% gelatin were 4.0, 7.25, and 13.5 kPa, respectively, while the shear viscosity was 1.0 Pa·s for all 3 phantoms. The frequency responses of the gelatin phantoms with different values of shear modulus are shown in Fig. 14. Fig. 14(a) shows the displacement values and Fig. 14(b) shows the same data normalized by the value at 100 Hz. The displacement decreases as a function of frequency. Differences between the frequency responses of the phantoms with different stiffness were observed both in the raw displacement values and in the normalized response.
Fig. 14.
Frequency responses of gelatin phantoms with different shear modulus values. (a) Displacement frequency response and (b) normalized frequency response where values are normalized by the displacement at 100 Hz.
C. Measurements of Motion in Bovine Muscle
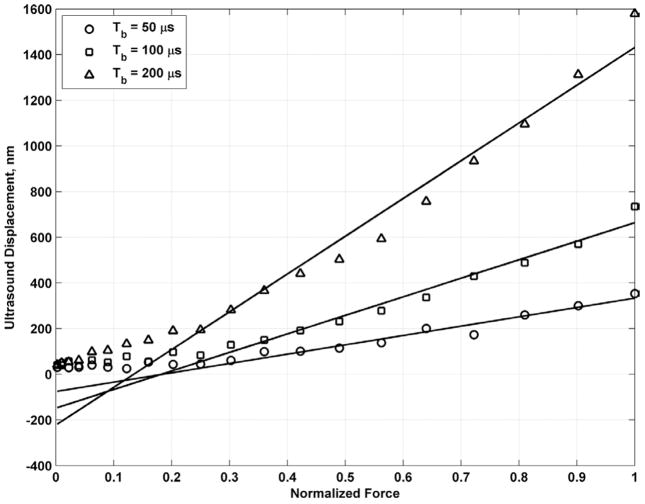
Fig. 15 shows the displacement results and regression for varying values of toneburst length, Tb = 50, 100, and 200 μs. For Tb = 50, 100, and 200 μs, fprf = 4.0, 4.0, and 2.5 kHz, respectively, while F = F0, fv = 200 Hz, and Ts = 100 ms. Regressions were performed with the 9, 11, and 13 highest samples for Tb = 50, 100, and 200 μs, respectively. The regression lines and R2 values for Tb = 50, 100, and 200 μs are y50 = 409.0482x − 75.0306 with R2 = 0.9417, y100 = 811.5938x − 147.3434 with R2 = 0.9761, y200 = 1653.9x − 222.1 with R2 = 0.9721. When the toneburst length doubled, the slope of the regression line fitting the data also nearly doubled as expected with slopes of 409, 812, and 1654 for Tb = 50, 100, and 200 μs, respectively. The threshold at which the data points level off was between 100 and 200 nm for each toneburst length. The data points level off because the displacement signal contains too much noise to make a reliable measurement. The normalized force at which this threshold was reached decreased as the toneburst length was increased, but the threshold represents a nearly constant value of force and resulting motion amplitude.
Fig. 15.
Regression of measured ultrasound displacement versus normalized force for different values of Tb in bovine muscle section. The regression line for Tb = 50 μs was computed for the 9 highest samples and the resulting equation is y50 = 409.0482x − 75.0306 with R2 = 0.9417. The regression line for Tb = 100 μs was computed for the 11 highest samples and the resulting equation is y100 = 811.5938x − 147.3434 with R2 = 0.9761. The regression line for Tb = 200 μs was computed for the 13 highest samples and the resulting equation is y200 = 1653.9x − 222.1 with R2 = 0.9721.
For a parameterized analysis, the data for Tb = 100 μs was analyzed and parameters such as normalized force, vibration frequency, fprf, and Ts were varied. The experimental parameters are summarized with their relationship to simulation parameters in Table II. For the following plots, each data point represents the mean of 5 measurements. The phase estimates were corrected for a frequency dependent phase shift because of the constant time delay associated with wave propagation between the transducer and focal region of the transducer and unwrapped for display. The results displayed were chosen to be above the threshold of accurate detection corresponding to about 0.3F0.
TABLE II.
Experimental Parameters.
| Experimental parameter | Description | Simulation parameter | Description |
|---|---|---|---|
| F0 | Normalized radiation force amplitude | D0 | Displacement amplitude |
| fprf | Pulse-echo repetition frequency | Np (fprf/fv) | Sampled points per vibration cycle |
| Ts | Slow-time processing window | Nc (Ts·fv) | Cycles of vibration |
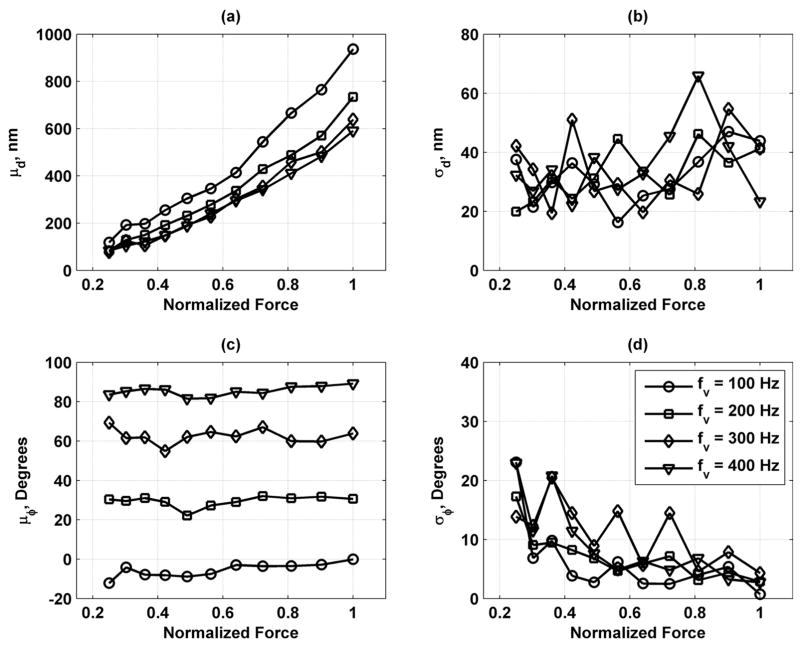
Fig. 16 shows mean and standard deviations of the displacement and phase measurements for fv = 100, 200, 300, and 400 Hz. The mean displacement, μd, varies linearly with the normalized force. The displacement amplitude decreases with increasing frequency, indicating a low-pass filter characteristic. The standard deviation of the displacement, σd, remains relatively constant versus the normalized force. The mean phase, μϕ, remains at a stable value versus normalized force for different values of fv. The standard deviation of phase, σϕ, decreases as normalized force increases and never rises above 25°.
Fig. 16.
Mean and standard deviations of displacement and phase measurements in bovine muscle section for values of fv = 100 (○), 200 (□), 300 (Δ), and 400 (∇) Hz. (a) Mean of displacement (μd); (b) standard deviation of displacement (σd); (c) mean of phase (μϕ); and (d) standard deviation of phase (σϕ). Legend in panel (d) applies to all panels.
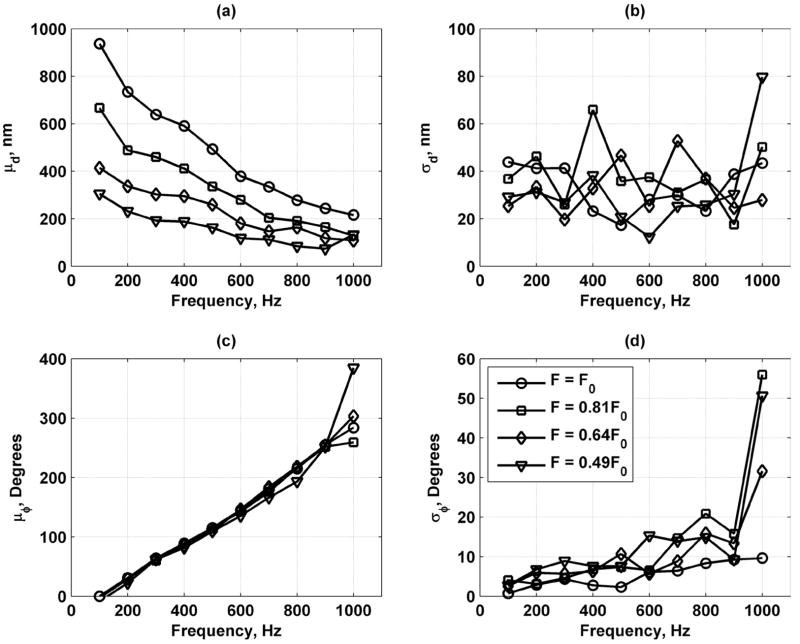
Fig. 17 shows the mean and standard deviation of the displacement and phase versus vibration frequency for different values of F = F0, 0.81F0, 0.64F0, and 0.49F0. The mean displacement decreases monotonically as frequency increases, indicating that the muscle acts as a low-pass filter for motion. For each frequency, the mean phase measured for different values of F was very close, except at fv = 1000 Hz. There is also a positive trend with frequency for μϕ. The σd remained relatively constant versus frequency; however, σϕ increases as frequency increases probably because μd is simultaneously decreasing to the threshold for accurate detection.
Fig. 17.
Mean and standard deviations of displacement and phase measurements in bovine muscle section for values of F = F0 (○), 0.81F0 (□), 0.64F0 (Δ), and 0.49F0 (∇). (a) Mean of displacement (μd); (b) standard deviation of displacement (σd); (c) mean of phase (μϕ) unwrapped for display; and (d) standard deviation of phase (σϕ). Legend in panel (d) applies to all panels.
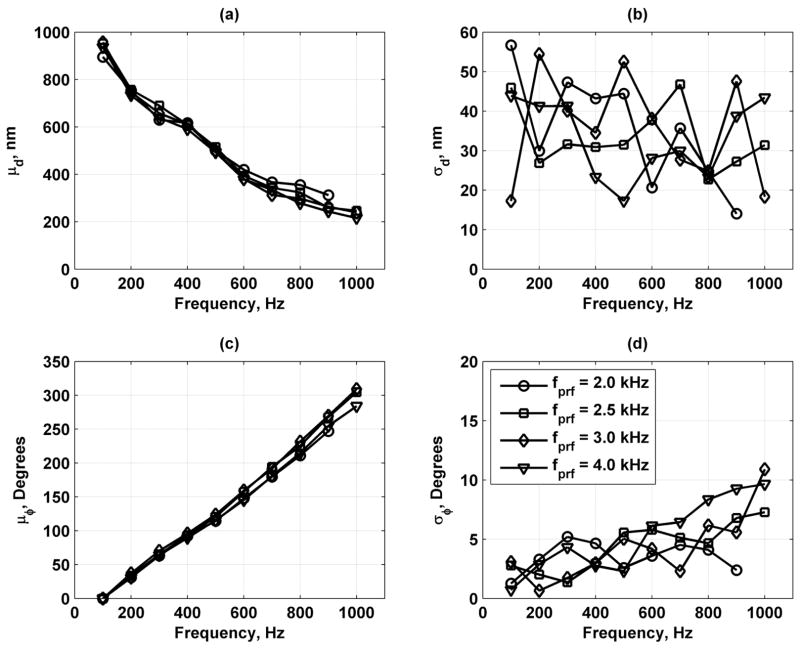
Fig. 18 shows results for variation of the fprf with values fprf = 2.0, 2.5, 3.0, and 4.0 kHz. The μd results match well for all values of fprf, which indicates that no aliasing occurred. The μϕ varied with fprf with the results for fprf = 3.0 and 4.0 kHz matching well while fprf = 2.0 and 2.5 kHz either underestimated or overestimated the mean phase values, respectively, assuming that increasing fprf provides better estimates. The σd remains fairly constant for all values of fprf.. The σϕ results match fairly well, showing an increasing trend as frequency increases.
Fig. 18.
Mean and standard deviations of displacement and phase measurements in bovine muscle section for values of fprf = 2.0 (○), 3.0 (□), 4.0 (Δ), and 5.0 (∇) kHz. (a) Mean of displacement (μd); (b) standard deviation of displacement (σd); (c) mean of phase (μϕ) unwrapped for display; and (d) standard deviation of phase (σϕ). Legend in panel (d) applies to all panels.
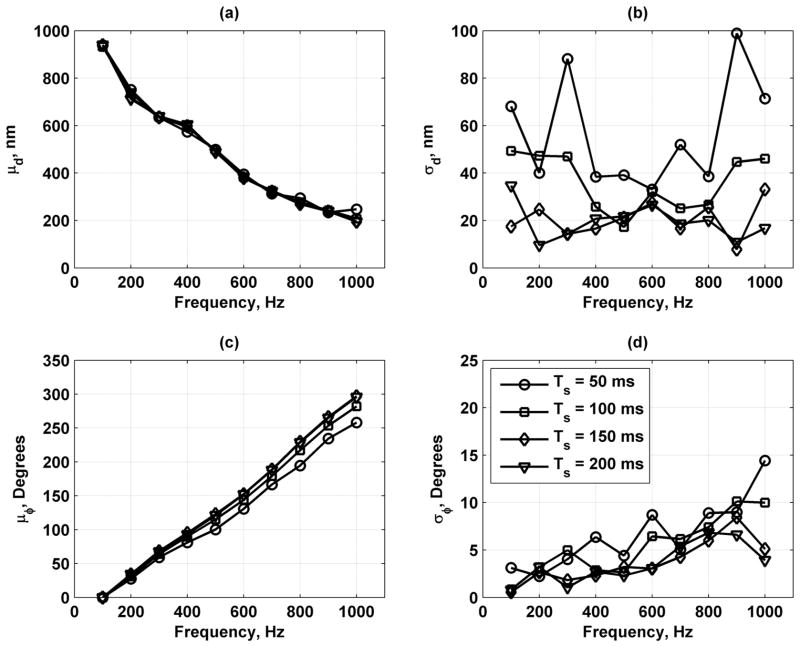
Fig. 19 provides results for variation of the slow time processing window, Ts = 50, 100, 150, and 200 ms. The μd and μϕ do not seem to change whereas noticeable decreases in the σd and σϕ were observed as Ts increased.
Fig. 19.
Mean and standard deviations of displacement and phase measurements in bovine muscle section for values of Ts = 50 (○), 100 (□), 150 (Δ), and 200 (∇) ms. (a) Mean of displacement (μd); (b) standard deviation of displacement (σd); (c) mean of phase (μϕ) unwrapped for display; and (d) standard deviation of phase (σϕ). Legend in panel (d) applies to all panels.
V. Discussion
A. Simulation Results Discussion
The variation of displacement amplitude showed that as D0 increases, the displacement bias and jitter increased. This agrees with expected results as the decorrelation due to different beam shapes dictated that the maximum detected amplitude would be less than 92% of the peak value. In these simulations at high SNR, the percent error turned out to be 18.5 ± 3.4%. If we just take into account the bias, the inclusion of the weighting of the excitation and tracking beam in the z-direction provides amplitude estimates that are 81.5% of the peak amplitude. Palmeri et al., reported that, in studies involving finite element simulations of displacement induced by radiation force, ultrasonic tracking of the motion could only achieve displacement estimates that were between 50 and 75% of the maximum amplitude using configurations with different f-numbers for excitation and tracking [21]. The results from this simulation study, which uses an f-number of 1.56, fall higher than the range of previously reported results, which holds promise for this method being implemented in a scattering medium such as tissue. As in the results reported by Urban and Greenleaf for the reflective target, similar trends were found in the error measures in varying SNR, D0, Nc, and Np [34].
As the density of the scatterers was increased, the error decreased slightly for both the displacement and phase. However, the changes were minimal, which leads to the conclusion that motion detection performance will not be drastically changed due to scatterer density. In the future, more study may need to be devoted to scatterer density, particularly for cases where fully developed speckle does not occur, with different beam shapes as this method is implemented with phased or linear array transducers.
Increasing parameters such as the processing gate length and sampling frequency decreased the error in the results. The longer processing gate takes into account the contributions from more scatterers and a longer section of the echoes to perform the cross-spectral analysis. Other studies have shown that lengthening the processing gate for motion detection can improve the displacement bias and jitter [21], [35], [37]. The increased sampling frequency also provides for higher temporal resolution for correlative analysis between consecutive echoes. A study by Pinton and Trahey showed that increasing the sampling rate through interpolation and then using cross correlation decreases the displacement bias and jitter [38].
The increase in the transducer bandwidth increased the error present in the results. This may be due to increased resolving of the scatterers, providing echoes that were not suitable for use in tracking motion. With low bandwidth, the echoes are smoother and have less variation in space. This may provide a more stable signal to perform the cross-spectral analysis.
The analysis of variation of the beam shapes can apply to any transducer that produces point-spread functions that can be modeled as 3-D Gaussian function. The use of Gaussian functions instead of precisely defined point-spread functions was chosen to explore the effects of beam shapes in a general sense. It was found that even as Wz increased, the normalized displacement could only achieve at most 81.5% of the peak value whereas with McAleavey’s theoretical development that ignored the variation of Wz predicted that 92% of the peak displacement could be obtained with Wx = Wy = 2.19. It was found but not shown that as Wz was increased to 5 and 10, that the results did not change significantly from those with Wz = 2.18. The phase bias and jitter were not as sensitive to Wz and remained relatively constant for Wz greater than or equal to 0.5. The 3-D beam shape model elucidates a more complete way to analyze how beam shape, particularly in the axial direction, can affect displacement results, and these results can be extended to other methods and applications that perform motion detection either for harmonic motion or more complicated motion. Also, in future work, more specific point-spread function shapes may be used for this type of analysis.
The motion detection model also gave perspective on which parameters are most important for error reduction in measurements. One thousand realizations were used for the simulation analysis. This was motivated by the work described in [20], [35], [36], [38], which used 1000 realizations. In other studies [21], [37], 100 realizations were used. It was found in retrospective study that 100 realizations gave very similar results to that given by 1000 realizations, but the results from 1000 simulations were used for completeness. The error terms are reduced by an exponential decay with increasing SNR. It was observed that errors were reduced significantly for SNR ≥20 dB. It was found that displacement bias and jitter reductions were sensitive to decreasing D0 and increasing Np. Reductions of phase jitter were sensitive to increases in D0, Nc, Np, lg and Fs. Phase bias reductions were most sensitive to increasing SNR and D0. The results presented here provide a guide to achieve reliable and accurate results as well as a measure to provide levels of confidence in the measurements.
This simulation model provides insights into implementing motion detection for use in tissue after radiation force excitation. Accurate displacement results will not be possible due to the weighting of the beam shapes. However, displacement could still be used in model-based approaches with this limitation taken into account.
In applications involving shear wave speed estimation, this model can also be useful. Shear wave speed of a harmonic shear wave can be calculated after measuring the wave’s phase at two different locations [25]. This model provides insights on how to minimize the phase bias and jitter in the estimates. The most important parameters for optimizing phase estimation are to increase the displacement amplitude and SNR.
The simulation model at present assumes a stationary system. However, in an in vivo setting, there will be physiological motion due to the beating heart, pulsatile blood flow in tissue, and breathing. These gross motions are much larger than the small motion that we are trying to detect. Zheng et al. has proposed modifications to the Kalman filter used to address these concerns and, even with large gross motion and acceleration, the small displacement amplitude and the vibration phase was recovered [45].
In future work, it will be of interest to construct an analytic model with the parameters used in the simulation study as inputs and quantify the bias and jitter after the cross-spectral analysis of the echoes and application of the Kalman filter. This type of model would be extremely useful in optimizing motion detection.
B. Motion Detection Experiment Discussion
Results for excitation and measurement of motion in gelatin phantoms and a section of bovine muscle were shown. It should be noted that all measurements were acquired with the HPE technique and results were obtained at the frequency components of interest. The information for all the frequency components can be obtained in one measurement acquisition that with previous techniques would have required multiple acquisitions. The results from the gelatin phantoms show that the frequency responses are different for materials of different stiffness. The normalized response is important for comparing different tissues and different materials. The results from the bovine muscle indicate that small harmonic motion can be measured with good precision, which provides confidence in the displacement measurements.
When the vibration frequency was varied, the displacement amplitude decreased as frequency increased, indicating a low-pass filter characteristic. The decreases in displacement amplitude are due both to decreased radiation force amplitude and the tissue response. With the toneburst lengths and toneburst repetition frequencies used, the frequency components for 100 to 1000 Hz have about the same amplitude as shown in Fig. 1. With these force components being nearly equal, the decreases in displacement amplitude can be attributed to the tissue response. The phase measurements also exhibited high precision. As the acquisition parameters were optimized toward large amplitude vibration and high fprf, the σϕ could be reduced to less than 5°. When varying fprf, the mean phase values do not agree and indicates that phase bias may be about ± 10°.
The results for motion detection in the bovine muscle also agree well with the simulation results. For comparisons with the simulation results, it should be noted that the experimental SNR was near 40 dB. In the simulations, it was shown that by increasing Ts, which corresponds to an increase in Nc would decrease the variation or jitter in the displacement measurements. The results in the muscle show that σd remains constant versus normalized force and frequency. The σϕ decreases as the normalized force increases and as frequency decreases because a lower vibration frequency correlates with larger displacement amplitudes agreeing with increases in D0. The increase of fprf, related to an increase in Np, did not show a consistent trend toward decreasing σϕ, whereas increasing Ts did show a decrease in σϕ. The experiment confirms that increases in D0 and Nc reduce variation in phase measurements and that reliable measurements can be performed for motion with amplitudes down to 100 to 200 nm.
VI. Conclusions
The model of a vibrating scattering medium has direct application to modeling harmonic motion detection in tissue. A parameterized analysis was performed to assess the effects different parameters have on the vibration displacement and phase results. Different excitation and tracking beam shapes produced different bias in the displacement results. The phase errors were decreased by increasing the displacement amplitude. This model provides a platform for testing different experimental settings with different parameters.
Experimental multifrequency radiation force excitation and motion detection was performed in gelatin phantoms and a section of bovine muscle. The results from the gelatin phantoms showed that materials with different shear modulus exhibited different displacement frequency responses. A parameterized analysis of motion detection in a section of bovine muscle was performed. As in the simulations, it was found that larger vibration amplitudes reduce the jitter in both displacement and phase measurements. These experimental results provide confidence in measuring displacement and phase with high precision in tissue.
Acknowledgments
The authors are grateful to Randall Kinnick for experimental support, Thomas Kinter for software support, and Jennifer Milliken for administrative assistance. M.W.U. acknowledges Dr. Yi Zheng for helpful correspondence and MATLAB code for the Kalman filter.
This work was supported in part by grants EB002640 and EB002167 from the National Institutes of Health.
Biographies
Matthew W. Urban (S’02–M’07) was born in Sioux Falls, SD, on February 25, 1980. He received the B.S. degree in electrical engineering at South Dakota State University, Brookings, in 2002 and the Ph.D. degree in biomedical engineering at the Mayo Clinic College of Medicine in Rochester, MN, in 2007.
He has been a Summer Undergraduate Fellow at the Mayo Clinic Biomechanics Laboratory. His current research interests are ultrasonic signal and image processing, vibro-acoustography, and vibrometry applications.
Dr. Urban is a member of Eta Kappa Nu, Tau Beta Pi, and the Acoustical Society of America.

Shigao Chen (M’02) received the B.S. and M.S. degrees in biomedical engineering from Tsinghua University, China, in 1995 and 1997, respectively, and the Ph.D. degree in biomedical imaging from the Mayo Graduate School, Rochester, MN, in 2002. He is currently assistant professor at the Mayo Graduate School and research associate in the Department of Biomedical Engineering, Mayo Clinic College of Medicine. His research interest is noninvasive quantification of viscoelastic properties of soft tissue using ultrasound.

James F. Greenleaf (M’73–SM’84–F’88) was born in Salt Lake City, UT, on February 10, 1942. He received the B.S. degree in electrical engineering from the University of Utah, Salt Lake City, in 1964, the M.S. degree in engineering science from Purdue University, Lafayette, IN, in 1968, and the Ph.D. degree in engineering science from the Mayo Graduate School of Medicine, Rochester, MN, and Purdue University in 1970. He is currently professor of biophysics and associate professor of medicine at the Mayo Medical School, and consultant in the Department of Physiology, Biophysics, and Cardiovascular Disease and Medicine, Mayo Foundation.
He has served on the IEEE Technical Committee for the Ultrasonics Symposium for five years. He served on the IEEE Ultrasonics, Ferroelectrics, and Frequency Control Society (UFFC-S) Subcommittee on Ultrasonics in Medicine/IEEE Measurement Guide Editors and on the IEEE Medical Ultrasound Committee. Doctor Greenleaf was president of the UFFC-S in 1992 and 1993 and is currently vice president for Ultrasonics.
Dr. Greenleaf has 12 patents and is recipient of the 1986 J. Holmes Pioneer Award and the 1998 William J. Fry Memorial Lecture Award from the American Institute of Ultrasound in Medicine. He is a Fellow of IEEE, American Institute of Ultrasound in Medicine, and American Institute for Medical and Biological Engineering. Dr. Greenleaf was the Distinguished Lecturer for IEEE Ultrasonics, Ferroelectrics, and Frequency Control Society (1990/1991). His special field of interest is ultrasonic biomedical science, and he has published more than 327 articles and edited or authored five books in the field.

References
- 1.Krouskop TA, Wheeler TM, Kallel F, Garra BS, Hall T. Elastic moduli of breast and prostate tissues under compression. Ultrason Imaging. 1998 Oct;20:260–274. doi: 10.1177/016173469802000403. [DOI] [PubMed] [Google Scholar]
- 2.Yeh WC, Li PC, Jeng YM, Hsu HC, Kuo PL, Li ML, Yang PM, Lee PH. Elastic modulus measurements of human liver and correlation with pathology. Ultrasound Med Biol. 2002 Apr;28:467–474. doi: 10.1016/s0301-5629(02)00489-1. [DOI] [PubMed] [Google Scholar]
- 3.Schaar JA, de Korte CL, Mastik F, Baldewsing R, Regar E, de Feyter P, Slager CJ, van der Steen AF, Serruys PW. Intravascular palpography for high-risk vulnerable plaque assessment. Herz. 2003 Sept;28:488–495. doi: 10.1007/s00059-003-2488-6. [DOI] [PubMed] [Google Scholar]
- 4.Vahabi M. Breast cancer screening methods: A review of the evidence. Health Care Women Int. 2003 Nov;24:773–793. doi: 10.1080/07399330390229957. [DOI] [PubMed] [Google Scholar]
- 5.McKnight AL, Kugel JL, Rossman PJ, Manduca A, Hartmann LC, Ehman RL. MR elastography of breast cancer: Preliminary results. AJR Am J Roentgenol. 2002 June;178:1411– 1417. doi: 10.2214/ajr.178.6.1781411. [DOI] [PubMed] [Google Scholar]
- 6.Wilt TJ, Thompson IM. Clinically localised prostate cancer. BMJ. 2006 Nov. 25;333:1102–1106. doi: 10.1136/bmj.39022.423588.DE. [DOI] [PMC free article] [PubMed] [Google Scholar]
- 7.Sugimoto T, Ueha S, Itoh K. Tissue hardness measurement using the radiation force of focused ultrasound. IEEE Int Ultrasonics Symp. 1990:1377–1380. [Google Scholar]
- 8.Sarvazyan AP, Rudenko OV, Swanson SD, Fowlkes JB, Emelianov SY. Shear wave elasticity imaging: A new ultrasonic technology of medical diagnostics. Ultrasound Med Biol. 1998 Nov;24:1419–1435. doi: 10.1016/s0301-5629(98)00110-0. [DOI] [PubMed] [Google Scholar]
- 9.Fatemi M, Greenleaf JF. Ultrasound-stimulated vibro-acoustic spectrography. Science. 1998 Apr. 3;280:82–85. doi: 10.1126/science.280.5360.82. [DOI] [PubMed] [Google Scholar]
- 10.Fatemi M, Greenleaf JF. Vibro-acoustography: An imaging modality based on ultrasound-stimulated acoustic emission. Proc Natl Acad Sci USA. 1999 June 8;96:6603–6608. doi: 10.1073/pnas.96.12.6603. [DOI] [PMC free article] [PubMed] [Google Scholar]
- 11.Walker WF, Fernandez FJ, Negron LA. A method of imaging viscoelastic parameters with acoustic radiation force. Phys Med Biol. 2000 June;45:1437–1447. doi: 10.1088/0031-9155/45/6/303. [DOI] [PubMed] [Google Scholar]
- 12.Nightingale KR, Palmeri ML, Nightingale RW, Trahey GE. On the feasibility of remote palpation using acoustic radiation force. J Acoust Soc Am. 2001 July;110:625–634. doi: 10.1121/1.1378344. [DOI] [PubMed] [Google Scholar]
- 13.Bercoff J, Tanter M, Fink M. Supersonic shear imaging: A new technique for soft tissue elasticity mapping. IEEE Trans Ultrason Ferroelectr Freq Control. 2004 Apr;51:396–409. doi: 10.1109/tuffc.2004.1295425. [DOI] [PubMed] [Google Scholar]
- 14.Konofagou EE, Hynynen K. Localized harmonic motion imaging: Theory, simulations and experiments. Ultrasound Med Biol. 2003 Oct;29:1405–1413. doi: 10.1016/s0301-5629(03)00953-0. [DOI] [PubMed] [Google Scholar]
- 15.Michishita K, Hasegawa H, Kanai H. Ultrasonic measurement of minute displacement of object cyclically actuated by acoustic radiation force. Jpn J Appl Phys. 2003 July;42:4608–4612. [Google Scholar]
- 16.Holen J, Waag RC, Gramiak R. Representations of rapidly oscillating structures on the Doppler display. Ultrasound Med Biol. 1985 Mar.-Apr;11:267–272. doi: 10.1016/0301-5629(85)90125-5. [DOI] [PubMed] [Google Scholar]
- 17.Kasai C, Namekawa K, Koyano A, Omoto R. Real-time two-dimensional blood flow imaging using an autocorrelation technique. IEEE Trans Son Ultrason SU-32. 1985:458–464. [Google Scholar]
- 18.Loupas T, Peterson RB, Gill RW. Experimental evaluation of velocity and power estimation for ultrasound blood-flow imaging, by means of a 2-dimensional autocorrelation approach. IEEE Trans Ultrason Ferroelectr Freq Control. 1995 July;42:689– 699. [Google Scholar]
- 19.O’Donnell M, Skovoroda AR, Shapo BM, Emelianov SY. Internal displacement and strain imaging using ultrasonic speckle tracking. IEEE Trans Ultrason Ferroelectr Freq Control. 1994;41(3):314–325. [Google Scholar]
- 20.Viola F, Walker WF. A comparison of the performance of time-delay estimators in medical ultrasound. IEEE Trans Ultrason Ferroelectr Freq Control. 2003 Apr;50:392–401. doi: 10.1109/tuffc.2003.1197962. [DOI] [PubMed] [Google Scholar]
- 21.Palmeri ML, McAleavey SA, Trahey GE, Nightingale KR. Ultrasonic tracking of acoustic radiation force-induced displacements in homogeneous media. IEEE Trans Ultrason Ferroelectr Freq Control. 2006 July;53:1300–1313. doi: 10.1109/tuffc.2006.1665078. [DOI] [PMC free article] [PubMed] [Google Scholar]
- 22.Hasegawa H, Kanai H. Improving accuracy in estimation of artery-wall displacement by referring to center frequency of RF echo. IEEE Trans Ultrason Ferroelectr Freq Control. 2006 Jan;53:52–63. doi: 10.1109/tuffc.2006.1588391. [DOI] [PubMed] [Google Scholar]
- 23.Zheng Y, Chen S, Tan W, Kinnick R, Greenleaf JF. Detection of tissue harmonic motion induced by ultrasonic radiation force using pulse-echo ultrasound and Kalman filter. IEEE Trans Ultrason Ferroelectr Freq Control. 2007 Feb;54:290–300. doi: 10.1109/tuffc.2007.243. [DOI] [PubMed] [Google Scholar]
- 24.Nightingale K, McAleavey S, Trahey G. Shear-wave generation using acoustic radiation force: In vivo and ex vivo results. Ultrasound Med Biol. 2003 Dec;29:1715–1723. doi: 10.1016/j.ultrasmedbio.2003.08.008. [DOI] [PubMed] [Google Scholar]
- 25.Chen S, Fatemi M, Greenleaf JF. Quantifying elasticity and viscosity from measurement of shear wave speed dispersion. J Acoust Soc Am. 2004 June;115:2781–2785. doi: 10.1121/1.1739480. [DOI] [PubMed] [Google Scholar]
- 26.Konofagou EE, Ottensmeyer M, Agabian S, Dawson SL, Hynynen K. Estimating localized oscillatory tissue motion for assessment of the underlying mechanical modulus. Ultrasonics. 2004 Apr;42:951–956. doi: 10.1016/j.ultras.2003.12.001. [DOI] [PubMed] [Google Scholar]
- 27.Chen S, Fatemi M, Greenleaf JF. Remote measurement of material properties from radiation force induced vibration of an embedded sphere. J Acoust Soc Am. 2002 Sept;112:884–889. doi: 10.1121/1.1501276. [DOI] [PubMed] [Google Scholar]
- 28.Zhang XM, Fatemi M, Kinnick RR, Greenleaf JF. Noncontact ultrasound stimulated optical vibrometry study of coupled vibration of arterial tubes in fluids. J Acoust Soc Am. 2003 Mar;113:1249–1257. doi: 10.1121/1.1548154. [DOI] [PubMed] [Google Scholar]
- 29.Zhang X, Zeraati M, Kinnick RR, Greenleaf JF, Fatemi M. Vibration mode imaging. IEEE Trans Med Imaging. 2007 June;26:843–852. doi: 10.1109/TMI.2007.895463. [DOI] [PubMed] [Google Scholar]
- 30.Zhang X, Greenleaf JF. Noninvasive generation and measurement of propagating waves in arterial walls. J Acoust Soc Am. 2006 Feb;119:1238–1243. doi: 10.1121/1.2159294. [DOI] [PubMed] [Google Scholar]
- 31.Zaitsev A, Raymond R, Thierman J, Juste J, Hynynen K. Focused ultrasound thermal surgery, imaging, and elastometry using the same phase array: feasibility study. IEEE Ultrasonics, Ferroelectrics, and Frequency Control Joint 50th Anniv. Conf; Montreal, Canada. 2004. pp. 2231–2234. [Google Scholar]
- 32.Urban MW, Kinnick RR, Greenleaf JF. Measuring the phase of vibration of spheres in a viscoelastic medium as an image contrast modality. J Acoust Soc Am. 2005 Dec;118:3465–3472. doi: 10.1121/1.2130947. [DOI] [PubMed] [Google Scholar]
- 33.Chen S, Silva GT, Kinnick RR, Greenleaf JF, Fatemi M. Measurement of dynamic and static radiation force on a sphere. Phys Rev E Stat Nonlin Soft Matter Phys. 2005 May;71 doi: 10.1103/PhysRevE.71.056618. art. no. 056618. [DOI] [PubMed] [Google Scholar]
- 34.Urban MW, Greenleaf JF. Harmonic pulsed excitation and motion detection of a vibrating reflective target. J Acoust Soc Am. 2008;123:519–533. doi: 10.1121/1.2805666. [DOI] [PubMed] [Google Scholar]
- 35.Walker WF, Trahey GE. A fundamental limit on delay estimation using partially correlated speckle signals. IEEE Trans Ultrason Ferroelectr Freq Control. 1995 Mar;42:301–308. [Google Scholar]
- 36.Viola F, Walker WF. A spline-based algorithm for continuous time-delay estimation using sampled data. IEEE Trans Ultrason Ferroelectr Freq Control. 2005 Jan;52:80–93. doi: 10.1109/tuffc.2005.1397352. [DOI] [PubMed] [Google Scholar]
- 37.Pinton GF, Dahl JJ, Trahey GE. Rapid tracking of small displacements with ultrasound. IEEE Trans Ultrason Ferroelectr Freq Control. 2006 June;53:1103–1117. doi: 10.1109/tuffc.2006.1642509. [DOI] [PubMed] [Google Scholar]
- 38.Pinton GF, Trahey GE. Continuous delay estimation with polynomial splines. IEEE Trans Ultrason Ferroelectr Freq Control. 2006 Nov;53:2026–2035. doi: 10.1109/tuffc.2006.143. [DOI] [PubMed] [Google Scholar]
- 39.Goodman JW. Some fundamental properties of speckle. J Opt Soc Am. 1976;66(11):1145–1150. [Google Scholar]
- 40.Weng L, Reid JM, Shankar PM, Soetanto K, Lu XM. Nonuniform phase distribution in ultrasound speckle analysis–Part I: Background and experimental demonstration. IEEE Trans Ultrason Ferroelectr Freq Control. 1992;39(3):352–359. doi: 10.1109/58.143169. [DOI] [PubMed] [Google Scholar]
- 41.Zatari D, Botros N, Dunn F. A simulation algorithm for ultrasound liver backscattered signals. Ultrasonics. 1995 Nov;33:469–474. doi: 10.1016/0041-624x(95)00059-c. [DOI] [PubMed] [Google Scholar]
- 42.McAleavey SA, Nightingale KR, Trahey GE. Estimates of echo correlation and measurement bias in acoustic radiation force impulse imaging. IEEE Trans Ultrason Ferroelectr Freq Control. 2003 June;50:631–641. doi: 10.1109/tuffc.2003.1209550. [DOI] [PubMed] [Google Scholar]
- 43.Zheng Y, Chen S, Tan W, Greenleaf JF. Kalman filter motion detection for vibro-acoustography using pulse echo ultrasound. IEEE Int Ultrasonics Symp. 2003:1812–1815. [Google Scholar]
- 44.Bracewell RN. The Fourier Transform and Its Applications. 3. Boston, MA: McGraw Hill; 2000. [Google Scholar]
- 45.Zheng Y, Yao A, Chen S, Greenleaf JF. IEEE Int Ultrasonics Symp. Vancouver, B. C; Canada: 2006. Measurement of shear wave using ultrasound and kalman filter with large background motion for cardiovascular studies; pp. 718–721. 2006. [Google Scholar]


