Abstract
Purpose
This article integrates published acoustic data on the development of vowel production. Age specific data on formant-frequencies are considered in the light of information on the development of the vocal tract (VT) to create an anatomic-acoustic description of the maturation of the vowel acoustic space for English.
Method
Literature searches identified 14 studies reporting data on vowel formant-frequencies. Data on corner vowels are summarized graphically to show age/sex related changes in the area and shape of the traditional vowel quadrilateral.
Conclusions
Vowel development is expressed as: (a) establishment of a language-appropriate acoustic representation (e.g., F1-F2 quadrilateral or F1-F2-F3 space), (b) gradual reduction in formant-frequencies and F1-F2 area with age, (c) reduction in formant-frequency variability, (d) emergence of male-female differences in formant-frequency by age 4 years with more apparent differences by 8 years, (e) jumps in formant-frequency at ages corresponding to growth spurts of the VT, and (f) a decline of f0 after age 1, with the decline being more rapid during early childhood and adolescence. Questions remain about optimal procedures for VT normalization, and the exact relationship between VT growth and formant-frequencies. Comments are included on nasalization and vocal fundamental-frequency as they relate to the development of vowel production.
Keywords: vowels, speech development, formant frequencies, nasalization, vocal fundamental frequency, vocal tract development
I. Introduction
A half-century ago, Peterson and Barney (1952) published their classic article on vowel formant patterns in men, women, and children, showing that formant frequencies for vowels differ substantially across speakers from different age-sex groupings. Ensuing research has enriched the database on vowel acoustics, and the primary intent of the present paper is to consolidate these data into an acoustic portrait of the development of the vowel space from infancy to adulthood in both males and females. The acoustic portrait is supported by information on the anatomic development of the vocal tract, derived primarily from the imaging methods of magnetic resonance imaging and computed tomography.
Acoustic methods are a valuable tool in the study of speech development and its disorders, especially because these methods are generally non-invasive, can be readily performed with modern computer systems, and are applicable to a variety of utterance types recorded in laboratory or naturalistic environments. A large number of high-quality recordings of children's speech are increasingly available for a variety of utterance types, including babbling, early word productions, and conversation. Therefore, a potentially large database is available for the study of speech development and the adaptation of technologies such as speech recognition and speech synthesis to children. As tools for the study of speech development, acoustic studies overcome some of the limitations of perceptual methods such as biases in phonetic transcription, and they avoid the encumbrances common to many physiologic methods such as electromyography and movement transduction. To be sure, acoustic analyses have limitations of their own (Kent, 1976; Kent & Read, 2002; Traunmuller & Eriksson, 1997), but technological advances, especially in digital signal processing, enhance the validity and reliability of acoustic analyses of children's speech.
An ultimate goal is the integration of acoustic data with anatomic, physiologic, and perceptual data, to produce a comprehensive account of patterns in the development of speech. Such a synthesis would facilitate the interpretation of acoustic data with respect to the other domains of study. This review focuses on the vowel acoustic space in children's speech, interpreted with respect to information on the anatomic development of the vocal tract. This focus was chosen because of the availability of studies that span the developmental period from infancy to adulthood. The primary data under review are the formant frequencies and vocal fundamental frequency associated with vowel production by speakers of various ages and both sexes. The current effort is an update of one part of an earlier paper that had a similar goal of summarizing acoustic data on speech development (Kent, 1976). Vowels are important in their own right, but acoustic data on vowels also inform several other topics, including the acoustic cues for consonants (e.g., formant transitions for consonant-vowel or vowel-consonant sequences), speaker normalization (which is usually based on formant frequencies), and prosodic patterns of speech (given that vowels carry a substantial part of prosodic information). In short, vowels are central to an understanding of the acoustic properties of speech. Because vowels appear early in speech development they are important milestones in the study of speech development. Children achieve a high degree of accuracy in producing non-rhotic vowels by the age of 36 months (Donegan, 2002; Ferguson & Farwell, 1975; Irwin & Wong, 1983; Templin, 1957). This relatively early mastery of vowels relative to many consonants gives vowels a developmental primacy in the establishment of a phonological system.
Acoustic measures of children's speech have a number of applications, including the study of speech development, clinical assessment of speech disorders, technically-based interventions for speech disorders, and development of speech recognition systems and speech synthesis systems suitable for children's voices. However, as considered in more detail later in this paper, children's speech presents a number of challenges to acoustic analysis. Acoustic measures of children's speech potentially reflect several developmental processes, including the growth of vocal tract structures (and sex differences in these growth patterns), changes in the relative geometry of the components of the vocal tract, maturation of speech motor control, and convergence on the phonetic patterns of adult speech. These processes are largely concurrent or overlapping, and they may be interactive in their effects. Even though phonetic mastery is typically considered complete by the age of about eight years, speech development in its finer respects is a protracted process that appears to extend to the late teens in both boys and girls (Smith & Goffman, 2004). Interpretation of acoustic data is accordingly challenging, and it would be helpful if the effects of biological factors (such as the growth of the physical apparatus) could be distinguished from factors that reflect phonetic and motor learning.
Contemporary tools allow for a much-improved description of anatomic-acoustic relationships and these are part of the foundation for a fuller understanding of speech development. Developmental anatomy is discussed separately for the supralaryngeal, laryngeal, and velopharyngeal systems in sections II, III & IV respectively. These discussions highlight anatomic changes, which provide the biological constraints for speech production, and are critical to the interpretation of developmental acoustic measures.
A. Developmental Patterns in Acoustic Variables: Age-sex effects
Chronologic age and speaker sex are the two major determinants of the acoustic properties of speech within a given language. Although chronologic age is not necessarily the preferred independent variable in studies of development or maturation, it is the most frequently reported subject descriptor across studies, and, in fact, is typically the only reported index (Kent & Vorperian, 1995). Therefore, chronologic age is the default independent variable used in this developmental description. Combined with speaker sex, chronologic age is the index for studies of maturation and growth.
II. Acoustic Correlates of Vocal Tract Length Development
The most dramatic effect of growth and development of the vocal tract on vowel production is on formant frequencies, which decrease as the vocal tract lengthens. Vocal tract length in neonates is about 6 to 8 cm, compared to an average length in adult females of about 15 cm and in adult males of about 18 cm. We begin this part of the discussion by reviewing recent data on vocal tract anatomy derived primarily from imaging studies.
A. Anatomic Considerations
Magnetic resonance imaging (MRI) has enabled some of the most comprehensive studies on the growth of the upper airway. This method presents no known biohazard and can be used with subjects of all ages to image both hard and soft tissues in selected planes. Because of the scan time needed for MRI studies and the need to stabilize the head for satisfactory imaging, infants and young children are typically anesthetized for this procedure. The major sources of MRI data on vocal tract maturation are listed in Table 1. The data from these studies provide information on developmental changes in the vocal tract that are of particular importance in accounting for vowel formant-frequency changes with age. The interest is not only on overall length but also how regional growth in the vocal tract (e.g., oral versus pharyngeal) contributes to vocal tract length.
Table 1.
Major sources of MRI data on the developing vocal tract. For each published study, the table shows the number of subjects and their characteristics.
| Study | n | Ages |
|---|---|---|
| Fitch and Giedd (1999) | 129 | 2 to 25 |
| Vorperian, Kent, Gentry, and Yandell (1999) | 2 | Birth to 3 years 9 mos; longitudinal data. |
| Vorperian (2000) | 20 | Birth to 6 years, 9 months. Note - Some children studied longitudinally. |
| Arens et al. (2002) | 92 | 1 to 11 years |
| Vorperian et al. (2005) | 37 | 25 children (Birth to 6yrs 9mos) & 12 adults. Note - Some children studied longitudinally. |
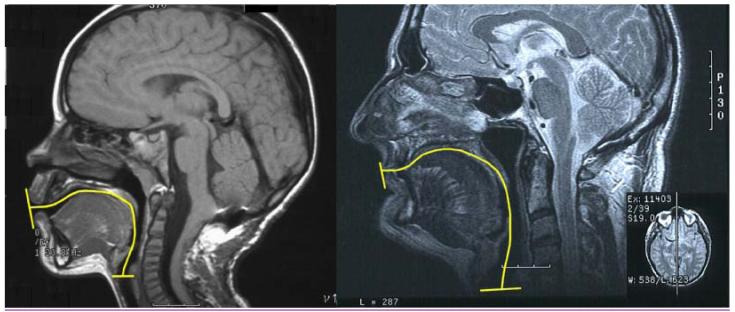
Figure 1 shows the measurement of vocal tract length (as defined by Vorperian et al., 1999) for a 4-year-old male child and a 54-year old adult male. Vorperian et al. reported that vocal tract length increased 1.5 to 2 cm during the first two years of life, and another centimeter between the ages of the ages of 25 to 36 months. They also noted that various structures of the vocal tract appear to grow in a synchronized fashion. Fitch and Giedd (1999) observed growth of the pharyngeal region between early childhood and puberty but especially between puberty and adulthood. Arens et al. (2002) concluded that (1) the skeleton of the lower face grows linearly along the sagittal and axial planes for the ages under study, and (2) the soft tissues, including tonsils and adenoid, grow proportionately to the skeletal structures. Vorperian et al. (2005) observed an accelerated growth between birth and 18 months, with no evidence of sexual dimorphism in the growth pattern. They also concluded that the region of the vocal tract (oral/anterior versus pharyngeal/posterior) and orientation (horizontal versus vertical) determines the developmental growth pattern. Although the pharyngeal/posterior structures account for vocal tract lengthening throughout development, growth of oral/anterior structures is particularly prominent during the first 18 months of life. These anatomic changes are pertinent not only to ontogeny but also to evolutionary proposals that attempt to account for the unique two-tube vocal tract configuration in humans (Nishimura, Mikami, Suzuki, & Matsuzawa, in press).
Figure 1.
The measurement of vocal tract length (VTL) defined as the curvilinear distance along the midline of the tract starting at the thyroid notch to the intersection with a line drawn tangentially to the lips. Left panel is the midsaggital MRI of pediatric male subject at age 4 years, 4-months with VTL measuring 11.28 cm. Right panel is the midsaggital MRI of adult male subject at age 54 years 2 months with VTL measuring15.87 cm.
B. Anatomic-Acoustic Relationships
Certainly, a basic principle in relating anatomic change to acoustic correlates is that the length of the vocal tract determines the overall pattern of formant frequencies. As children mature, their vocal tracts lengthen, and their formant frequencies decrease. However, the actual pattern of formant-frequency change as a function of age may not be simple, because the growth of the vocal tract is not just a matter of uniform lengthening. Particularly in males, the vocal tract has disproportionate growth in the pharyngeal region compared to the oral region. Fant (1975) suggested the following relationships between cavity length and formant frequencies:
Pharyngeal cavity length = 35300 / 2 x F2
Oral cavity length =35300 / 2 x F3
Thus, according to Fant, the pharyngeal cavity length is affiliated with the second formant, and the oral cavity length is affiliated with the third formant. Childers & Wu's (1991) findings are supportive of the second formant affiliation whereby they report F2 to be a slightly better recognizer of gender than fundamental frequency in adults. Perry et al. (2001) on the other hand, report that at age 4 (youngest age they studied), F3 was lower for boys than for girls with small differences in F1 and F2. Whiteside (2001) also notes that even before puberty, there is a considerable tonotopic distance between the F3 values of males and females. Interestingly, Lieberman et al.'s (2001) findings show that while there are no apparent sex differences in the distance between the posterior pharyngeal wall to the lips (SVT-H), the oropharyngeal portion of the SVT-H (i.e. oropharyngeal width – the distance from the posterior pharyngeal wall to the posterior margin of oral cavity) is slightly larger in males between the ages 1.75 and 4.75 years. An alternative conclusion presented by Martland et al. (1996) is that there is a transposition of the F2 and F3 parameters owing to differential growth of the pharyngeal and oral cavities during development, such that for children younger than 2 years, F3 is related primarily to the pharyngeal cavity. Thus, formant-cavity affliation may not be limited to cavity length only but also cavity width. This idea is further supported by Robb et al. (1997) who report that formant frequencies remain fairly stable during the first two years of life while there are documented increases in vocal tract length (Vorperian et al. 2005). Also, there are reports that speaker sex identification prior to 10-12 years are based on the resonance characteristics of the vowels (Perry et al., 2001) while there are no significant differences in VTL (Fitch & Giedd, 1999), and no significant differences in fundamental frequency (see Figure 17).Therefore, it may be more accurate to characterize the nonuniform growth of the vocal tract as nonuniform growth of length, width and subsequently volume. Whiteside (2001) also noted that in addition to nonuniform sex differences in the vocal tract length (pharyngeal cavity length, oral cavity length and total vocal tract length), there is the need to investigate sex differences in vocal tract volume. Ultimately, such information can be integrated in articulatory models, such as the variable linear articulatory model (VLAM) developed by Maeda, 1979, 1990; and applied developmentally, as done by Menard, Schwartz, & Boe (2004). The use of articulatory models that account for both the nonuniform growth of length and width of the vocal tract should help advance our understanding of exchanges and interplay of formant-cavity affiliations.
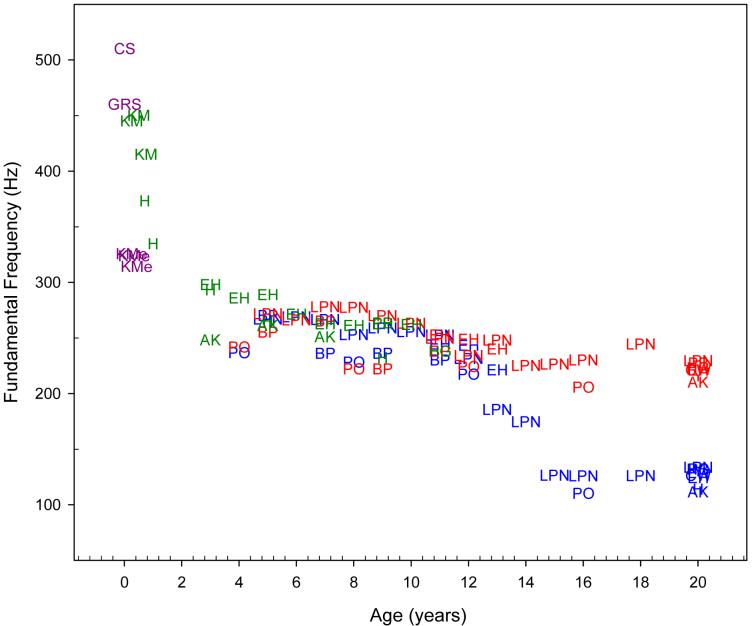
Figure 17.
Average f0 (across vowels) of studies listed in Appendix 1 as a function of age. The 3 groups, children (green), females (red) and males (blue) are the same studies as in the average plots of Figures 2 to 7; additional f0 data (magenta) are from studies with younger infants and children and include CS (Colton & Steinschneider, 1980), GRS (Gardosik, Ross & Singh, 1980) and KMe (Kuhl & Meltzoff 1996).
C. Formant-frequency Patterns across Development
The sources of formant-frequency data reviewed in this paper are from 14 of the 21 studies listed in Appendix 1.
Appendix 1.
Summary table of the 21 studies on vowel development reviewed listed chronologically. Study abbreviations (Abbr.) in bold and marked with an asterisk in the first column indicate the 14 studies from which formant values were used in the summary average plots F1-F2 plots (Figures 2, 3 & 4) and F1-F3 plots (Figures 5, 6 & 7). The last two columns further specify the three groups (children, male, & female; C-M-F), and the exact ages from which the formant values were included in the averages for Figures 2 to 7.
| Abbr. | Study | Subject Detail | Age | Vowels in plots | Methods of obtaining the vowel | Additional Details | F1-F2 Plot C-M-F | F1-F3 Plot C-M-F |
|---|---|---|---|---|---|---|---|---|
| PB * | Peterson and Barney (1952) | n=76 Children: n1=15 Adults: n2=33M n3=28F | Children 9yrs and Adults | /i/, /u/, /ae/, /a/ | Lists with ten monosyllabic words: heed, hid, head, had, hod, hawed, hood, who'd, hud, heard. General American English. | Two random word lists per speaker producing 1520 recorded words. Analysis via sound spectrograph. Formant frequencies estimated from weighted average of the frequencies of the principal components in the formant. | C at: -9 yrs M & F: - Adults | C at: -9 yrs M & F: - Adults |
| EH * | Eguchi and Hirsh (1969) | n=84 n per age/sex group = 5/6 | Children 3-13 yrs and Adults | /i/, /u/, /ae/, /a/ | Two sentences: He has a blue pen. I am tall. Vowels in American English. | Each sentence produced/read on five different occasions. Repetition after a native speaker for children <7 years. Used wide-band and narrow band spectrograms. F1 and F2 estimated from spectrum envelopes drawn on expanded narrow band sections (0-4000Hz). | C at: -3, 4, 5, 6, 7, 8, 9, 10 & 11 yrs M & F at: -11, 12 &13 - Adults | No F3 values reported. |
| B | Buhr (1980) | n=1 1M | Child 16-64 weeks | /i/, /u/, /ae/, /a/ | Select sounds classified by phonetician as a particular vowel sound of English. | Biweekly recordings. 944 vowels analyzed. Spectrograms measured by determining the first three formants for each sound. Formant values for the different vowels can be extracted from the plots. | Not plotted | Not plotted |
| KM * | Kent and Murray (1982) | n=21 n1=7 3F; 4M n2=7 3F;4M n3=7 4F;3M | Children n1: 3 ms n2: 6 ms n3:9 ms | Extreme F1 F2 values of the four corners were used to define acoustic space. | Infant vocalizations (comfort state) coded according to vocalic, phonation and noise segment (Coding table I, pg.355). | Vocalic utterances: f0 determined from narrowband (45 Hz) spectrograms and formant frequencies determined from wideband (450Hz) spectrograms. F1-F2 formant values per age group were extracted from Figures 8-10, p. 357 | C at: - 9 mos Note: Ages 3 & 6 mos not plotted | Average F3=5K. No mean F3 values for the different corner vowels reported |
| PG * | Pentz and Gilbert (1983) | n=not available | Children 7, 8 and 9 yrs | /i/, /u/, /ae/, /a/ | Not available. | Not available. Poster presentation at the 1983 annual convention of the American Speech-Language Hearing Association. Values reported in Kent 1994, p.73 | C at: - 7, 8 & 9 yrs | C at: - 7, 8 & 9 yrs |
| H * | Hodge (1989) | n=115 n1=15 12M; 3F n2=20 19M; 1F n3=20 20M | Children n1: infants mean = 8.5 mos n2: 1 yr mean = 18 mos n3: 3, 5, 9 yrs & Adults | < 9 mos: /i/, /u/, /ae/ 1 yr. - adult /i/, /u/, /ae/, /a/ | Isolated productions of the point and central vowels precede by aspirate /h/; reduplicated triple stop consonant vowel(CV) chain; words ‘baby’ and ‘bye bye’; sustained /s/ sounds; and words ‘two’ and ‘tea’; and two word combinations ‘a stee’ and ‘a stew’. Vowels in Canadian English. | Used spectographic displays with filter bandwith and dynamic range settings that provided the clearest formant pattern. F1, F2 & F3 values were estimated from the vocalic segments by tracing the midpoint of the strong energy region corresponding to each of the formants. | C at: - 9 mos - 1, 3, 5 & 9 yrs. M at: -3, 5, 9 & Adults | C at: - 9 mos - 1, 3, 5 & 9 yrs. M: - 3, 5, 9 & - Adults |
| CW * | Childers and Wu (1991) | n=52 27M; 25F | Adults 20-80yrs | /i/, /u/, /ae/, /a/ | Sustained each vowel as it would be pronounced in the following words: beet, bit, bet, bat, Bob, bought, book, boot, but, Bert. American English Vowels. | Formant information extracted by closed phase weighted recursive least square method with a variable forgetting factor. (WRLS-VFF). | M & F: - Adults | M & F: - Adults |
| ZJ * | Zahorian and Jagharghi (1993) | n=30 Children n1=10 5M; 5F Adults: n2=20 10M; 10F | Children 11yrs and Adults | /i/, /u/, /ae/, /a/ | 99 CVC syllables produced in isolation. CVC syllable list contained 9 instances of each of 11 vowels /iy, ih, eh, ae, ah, aa, ao, ow, uh, uw, er/. CVC list is in Appendix A (Zahorian & Jagharghi, 1991). Vowels in American English-various dialects. | 2922 vowels/formant frequency analyzed. 50msec Hanning window & 10th order LP model computed. Used a dynamic programming approach to select actual formant values with formant seed values/data from Peterson & Barney. Formant tracking verified visually & with global spectral shape. | C at: -11 yrs M & F: - Adults | C at: -11 yrs M & F: - Adults |
| BP * | Busby and Plant (1995) | n=40 n =10 per age group 5M; 5F | Children 5, 7, 9 & 11 yrs | /i/, /u/, /ae/, /a/ | Words: sheep, ship, bed, cat, cart, cut, four, dog, shoe, book, bird Carrier phrase: “I can see a.....” Test words presented orthographically & pictorially. Vowels in Australian English. | 440 values per formant frequency. f0 estimated from spectrographic traces of the first two harmonics. F1-F3 values determined from the steady state portion of vowel using spectrogram and average power spectrum displays. Formant values extracted from Fig2-3, p. 2605. | C at: - 5, 7, 9 & 11 yrs M & F at: - 5, 7, 9 & 11 yrs | No mean F3 values per vowel. Mean F3 across all vowels/age group in Fig1 p. 2604. |
| HW * | Hagiwara (1997) | n=15 6M; 9F | Adults 18-26 yrs | /i/, /u/, /ae/, /a/ | 33 words database with 11 vowels: beat, bit, bate, bet, bat, boot, put, boat, bought, but, Bert. Each word presented in the frame ‘Cite … twice”. Vowels in American English. | 30 msec window Digitized at 10Khz Formants determined from wide band spectrogram and narrow band FFT spectra & LPC analysis. | M & F: - Adults | M & F: - Adults |
| HG * | Hillenbrand, Getty, Clark, and Wheeler (1995) | n=139 Children n1=46 27M; 19F Adults n2=93 45M; 48F | Children 10-12 yrs and Adults | /i/, /u/, /ae/, // | Read randomized lists with words: heed, hid, hayed, had, hod, hawed, hoed, hood, who'd, hud, heard, hoyed, hide, hewed, how'd. Vowels in American English-upper Midwest dialect. | Digitized at 16kHz with 12 bit resolution. F1-F4 measured from LPC spectra over 16 msec hamming windows. Measures made while viewing a spectral peak display and a spectrogram. | C at: - 11 yrs M & F: -Adults | C at: - 11 yrs M & F: -Adults |
| Y * | Yang (1996) | n=20 10M; 10 F Note: The n reflects only the number of American English speakers/participants. | Adults 18-27 yrs | /i/, /u/, /ae/, /a/ | Read list with the following 13 vowels/words: had, hard, hawed, hayed, head, heed, herd, hid, hod, hoed, who'd, Hudd, and hood. Each word was present/ produced 5 times. American English vowels. Korean vowels are not included in this summary. | F1-F3 are average values of 3 repetitions/ vowel per speaker. Input samples were low pass filtered at 4 kHz and digitized at 10 kHz sampling rate. Spectrograms used 256-point DFT analysis with a 6.4 ms Hamming window once every ms. Formant measure taken 1/3 into the vowel duration (on/offset) | M & F: - Adults | M & F: - Adults |
| KMe | Kuhl and Meltzoff (1996) | n=72 n=24 per age group | Children 3, 4 & 5 months | /i/, /u/, /a/ - like vowels | Infants listened to 8 different productions representative of /i/ as in “heap”, /u/ as in “hoop” and /a/ as in “hop. Infants produced vocalizations resembling the vowel they heard. Vowel-like vocalizations analyzed following perceptual coding as /i/, /u/, /a/ -like. | Formant values were based on agreement of 3 analyses: Narrowband spectrogram (114 Hz), fast Fourier transform (256 points, preemphasis, Blackman window weighting), & LPC frequency response (10 ms frame length, filter order=12). | Not plotted | Not plotted |
| GRC | Gilbert, Robb and Chang (1997) | n=4 4M | Children 15-36 mos Sampling sessions at: 15, 18, 21, 24 & 36 mos | Vowels not specified | Spontaneous vocalizations. Phonetic classifications made as belonging to tongue height (high, middle, low) and tongue advancement features (front, central, back). | 1334 vowels analyzed. Analysis used a wideband (450 Hz) spectrogram. Center frequencies of the first two steady state formants were judged to be F1 & F2. | Not plotted | Not plotted |
| RG | Robb, Chen and Gilbert (1997) | n=20 9M; 11F | Children 4-25 months | Average formant frequency | Comfort-state non-cry vocalizations were collected from each child. Total of 1743 vowel-like sounds.An average of 88 vowel-like sounds/ child. Every distinguishable vocalization was phonetically transcribed. | Digitized at 10kHz with 16 bit quantization. Using an amplitude by time waveform, the on/offset per vowel was determined, and transformed to a narrowband spectrogram (24 Hz). F1 and F2 was determined from LPC spectra (6 coefficients across a 20 ms Hamming window). | Not plotted | Not plotted |
| LPN * | Lee, Potamianos and Narayanan (1999) | n=492 Children n1=436 229M; 207 F Adults n2=56 | Children 5-18yrs Adults 25-50 yrs | /i/, /u/, /ae/, /a/ | 15 target words and 5 sentences presented on computer monitor. Utterances produced twice in random. Words were: bead, bit, bet, bat, pot, ball, but, put, boot, bird - produced in a carrier sentence: “I say uh---again”; 5-6 year olds who produced target words in isolation. Sentences were: He has a blue pen. I am tall. She needs strawberry jam on her toast. Chuck seems thirsty after the race. Did you like the zoo this spring? Vowels in American English. | 3265 pairs analyzed. Digitized at 20kHz sampling rate and 16 bit resolution. Utterances segmented using the AT&T hidden Markov model recognition engine. f0 and formant values were secured using an automatic Fo and formant-tracking program in ESPS signal processing package. Automatic vs. a sample of manual estimations were compared. Waveforms were downsampled to 12kHz and processed using a 12msec Hamming window. | C at: - 5, 6, 7, 8, 9, 10 & 11 M & F at: - 5, 6, 7, 8, 9, 10, 11, 12, 13, 14, 15, 16, 18 yrs & Adults | C at: - 5, 6, 7, 8, 9, 10 & 11 M & F at: - 5, 6, 7, 8, 9, 10, 11, 12, 13, 14, 15, 16, 18 yrs & Adults |
| WH | Whiteside and Hodgson (2000) | n=29 Children n1=20 10M;10F Adults n=9 4M;5F | Children Ages 6 & 9 yrs./ age group 3M; 3F Age 10 4M; 4F Adults age mean 37.4 | /a/ | Picture naming task. Target phrases: The red/blue/green bar/jar/car. Four distracters: The red boat, The green balloon. Vowels in UK English | 9 phrase final vowels/subject analyzed. Digitized at 10kHz sampling rate. Fo calculated using autocorrelation method (20 ms frame length). F1-F3 calculated at midpoint of final vowel using automatic LPC analysis. | Not plotted | Not plotted |
| AK * | Assmann and Katz (2000) | n=50 Children n1=30; 10 per age group Adults n=20 10M; 10F | Children 3, 5 & 7 yrs Adults | /i/, /u/, /ae/, /a/ | Words: heed, hid, hayed, head, had, hud, hod, hawed, herd, hoed, hood, who'd. 6 random repetitions per word/vowel. Vowels in American English. | 180 vowel tokens/formant frequency analyzed. Digitized at 48kHz and 16-bit resolution. Waveforms were low-pass filtered and resampled at 12kHz. f0 estimates made using the Meddis & Hewitt '91 pitch model. Formant center frequencies were tracked using a custom MATLAB program. | C at: -3, 5 & 7 yrs M & F at: - Adults | C at: -3, 5 & 7 yrs M & F at: - Adults |
| POA * | Perry, Ohde, and Ashmead (2001) | n=80 n=20 per age group 10M; 10F | Children 4, 8, 12, & 16 yrs. | /i/, /u/, /ae/, /a/ | Seven vowels in the neutral context of /hVd/ -- had, head, heed, hid, hod, hud, who'd -- were embedded in the carrier phrase “Say /hVd/ again”. Each /hVd/ was analyzed 5 of the 7 times produced. Vowels in American English. | 2800 vowels analyzed. Digitized at 20kHz sampling rate. f0 determined using with CSL pitch extraction program. F1, F2, F3 values measured from spectrogram at the midpoint of vowel. Also, LPC analysis with a 10 msec triangular window (14-20 coefficients) and cursor placed at midpoint of F2 stability. | C at: - 4 & 8 yrs M & F at: - 4, 8, 12 & 16 yrs | C at: - 4 & 8 yrs M & F at: - 4, 8, 12 & 16 yrs |
| NM | Nijland, Maassen, Meulen, Breels, Kraaimaat and Schreuder (2002) | n=25 controls Children n1=19 14M; 5F Adults n2=6 0M; 6F Note: The n reflects only the number of controls for the participants with DAS. | n1: 4;11 to 6;10yrs Adults 6 Females | /i/, /u/, /a/ | Disyllabic nonsense utterances of the type [ǝCV], with V as one of extreme vowels /a, i, u/ of the Dutch vowel space and C was either a fricative (the alveolar /s/ or the velar /x/) or a stop(/b/ or /d/). All syllables produced 6 times in the carrier phrase: ‘he de … weer’ (‘hey the … again’). Vowels from native speakers of Dutch. | 72 utterances/subject (3 vowels, 4 consonants, 6 repetitions) digitized at 25 kHz sampling rate. F2 trajectory was used to determine utterance types. Used CSL to mark amplitude peaks. Formant values were obtained using pitch synchronous LPC analyses (triangular window; 20 components autocorrelation with pre-emphaiss of .950). | Not plotted in summary plots. Dutch vowels formant values fall within the age specific average acoustic space for English vowels. | Not available |
| CD | Casal, Dominguez, Fernandez, Sarget, Celdran, Vilalta and Escoda (2002) | n=22 controls for the 22 children with cleft. Note: The n reflect only the number of control participants. | n for controls: n=9 at 22 mos & n=13 at 33 mos. | /i/, /u/, /a/ | Spontaneous speech in Spanish elicited to secure needed speech sounds; 5 vowels /a, i, u, e, o/ and 4 consonants /p, t, k, m/ . Vowels from Spanish speakers. | 220 vowels/formant frequency. F1 and F2 values were measured at midpoint of steady state of vowels. Midpoint as determined from duration of steady states. Note: Formant values from cleft lip &/or cleft palate are not considered for comparison. Only formant values from their controls were considered. | Not plotted in summary plots. Spanish acoustic space is similar to the average acoustic space for English vowels. | Not available |
1. Value of formant descriptions
Formant descriptions are a low-dimensional description of vowels, although formants are not necessarily superior to other acoustic representations for various purposes, including perceptual representations and speaker normalization (de Wet et al., 2004; Molis, 2005; Zahorian & Jagharghi, 1993). One advantage of a formant specification is the systematic relationship between formant pattern and vowel articulation (which is to say, the acoustic-to-articulatory conversion). The classic F1-F2 formant plot depicts a fundamental articulatory-acoustic relationship in which the F1 and F2 frequencies are related principally to tongue height and advancement, respectively. Alternatively, the F2-F1 difference can be interpreted as tongue advancement/retraction. Data on vowel formant frequencies in children have been reported in a sufficient number of studies, particularly ages 3 and up, to yield a satisfactory composite data set to summarize developmental patterns (see Appendix 2). Data on F1 and F2 are most abundant, but a few studies also report data on F3. Given the cavity affiliation issues noted above in section B, an F1-F2-F3 description is desirable for a reasonably complete description of vowel development because F3 complements F1 and F2 information, particularly with respect to speaker normalization and the identification of rhotic vowels. The most common methods used to estimate formant frequencies in children are spectrograms, automated routines such as linear prediction coding (LPC), or both of these used together. To our knowledge, there has been much less use of other techniques, such as acoustic impedance spectrometry (Epps, Dowd, Smith, & Wolfe, 1997), cepstral analyses (Fort & Manfredi, 1998), or acoustic reflection technology (Xue & Hao, 2005; in press).
Appendix 2.
Summary of studies per age, and per group C (children), M (males), and F (females) in Figures 2 to 7. Asterisk indicates the additional studies/ages used in Figures 17 & 18. The studies' abbreviations are listed chronologically in Appendix 1.
| Age (yrs) | Group C-M-F | # of studies | Studies | ||||||||||||||
|---|---|---|---|---|---|---|---|---|---|---|---|---|---|---|---|---|---|
| 0.25 | * | 2 | KM | KMe | |||||||||||||
| 0.42 | * | 1 | KMe | ||||||||||||||
| 0.50 | * | 1 | KM | ||||||||||||||
| 0.71 | C | 1 | H | ||||||||||||||
| 0.75 | C | 1 | KM | ||||||||||||||
| 1 | C | 1 | H | ||||||||||||||
| 2 | 0 | ||||||||||||||||
| 3 | C | 3 | H | EH | AK | ||||||||||||
| 4 | C | 2 | EH | POA | |||||||||||||
| F | 1 | POA | |||||||||||||||
| M | 1 | POA | |||||||||||||||
| 5 | C | 5 | H | EH | AK | BP | LPN | ||||||||||
| F | 2 | BP | LPN | ||||||||||||||
| M | 2 | BP | LPN | ||||||||||||||
| 6 | C | 2 | EH | LPN | |||||||||||||
| F | 1 | LPN | |||||||||||||||
| M | 1 | LPN | |||||||||||||||
| 7 | C | 5 | EH | AK | BP | LPN | PG | ||||||||||
| F | 2 | BP | LPN | ||||||||||||||
| M | 2 | BP | LPN | ||||||||||||||
| 8 | C | 4 | EH | POA | LPN | PG | |||||||||||
| F | 2 | POA | LPN | ||||||||||||||
| M | 2 | POA | LPN | ||||||||||||||
| 9 | C | 6 | H | EH | BP | LPN | PG | PB | |||||||||
| F | 2 | BP | LPN | ||||||||||||||
| M | 2 | BP | LPN | ||||||||||||||
| 10 | C | 2 | EH | LPN | |||||||||||||
| F | 1 | LPN | |||||||||||||||
| M | 1 | LPN | |||||||||||||||
| 11 | C | 3 | EH | BP | LPN | ZJ | HG | ||||||||||
| F | 5 | EH | BP | LPN | |||||||||||||
| M | 3 | EH | BP | LPN | |||||||||||||
| 12 | F | 3 | EH | POA | LPN | ||||||||||||
| M | 3 | EH | POA | LPN | |||||||||||||
| 13 | F | 2 | EH | LPN | |||||||||||||
| M | 2 | EH | LPN | ||||||||||||||
| 14 | F | 1 | LPN | ||||||||||||||
| M | 1 | LPN | |||||||||||||||
| 15 | F | 1 | LPN | ||||||||||||||
| M | 1 | LPN | |||||||||||||||
| 16 | F | 2 | POA | LPN | |||||||||||||
| M | 2 | POA | LPN | ||||||||||||||
| 17 | 0 | ||||||||||||||||
| 18 | F | 1 | LPN | ||||||||||||||
| M | 1 | LPN | |||||||||||||||
| 19/ Adults | F | 9 | EH | AK | LPN | PB | ZJ | HG | CW | HW | Y | ||||||
| M | 9 | H | EH | AK | LPN | PB | ZJ | HG | CW | HW | Y | ||||||
2. Estimation error
It is always important to assess measurement error in determining the precision of formant-frequencies, but this error takes on even greater importance in studies that use variability of formant frequencies as an index of maturation, with the usual hypothesis being that formant-frequency variability (and presumably, therefore, articulatory variability) diminishes with age. That is, the error in formant-frequency estimation can be confounded with the variability associated with intra-speaker imprecision in achieving articulatory-acoustic targets. Distinguishing measurement error from maturation-related variability is one of the challenges of acoustic analysis. From an analytic point of view, the error of formant-frequency estimation is related to f0, because higher f0 values result in a larger spacing of harmonics. Generally, the closer spacing of the harmonics, the better defined are the peaks of the vowel spectrum.
Age-related variability of formant-frequency pattern in vowel production has been determined in several studies. One of the earliest systematic developmental studies was a cross-sectional investigation by Eguchi and Hirsh (1969) who showed essentially continuous decreases in the variability of both F1 and F2 from 3 to 11 years of age. However, Nittrouer (1993) reported that F1 variability was minimal by the age of 3 years whereas F2 variability continued to decrease after that age. She interpreted this result to mean that precision of jaw movement (which affects especially F1) was achieved relatively early. The relative maturation of motor control over different oral structures is not entirely clear. Children's jaw movements are less variable than lip movements (Green, Moore, & Reilly, 2002; Walsh & Smith, 2002), but it has been reported that jaw and lip movements have parallel decreases in variability with maturation (Walsh & Smith, 2002).
Aside from the above noted challenge of using variability of formant frequencies to distinguish between measurement error and articulatory variability as an index of maturation, there is the additional complication of separating intra- versus inter-speaker (within vs between speaker) sources of variance. Furthermore, there is the difficulty of interpreting the origin of inter-speaker sources of variance for it seems that concurrent with periods of decreased articulatory variability, there is a decrease in the anatomic growth rate of various vocal tract structures, particularly during early childhood (Vorperian, 2000; Vorperian et al., 2005). Thus, elucidation of the sources of variability in speech development rests on the availability of multiple types of data (including acoustic, anatomic and movement data).
3. Data sources
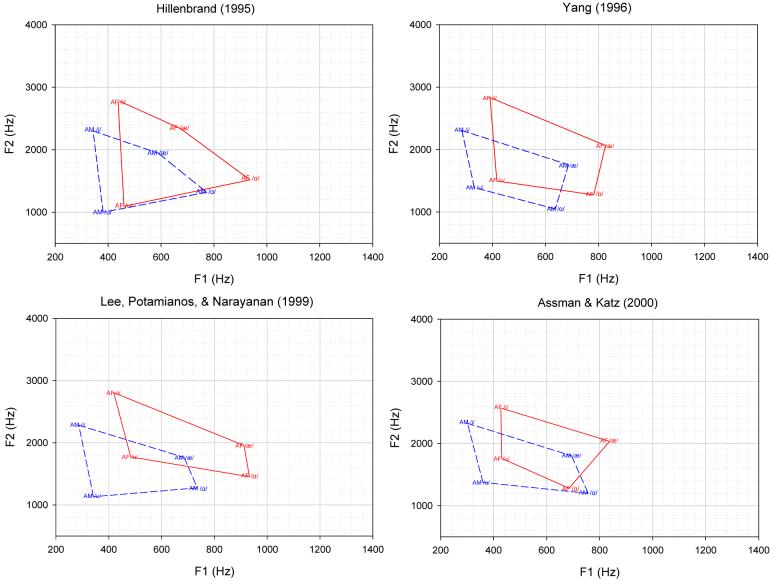
Searches were made of major bibliographic databases (Pubmed, Psychlit) and selected journal indexes (Journal of the Acoustical Society of America, Journal of Speech, Language, and Hearing Research) to identify studies reporting data on vowel formant frequencies. The search terms were: vowels, formants, formant frequency, speech acoustics, and speech development. As noted above, 21 source studies of formant-frequency data are listed in Appendix 1, along with descriptions of the speech samples used and their analysis method. The studies were further examined to determine their suitability for inclusion. Of the 21 source studies, 14 candidate studies were identified according to the following criteria: (a) studies reported quantitative data on developing (child) or mature (adult) speakers of English; (b) developmental data were reported for more than a single age group; (c) data were reported for at least 3, but preferably 4, of the corner vowels, (d) group studies were preferred over single-subject reports, and (e) quantitative data were reported for at least the first two formant frequencies (F1 and F2). The next step was to calculate average formant values per vowel per age group to graphically summarize the data to depict developmental relationships. Particular emphasis was given to the classic vowel quadrilateral because of the general availability of data for the corner vowels and the utility of the quadrilateral in defining the overall vowel acoustic space, and articulatory-acoustic correlates establishing this space.
As can be seen in column 6 of Appendix 1, the formant-frequency data used in this study were from speakers of various geographic regions. Thus, the age and gender comparisons described in this paper are confounded with dialect variation. Ideally dialect should be taken into consideration in the interpretation of data from any particular study, and more specifically the place of birth and childhood residence for the characteristics of low vowels and high back vowels (Clopper, Pisoni, & de Jong, 2005). One reason why dialectal influence was difficult to control is because the formant-frequency data used in this study were published over an interval of nearly five decades and dialects shift over time. Another confounder was that most of the studies included in the present analysis did not ascertain that the subjects did in fact have the dialect typical of speakers from a given geographic region.
4. Graphical analysis
Vowel quadrilaterals were created by first identifying the subset of studies from the 14 candidate studies appropriate to each plot (Male, Female, Child). Male plots present data for males from childhood (where sex is specified - age 4) through adulthood. Similarly, female plots present data for females from childhood (where sex is specified - age 4) through adulthood. Child plots present data only for subjects younger than 12 years of age (with an average of male and female values when sex is specified). The F1 and F2 values (and F3 values when available) reported in 14 of the 21 studies listed in Appendix 1 were used to generate the age/sex-indexed average quadrilaterals in Figures 2-7. The last two columns in Appendix 1, specify what is included from each study in the various plots (M-Male, F-Female, and C-Child). Appendix 2 lists the studies/data sources per age group. The corners of the quadrilaterals are simple means derived for each of the four corner vowels /i/, /u/, /ae/ and /a/ from all appropriate studies for a given age group. Study/age combinations with missing vowels were deleted (details are available in the Appendix 1). In this way, the data for each age (or age/sex) group summarizes the published data.
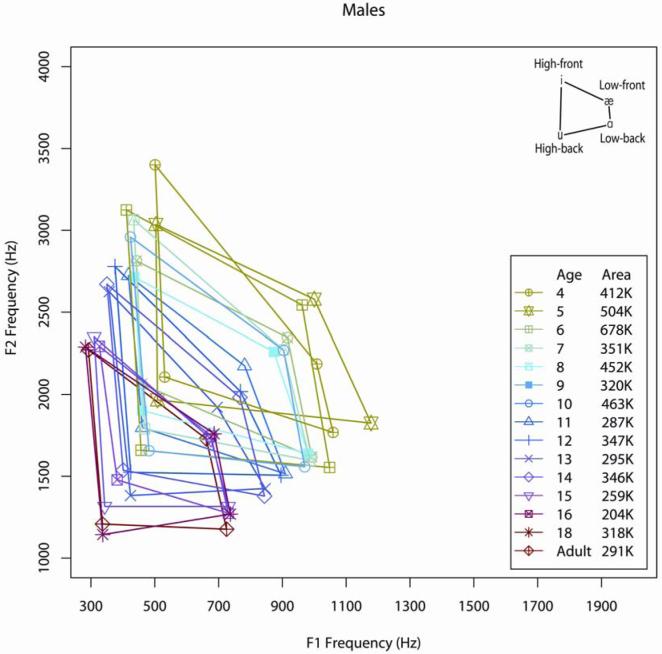
Figure 2.
Average F1-F2 acoustic space for males (ages 4 years through adulthood) from 12 of the 21 studies listed in Appendix 1. Plotted data are averages across studies, at a given age, for the four corner vowels. Separate vowel quadrilaterals formed from these averages are shown at each age, and the area of each of the vowels spaces is given in the inset to the figure. The column before last in Appendix 1 indicates the studies that had data available for formant average calculations, and lists the specific ages for which data were available for averaging.
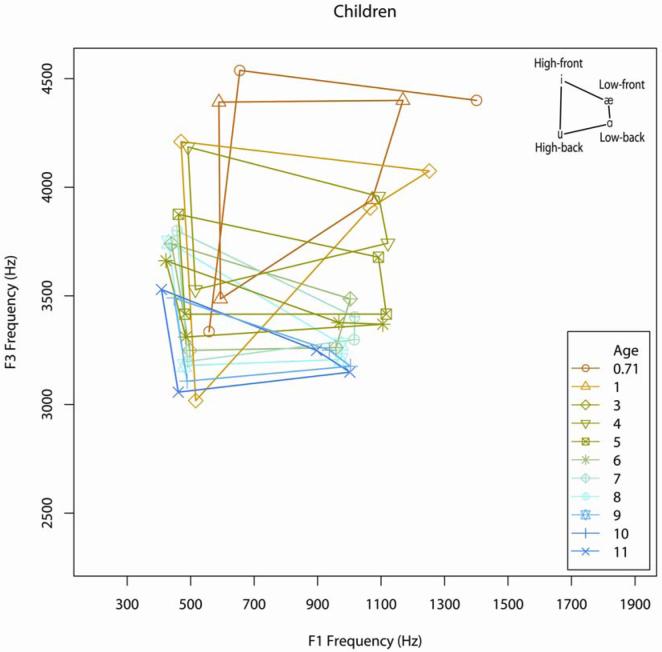
Figure 7.
Average F1-F3 acoustic space for children (8.5 months to 11 years) from 8 of the 21 studies listed in Appendix 1. Data are plotted and reported as described in figure 5 caption.
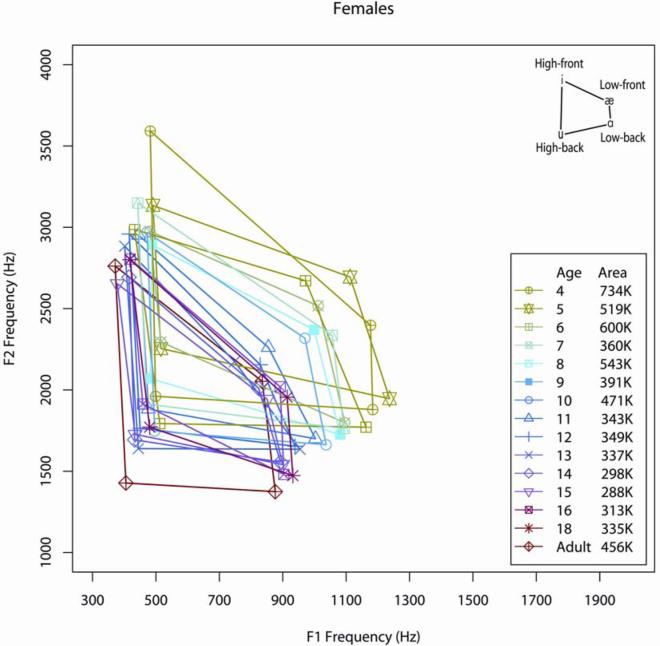
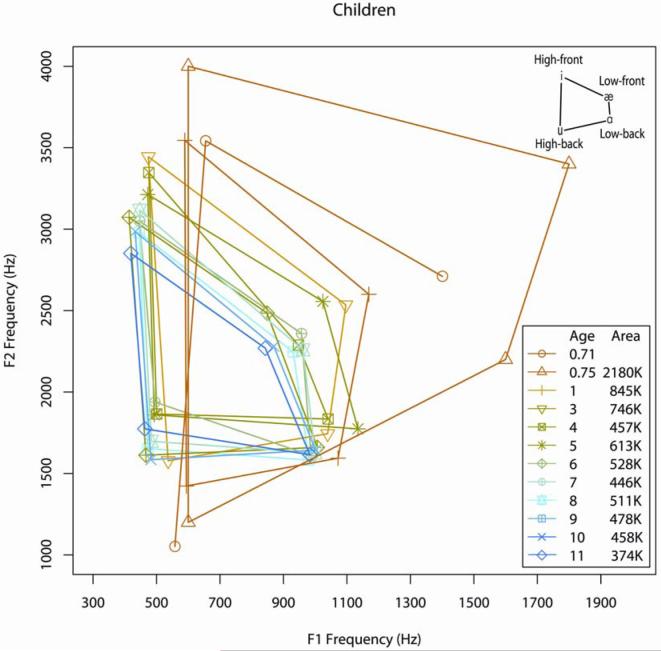
The F1-F2 vowel quadrilaterals are shown in Figure 2 (males, ages 4 years through adulthood), Figure 3 (females, ages 4 years through adulthood); and Figure 4 (children ages 9 months to 11 years). The legend in Figures 2-4 includes data on the areas of the vowel quadrilaterals (vowel acoustic space size) at the different ages. F1-F2 planar area was computed with the following formula for the area of an irregular quadrilateral:
Figure 3.
Average F1-F2 acoustic space for females (ages 4 years through adulthood) from 11 of the 21 studies listed in Appendix 1. Data are plotted and reported as described in figure 2 caption.
Figure 4.
Average F1-F2 acoustic space for children (ages 8 months to 11 years) from 11 of the 21 studies listed in Appendix 1. Data are plotted and reported as described in figure 2 caption.
Area = 0.5*{(/i/F2*/ae/F1 + /ae/F2*/a/F1 + /a/F2*/u/F1 + /u/F2*/i/F1) -(/i/F1*/ae/F2 + /ae/F1*/a/F2 + /a/F1*/u/F2 + /u/F1*/i/F2)}
where Fn = the formant number for the vowel symbol shown in the virgules; e.g./i/F2 is the second formant for vowel /i/.
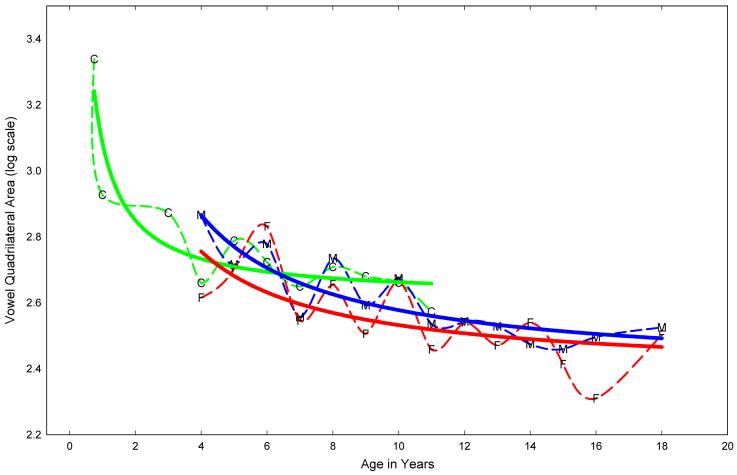
The prediction from standard acoustic theory is that vowel formant frequencies decrease as the vocal tract lengthens with age. This prediction is supported by the data in Figures 2, 3 and 4. Although the data on vowel quadrilateral area data are somewhat variable across studies, a general decline in quadrilateral size is evident during development (Figure 8). The variability in the results is not surprising, given that the multiples sources of formant-frequency data used to construct the composite graphs. Data on vowel acoustic space size in normal vowel development are a useful reference for the study of children with dysarthria, deafness, and various developmental disorders (Higgins & Hodge, 2001; Kent, Netsell, Osberger, & Hustedde, 1987; Liu, Tsao, & Kuhl, 2005; Moura et al., in press; Rvachew, Slawinski, Williams, & Green, 1996; Schenk, Baumgartner, & Hamzavi, 2003). Unusually small areas are correlated with reduced intelligibility in children and possible risk for speech disorder. Furthermore, vowel-specific formant-frequency differences may have value in characterizing the vocal tract features of particular syndromes (Moura et al., in press). Therefore, development of vowel space size is one index of the capacity for intelligible speech, and normative data can help in the acoustic interpretations of unintelligible speech.
Figure 8.
Vowel quadrilateral areas (log scale of Hz squared/1000) of the average F1-F2 acoustic space per age group for males (M-blue), females (F-red) and children (C-green; as displayed in Figure 2, 3 and 4). with three distinct cubic polynomial regression fits per plot (males, females and children).
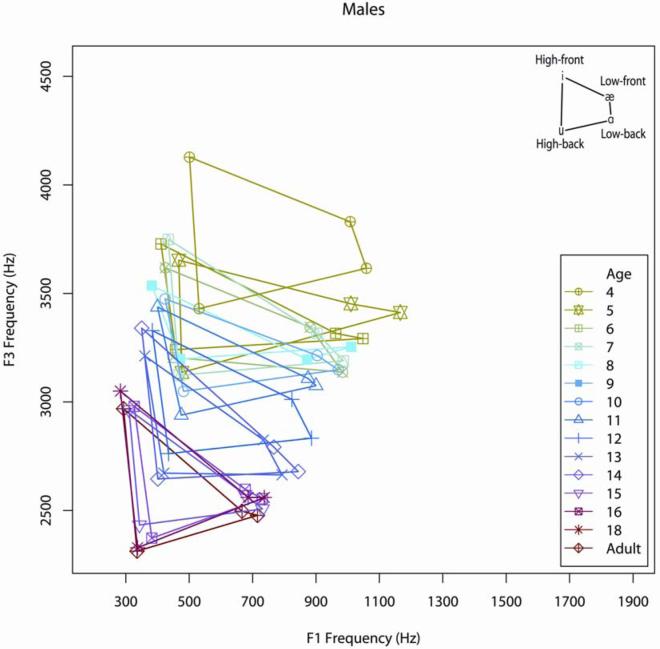
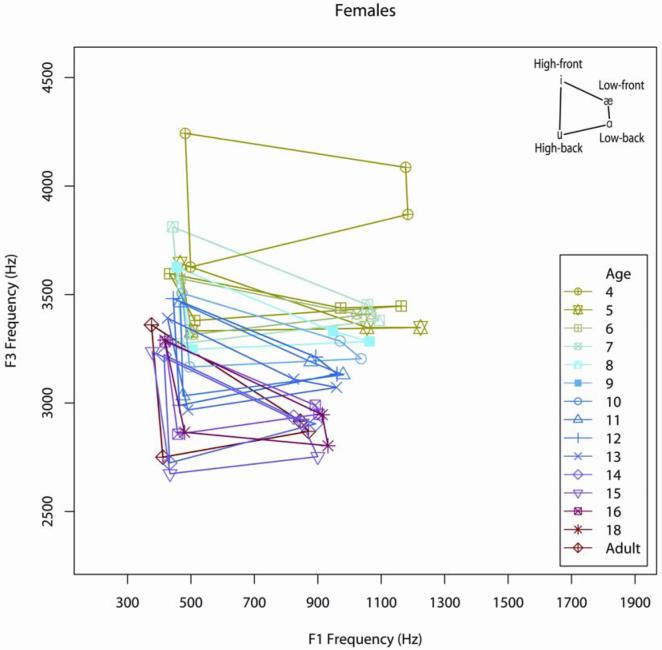
The F1-F3 data generally take the form of a quadrilateral, but there are some exceptions to this geometry such as a reversal of the configuration for the back vowels (e.g., Figure 10, age 16). The composite F1-F3 data are shown in Figure 5 (males, 4 years through adulthood), Figure 6 (females, 4 years through adulthood), and Figure 7 (children 8.5 months to 11 years). A fairly regular age-related pattern can be seen in the F1-F3 plots, but there is a conspicuous decrease in F3 between the ages of 1 to 3 years. Also, the F1-F3 quadrilaterals have a greater developmental dispersion or separation, i.e. there is less overlap of the quadrilaterals than the F1-F2 quadrilaterals patterns particularly for males. This may indicate that the F1-F3 analyses are more sensitive to age, and possibly to speaker sex as noted above (Section II.B).
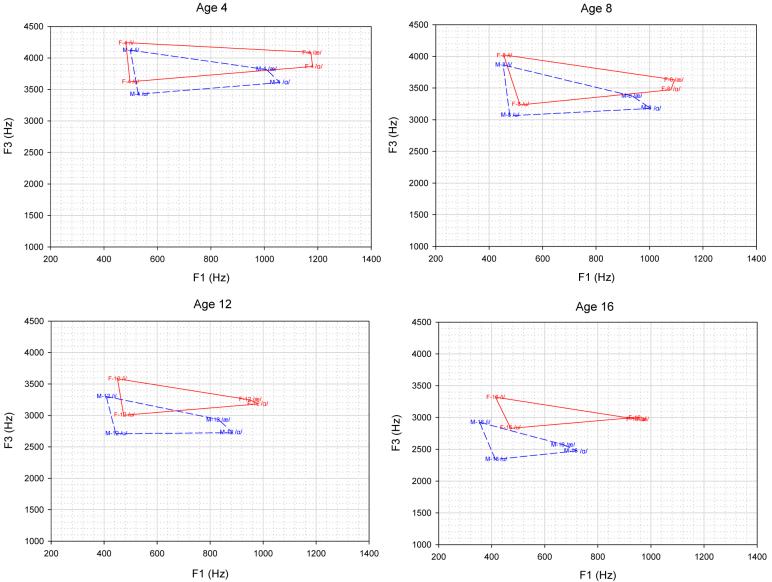
Figure 10.
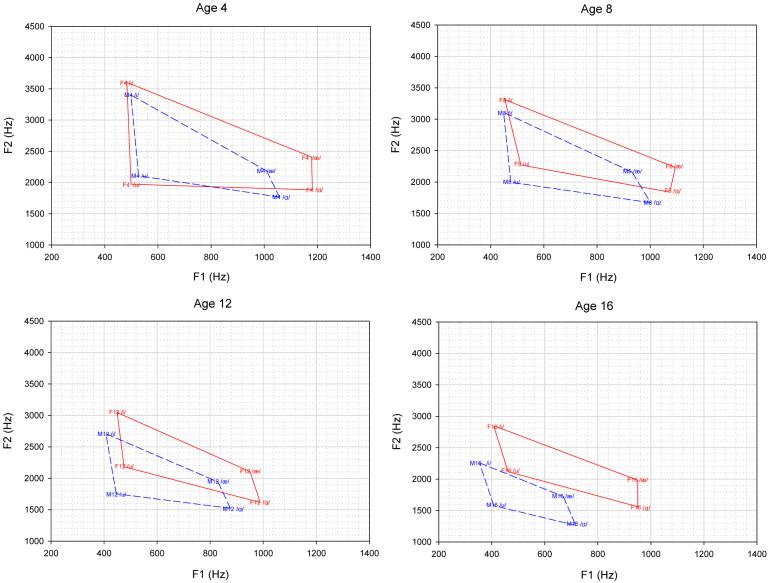
F1-F3 data from the study by Perry, Ohde, & Ashmead (2001) who reported data for boys and girls at the ages of 4, 8, 12 and 16 years. The corner vowels are the averages from 20 subjects per age group (10 male, 10 female), with 5 repetitions per vowel. Sex differences in the acoustic space are evident at age 4 and increase with age. The overlap in the vowel quadrilaterals for the two sexes decreases and by age 16 there is no overlap. Note a sex difference in F1 for the low vowels across all age groups, with males having lower F1 values.
Figure 5.
Average F1-F3 acoustic space for males (4 years through adulthood) from 10 of the 21 studies listed in Appendix 1. Plotted data are averages across studies, at a given age, for the four corner vowels. Separate vowel quadrilaterals formed from these averages are shown at each age. The last column in Appendix 1 indicates the studies that had F3 data available for formant average calculations, and lists the specific ages for which data were available for averaging.
Figure 6.
Average F1-F3 acoustic space for females (4 years through adulthood) from 9 of the 21 studies listed in Appendix 1. Data are plotted and reported as described in figure 5 caption.
Figures 9 and 10 show F1-F2 and F1-F3 measurements from the study of Perry, Ohde, and Ashmead (2001) who reported data for boys and girls at the ages of 4, 8, 12 and 16 years. These data are particularly instructive regarding age-sex differences in formant patterns because they allow an inspection of age/sex related changes in the vowel quadrilateral. A sex difference in the acoustic space begins to emerge even in the data for 4-year-olds, especially for the low vowels where the F1 values are about 150 to 200 Hz lower for males than for females. This difference becomes more pronounced with age, such that progressively less overlap is noted in the vowel quadrilaterals for the two sexes. By the age of 16 years, the quadrilaterals do not overlap. An additional potentially interesting feature is that there is a sex difference in F1 frequency for low vowels across all age groups, with males having lower F1 values.
Figure 9.
F1-F2 data from the study by Perry, Ohde, & Ashmead (2001) who reported data for boys and girls at the ages of 4, 8, 12 and 16 years. The corner vowels are the averages from 20 subjects per age group (10 male, 10 female), with 5 repetitions per vowel. Sex differences in the acoustic space are evident in the data for the 4-year-olds. This difference increases with age, and there is progressively less overlap in the vowel quadrilaterals for the two sexes. An interesting observation is that there is a sex difference in F1 for the low vowels across all age groups, with males having lower F1 values.
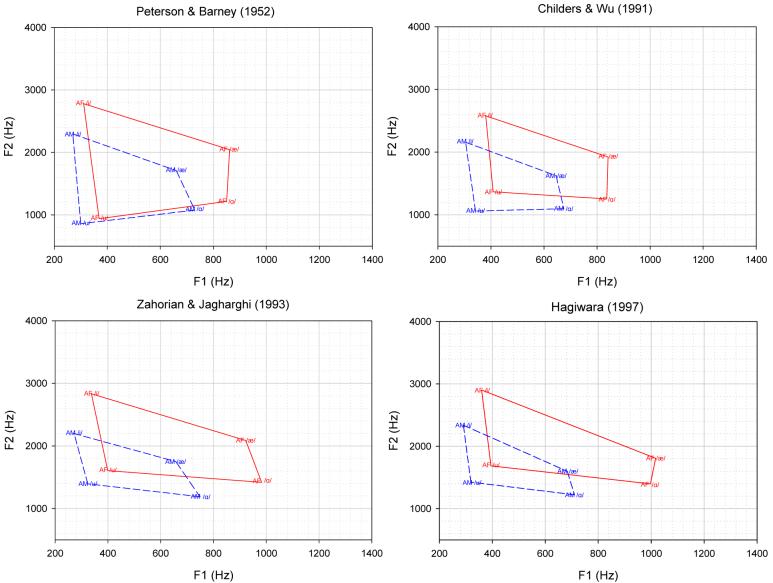
Average F1-F2 data for adults from 8 studies are shown in Figures 11. These illustrations are collections from relatively large-N studies of speakers of English. These data for adults are shown here for comparison purposes in the study of speech development and to show the variation in formant-frequency data for speakers in whom maturational processes are presumed to be complete. While the phonetic context of the words from which the vowels were analyzed can effect the vowel acoustic space (Munson & Solomon 2004), it is also likely that formant frequencies may continue to change somewhat during adulthood, apparently because of continuing growth of the human cranial skeleton (Isreael, 1968, 1973). Data in support of this possibility have been reported in several studies that demonstrate increases in size of the various craniofacial structures well into late adulthood (Endres, Bambach, & Flosser, 1972; Linville & Rens, 2001; Rastatter, McGuire, Kalinowski, & Stuart, 1997; Scukanec, Petrosino, & Squibb, 1991; Xue & Hao, 2003).
Figure 11a b.
Average F1-F2 data from 8 studies with adult values. The studies are listed in Appendix 1. Note the similarities, and also the variation in the formant-frequency data for speakers in whom the maturational processes are presumably complete.
5. Acoustic evidence of growth spurts
An important developmental question is whether anatomic growth spurts at certain ages can be identified from acoustic data. Because of the large variance in the data from published studies, it is difficult to answer this question with confidence. However, some tentative conclusions can be offered, beginning with the period of infancy.
5a. An exception to the standard prediction from acoustic theory
Robb, Chen, and Gilbert (1997) concluded from a cross-sectional study of 20 children that average F1 and F2 frequencies were essentially stable over the period from 4 to 25 months of age, but they did observe a significant decrease in the average bandwidths for both F1 and F2. Bandwidth data have been rarely reported in developmental studies. Variations in bandwidth speak to changes in absorption of sound by vocal tract tissues, or possibly to subtle changes in nasal resonance. In a study of four children over the developmental period of 15 to 36 months of age, Gilbert, Robb, and Chen (1997) noted essentially constant F1 and F2 frequencies before 24 months (and, by interpretation, little change in vocal tract length) but significant decreases in both formant frequencies between 24 and 36 months (and presumably a lengthening of the vocal tract). To the contrary, MRI data show rapid increases in vocal tract length in the first two years (Vorperian et al., 1999; Vorperian, 2000; Vorperian et al., 2005). Possibly, the formant-frequency results cannot be explained solely by anatomic changes of increases in vocal tract length. For example, it may be necessary also to examine changes in pharyngeal length and width in relation to formant frequency and bandwidth changes. The study by Robb et al. (1997) appears to be the only source of developmental data on formant bandwidth. As mentioned earlier, the reduction in formant bandwidth observed in this study could be the result of reduced nasalization and/or a change in the biomechanical properties of the tissues of the vocal tract or volumetric changes in the pharyngeal region. Nasalization is further discussed later in this paper (see the section Acoustic Correlates of Velopharyngeal Anatomy), and it appears that changes in velopharyngeal function may very well account for reductions in formant bandwidth in the first two years of life.
5b. Jumps in vowel acoustic space
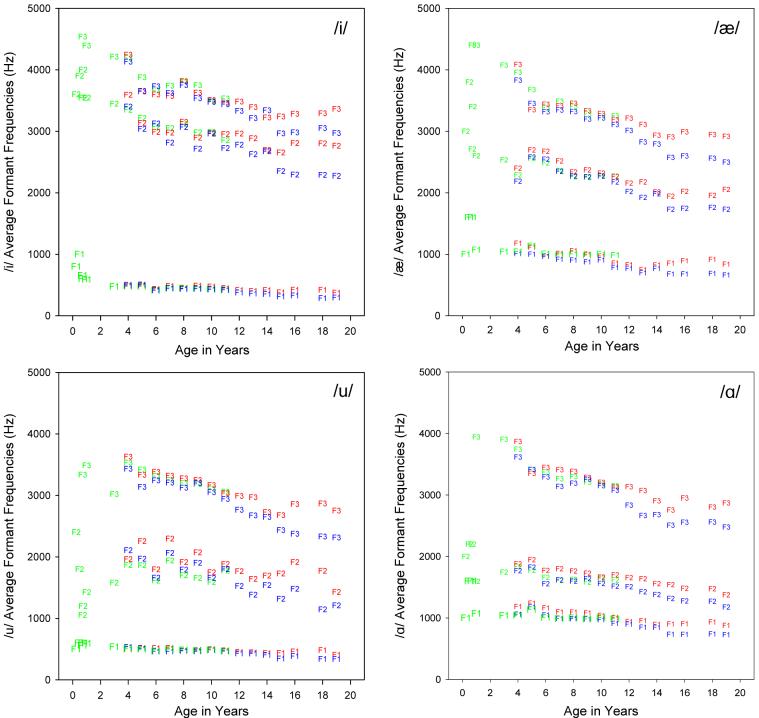
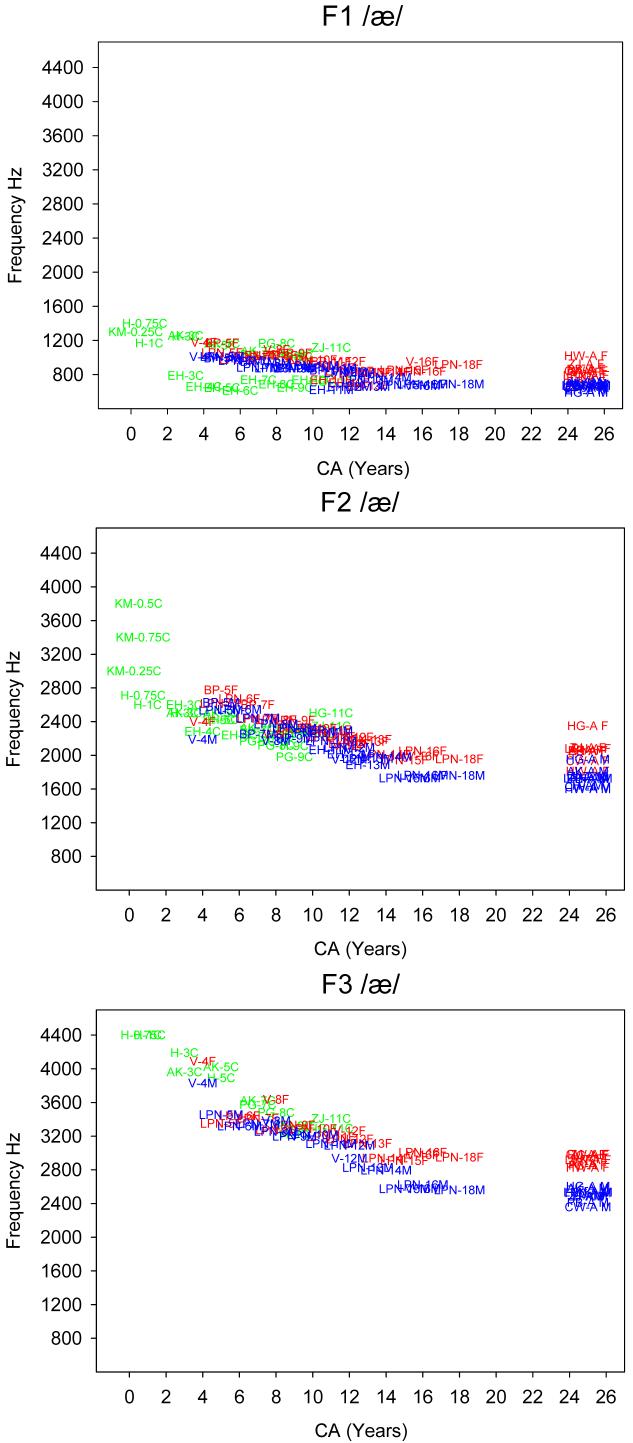
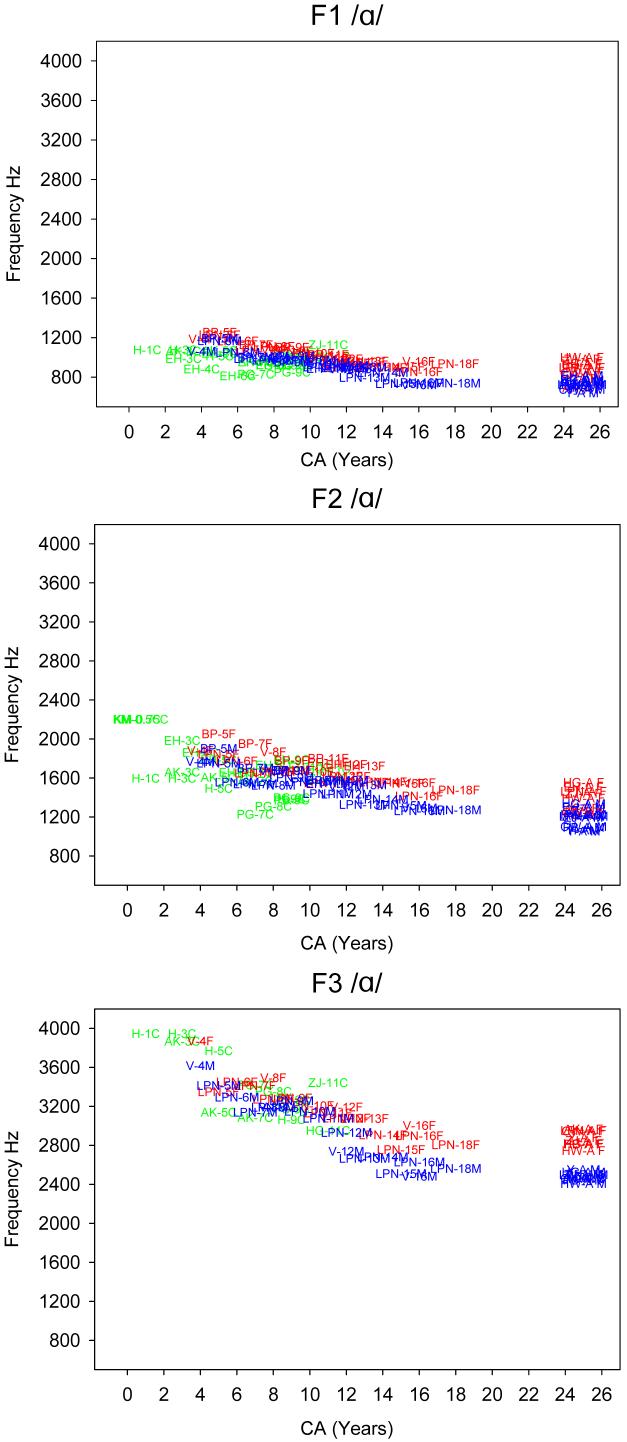
An interesting observation based on Figures 2 to 7 is that across the age increments plotted, there are notable jumps or skips in the F1-F2 and F1-F3 vowel acoustic data between particular age groups. That is, changes in formant frequencies are nonlinear with respect to chronological age. Two types of jumps can be noted, an overall jump in vowel acoustic space and a limited jump in the low vowel region of the vowel acoustic space. In Figure 2, summary of male acoustic data, there is a noticeable overall jump in the F1-F2 vowel acoustic space between the ages 14 to 15 where abrupt drops in F1 and F2 formant frequencies can be noted for all corner vowels. For example, between the ages 14 to 15, the first and second formant frequencies for the low-back vowel /ae/ drop about 100 Hz and 250 Hz respectively. In Figure 4, summary of child acoustic data, there is a noticeable overall jump in F1-F2 vowel acoustic space between the ages 1 and 4, i.e. an abrupt change in the first and second formant frequencies for all corner vowels. Similar overall jumps in the F1-F3 acoustic space can be noted at similar ages in Figure 5 (males) and Figure 7 (children). It is reasonable to relate these jumps in vowel acoustic space to the primary descent of the larynx and the secondary descent of the larynx during adolescence, particularly in males (Fitch & Giedd, 1999). Abrupt increases in vocal tract length cause abrupt decreases in formant frequencies and hence a jump in vowel acoustic space. A slightly different jump in vowel acoustic space is apparent in Figure 3, summary of female acoustic data, where between the ages 10 and 12 there is a jump in the F1-F2 acoustic space that is limited to the low vowels. For example, for the low-front vowel /ae/, the average of both F1 and F2 values drop about 150 Hz. A similar jump in the F1-F2 acoustic space that is again limited to the low vowels can also be noted in Figure 4, summary of child acoustic data, between the ages 5 and 6. Identical jumps can be noted in the F1-F3 acoustic space in Figures 6 (female) and 7 (children). Figure 12 is a composite display of the male, female and children's average F1, F2 and F3 values for all four corner vowels which were used to create the vowel quadrilaterals in Figures 2 to 7. Abrupt and concurrent changes in all formant frequencies at various ages are apparent including the ones described above.
Figure 12.
A composite display of the male, female and children's average F1, F2 and F3 values across studies for the four corner vowels across age. The formant averages are the same as those displayed in the vowel quadrilaterals in Figures 2 to 7.
Although quantitative anatomic data on the developing vocal tract are limited, it is well known that the growth of the vocal tract is nonuniform, for example, the ratio of the pharyngeal (posterior) region to oral (anterior) region of the vocal tract is larger for adult males compared to adult females and children (Fant, 1975). Thus, it is reasonable to further postulate that differences in jumps in the vowel acoustic space – overall versus limited to low vowel region – are related to differences in the anterior/oral versus posterior/pharyngeal regions of the vocal tract. Based on Figures 3 and 4, it appears that such differences become evident between ages 5 and 7 and are well established between the ages 10 and 12. Indeed, Lieberman, McCarthy, Hiiemae, and Palmer (2001) using a longitudinal series of radiographs, determined that the ratio of pharynx height to oral cavity length decreased significantly between birth and 6 to 8 years. They also observed that certain aspects of vocal tract shape changed markedly during the first postnatal year and during adolescence. Additional quantitative anatomic data on the developmental changes in the length of the anterior/oral or horizontal vocal tract and height of the posterior/pharyngeal or vertical vocal tract regions across sex, specially in conjuction to data on the width, area or volume in the pharyngeal region, would be of value since there is physical evidence that by age 12, boys have a larger neck circumference (Bennett, 1981; Perry et al. 2001).
5c. Variability roots
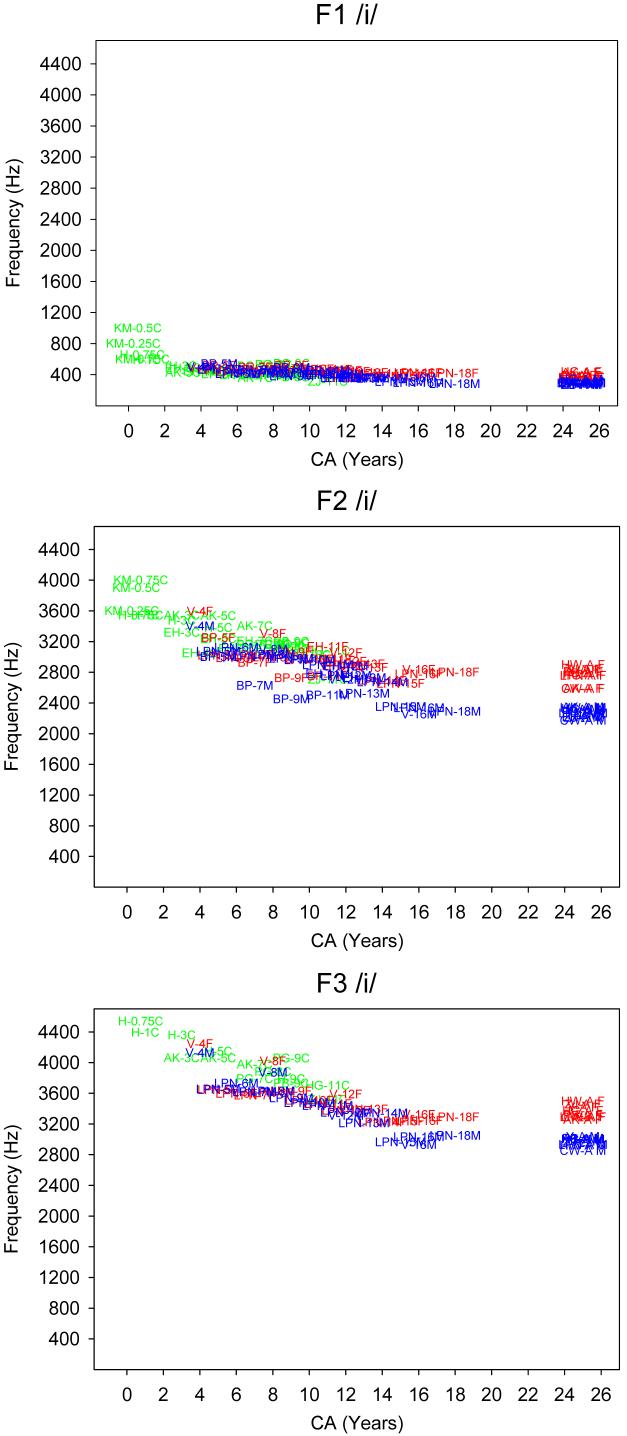
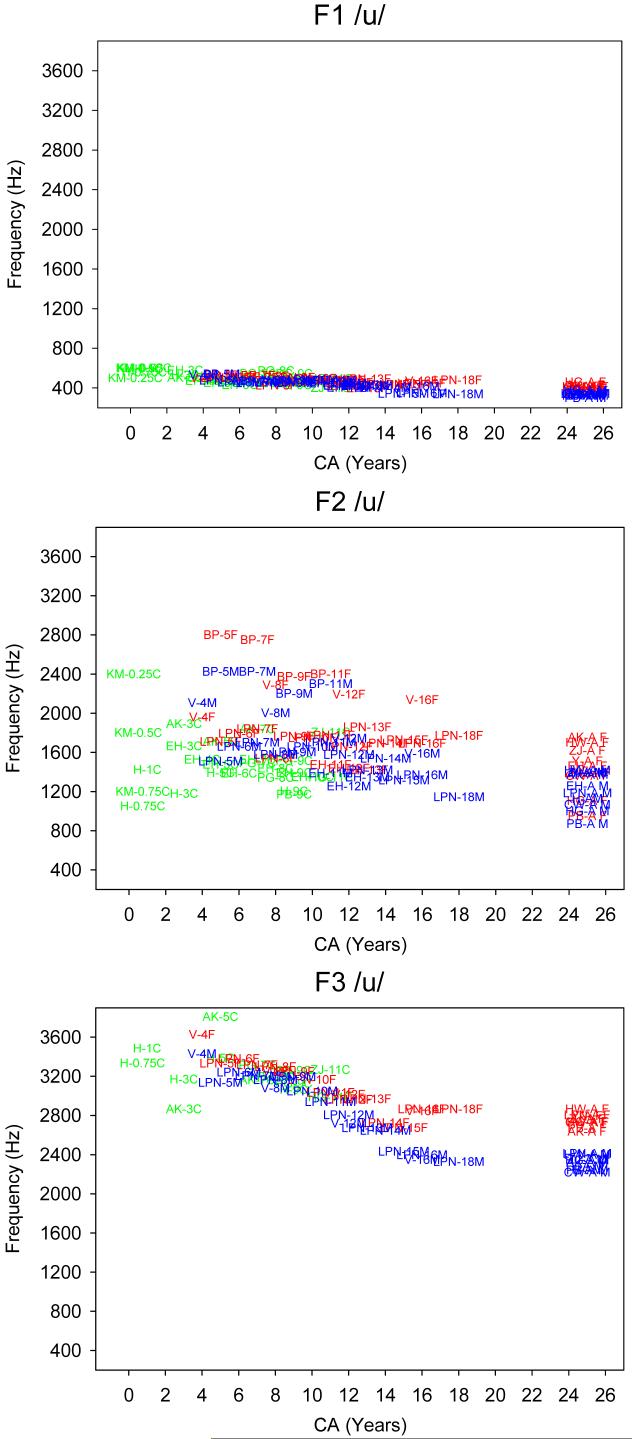
As reviewed in section 2 above, formant-frequency variability is a measure that is typically used to assess inter and intra-speaker articulatory variability. An interesting observation can be seen in Figures 13, 14, 15 and 16 comparing the average F1, F2 & F3 values for the different vowels during the course of development. In general, there is minimal variability in F1 for the high vowels, but increased variability in F2 particularly for the high-back vowel /u/ across the entire developmental age range. Nittrouer (1993) concluded that the emergence of mature gestural patterns is not uniform. Similarly, the growth of the pharyngeal versus oral regions of the vocal tract is not uniform (Fant, 1975). The increased variability of F2 for the high-back vowel /u/ across the entire developmental age range may indicate that variability is rooted in several factors, including the influence of dialect, articulatory variability, and variability due to the non-uniform anatomic growth of the vocal tract, particularly in the posterior pharyngeal region which, as noted above in section II.B, is typically affiliated with the second formant.
Figure 13.
Average F1, F2 & F3 values per study by chronological age (CA) for the vowel /i/ during the course of development for the 3 groups, children (green), females (red) and males (blue).
Figure 14.
Average F1, F2 & F3 values per study by chronological age (CA) for the vowel /u/ during the course of development for the 3 groups, children (green), females (red) and males (blue).
Figure 15.
Average F1, F2 & F3 per study values by chronological age (CA) for the vowel /ae/ during the course of development for the 3 groups, children (green), females (red) and males (blue).
Figure 16.
Average F1, F2 & F3 per study values by chronological age (CA) for the vowel /a/ during the course of development for the 3 groups, children (green), females (red) and males (blue).
6. Sex differences
At some point in development, males and females have vocal tracts that differ in length and shape. It appears from the composite acoustic data in Figures 2 to 7, and Figures 13 to 16, that sexual dimorphism of the vocal tract emerges by the age of 4, and the differences become more apparent by age 7 or 8 years where boys have consistently lower formant frequencies than girls across all vowels (Bennett, 1981; Busby & Plant, 1995; Lee et al., 1999; Perry, Ohde, & Ashmead, 2001; Whiteside & Hodgson, 2000). Additional acoustic differences become more apparent after age 12 where discrete male-female differences in f0 are evident (see Figure 17), and as significant differences in vocal tract length emerge (Fitch and Giedd, 1999). Thus, the acoustic data converge on the conclusion that sex differences in speech acoustics begin in early childhood, well before puberty. The identification of speaker sex before age 12 must be predominantly due to differences in the resonator/vocal tract but not its length. Childers & Wu (1991) note that F2 is a better recognizer of gender than f0. As seen in Figures 2 to 7 and 13 to 16, the pattern of F1, F2, and particularly F3 dispersions/differences for the different vowels is not consistent for males versus females. Thus, to determine the anatomic correlate for such developmental acoustic differences in F1, F2 and F3, it is necessary to assess empirically the changes in pharyngeal length/height and width/area/volume during the course of development and to compare the pharyngeal dimensions with those of the oral portion of the vocal tract.
D. Vocal Tract Normalization
The problem of vocal tract normalization (also known as speaker normalization) is a longstanding issue in acoustic phonetics and, more recently, in speech technologies such as automatic speech recognition (Fant, 1975; Martland, Whiteside, Beet, & Baghari-Ravary, 1996). The formant frequency differences summarized in this paper motivate the need for scaling factors that normalize for age-sex differences in the acoustic properties of speech. Normalization for vocal tract length is complicated by an apparent sex or gender difference in the articulation of low vowels and by idiolectal/dialectal differences in vowel production. As noted in Figures 2, 3, 5 & 7, the largest sex differences in vowel formant frequencies occur for F1 for the low vowels /ae/ and /a /, and for F2 of vowel /i /. These differences in vowel formant frequencies may reflect some articulatory differences between boys and girls in addition to differences in vocal tract length and more specifically differences in anterior/oral versus posterior/pharyngeal portions of the vocal tract that affect formant-cavity affiliations. For example, the large difference in F1 frequencies for the low vowels might mean that boys produce these vowels with a relatively more open jaw position; and differences in F2 frequencies for the high-front vowel may be indicative of sex differences in oropharyngeal length, width and volume as noted in section II.B above on anatomic-acoustic relationships.
It is not entirely clear if a uniform scaling factor suffices to normalize vowel formant frequencies for both boys and girls (Fant, 1975; Kent, 1976; Lee et al., 1999; Martland et al., 1996; Whiteside & Hodgson, 2000). Lee et al. (1999) observed a linear change in formant frequencies for males between the ages of 11 to 15 years and concluded that their data are consistent with the hypothesis of uniform axial growth. However, in a re-analysis of the data of Lee et al. (1999), Whiteside (2001) concluded that there was a nonlinear increase in the tonotopic distance between male and female data for vowel formant frequencies. Similarly, White (1999) concluded that vowel-dependent formant frequency differences between boys and girls indicate non-uniform differences in the dimensions of male and female vocal tracts. White also noted that these sex differences were not consistent with data for adult vowels. White's data for 29 11-year-old children showed that formant frequencies were higher for speech than for singing and also were higher for girls than for boys.
The findings in this paper indicate that while the prediction from standard acoustic theory holds that vowel formant frequencies decrease as the vocal tract lengthens with age; such decreases are not necessarily linear with chronological age, as noted by the jumps or skips in formant frequencies at particular ages for each sex. Also, while there are noted developmental and sex differences in the anterior-oral versus the posterior-pharyngeal portions of the vocal tract, those differences are not limited to length of the cavities, particularly the posterior-pharyngeal cavity, but also cavity width and subsequently volume. These findings of nonlinear changes in formant frequencies, and the indications that the nonuniform growth of the vocal tract is not limited to length only, imply that the developmental changes in anatomic-acoustic interactions or formant-cavity affiliations is fairly complex which may be why uniform scaling factors are not entirely adequate.
Studies of speech perception show that information about vocal tract length is segregated at an early stage in the auditory processing of speech (Ives, Smith, Patterson, 2005; Smith, Patterson, Turner, Kawahara, & Irino, 2005). Smith et al. further showed that listeners are capable of fine judgments of the relative size of speakers, and they make such judgments even for vowels that are scaled outside the normal range. The ability to accomplish such normalization of size is part of a listener's auditory competence for speech.
III. Acoustic Correlates of Laryngeal Development
A. Anatomic-physiologic Considerations
As summarized by Eckel et al. (2000) the human larynx reflects several evolutionary adaptations, including (a) descent of the larynx; (b) capability of the vocal fold adjustments in length, tension, and shape; (c) and the relative prominence of the membranous part of the folds over the cartilaginous portion. Nishimura (2003) asserted that the evolutionary descent occurred in two steps, the first being a descent of the thyroid in relation to the hyoid, and the second, descent of the hyoid within the neck. He believed that the second marked the evolution of human speech. With respect to ontogenetic changes in the larynx, Eckel et al. (2000) remark, “The infant larynx is not just a miniature of the adult organ. It shows differences in its position relative to the vertebral column, in the composition of cartilages and soft tissues, and in environmental adaptation” (p. 501). Anatomically, the infant vocal folds are about 4-5 mm long and the composition of the lamina propria is uniform (i.e., there is no lamination corresponding to adult vocal folds) (Sato, Hirano, & Nakashima, 2001). Between the ages of 1 to 4 years, the vocal ligament (the intermediate and deep layers of the lamina propria) appears, and vocal fold length (∼ 7.5 mm by age 5) as well as laryngeal size increases. According to Crelin (1973), sexual dimorphism in laryngeal size begins to appear by age 3. However, Eckel et al. (1999) remarked that sex differences in laryngeal size are not present during early childhood. As for vocal fold length, sexual dimorphism is reported by about age 6-7 years (Kazarian et al., 1978). But these reported anatomic differences do not appear to contribute towards significant differences in f0 between males and females until puberty when laryngeal size, particularly the antero-posterior dimension of the thyroid cartilage increases threefold in males, along with increases in vocal fold length and differentiation in its composition. For the first two decades of life, the length of the vocal folds increases at about 0.7 mm per year in males and about 0.4 mm in females, so that the maximum adult length is 16 mm in men and 10 mm in women. Studies of collagen and elastin distribution in the vocal folds have shown variations related to both age and gender (Hammond, Gray, & Butler, 2000; Hammond, Gray, Butler, Zhou, & Hammond, 1998).
B. General Acoustic Considerations
Values of f0 can be estimated from geometric and biomechanical properties according to the formula for a string model for frequency:
f0 = 1 / 2L (T/ρ)0.5
Where L is the length of the folds,
T is the tension of the vocal fold mucosal cover, and
ρ is the density of the tissue.
In infants, the f0 range is between 300-600 Hz and the mean f0 is relatively stable until about 9 months. The f0 then begins to decline until adulthood. The decline is sharp between the ages 12 months and 3 years, so that by the age of 3 to 5 years, the mean in males and females is about 250 Hz. A more gradual decrease in f0 appears between ages 6 to 11 years. Sex differences in f0 are strongly evident during adolescence. The overall f0 decline from infancy to adulthood is about one octave for females, and two octaves for males But change in level of f0 is only one part of the developmental pattern in relation to laryngeal function. At some point in development, children learn to make optimal adjustments between laryngeal and supralaryngeal actions. Wermke, Mende, Manfredi, & Bruscaglioni (2002) concluded that infants aged 15 to 17 weeks demonstrated an increased coupling and tuning between cry melody and resonance frequencies. This observation was interpreted to reflect intentional articulatory activity, that is, at this age, infants begin to make articulatory adjustments to effect greater coupling between source and vocal tract.
Lee et al. (1999) observed that f0 differences between male and female children were statistically significant beginning with the age of 12 years. However, Hacki and Heitmuller (1999) reported a lowering of both the habitual pitch and the entire speaking pitch range between the ages of 7 and 8 years for girls and between the ages of 8 and 9 years for boys. Hacki and Heitmuller also concluded that the beginning of the mutation occurs at the ages of 10 to 11 years. Mean f0 change is pronounced in males between the ages of about 12 and 15 years. For example, Lee et al. (1999) reported a 78% decrease in f0 for males between these ages. No significant change was observed after the age of 15 years, which indicates that the voice change is effectively complete by that age (Busby & Plant, 1995; Hollien, Green, & Massey, 1994; Kent & Vorperian, 1995).
In summary, major developmental features of the larynx include: (a) substantial growth of laryngeal structures in puberty (Kent & Vorperian, 1995); (b) a lack of sexual dimorphism of the larynx in childhood (Eckel, et al., 1999); and (c) differentiation of the layers of the lamina propria at about 12 years of age (Hirano, et al., 1983; Yamashita, 1997).
C. Vocal f0 Data from Database Sources
Data on f0 are restricted to those studies that reported both f0 and formant results. Figure 17 shows the average f0 data across the 4 corner vowels as a function of age. These data mirror those reported in Kent (1976) in showing a relatively stable f0 during the first year, a relatively rapid decrease in early childhood, a more gradual decrease until puberty, and then a rapid decrease during adolescence (more so in males than females) whereby conspicuous differences in male-female f0 are evident by age 12 (Lee et al. 1999, Perry et al. 2001). An implication of these data for estimates of formant frequency is that the error of estimation related to f0 should be relatively stable over the age range of about 3 to 12 years. It should be noted that there is substantial variability in the f0 values in different studies of infant vocalization. For example, Kuhl and Meltzoff (1996) reported a mean f0 of about 320 Hz for 12-, 16-, and 20-week-old infants who imitated vowel sounds produced by an adult model. This value is low compared to studies of infant cry and comfort-state vocalizations, perhaps because the infants in the imitation task imitated not only vowel quality but also characteristics of the speaker's voice.
D. Effects of Vocalization Type and Task
The data presented to this point pertain to vocalic segments derived from either babbling or from selected speech samples. The question arises as to how these data relate to data on other types of vocalization, such as infants' imitations of adult vowels or the vocalic elements in newborn cry. Establishing relationships across these different types of vocalization is a major step in understanding the developmental coherence of formant frequency data. The developmental progression seen earlier in the F1-F2 and F1-F3 patterns are the result of several factors, principally the anatomic growth of the vocal tract, the refinement of speech motor control, and the establishment of internal representations for the vocal tract configurations for the vowels of English. The interplay among these factors accounts for the results that are associated with different kinds of studies, especially when different vocalization tasks are involved.
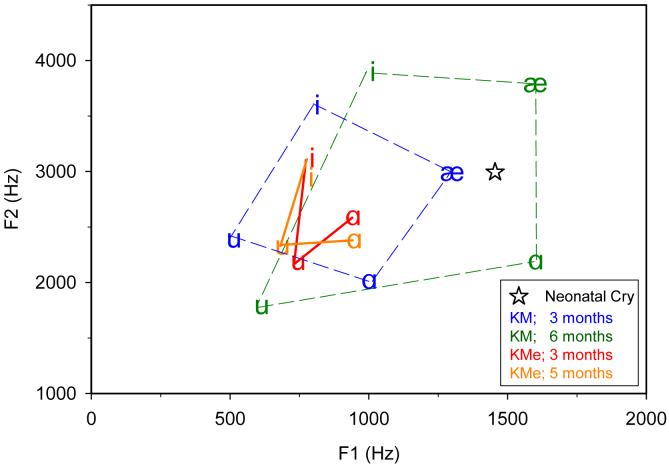
Figure 18 shows the results of a vowel imitation study (Kuhl & Meltzoff, 1996) compared with the results of a study of spontaneous vocalizations in infancy (Kent and Murray, 1982). The imitation study analyzed the F1-F2 patterns associated with infants' imitations of the vowels /i/, /u/, and /a/ modeled by an adult speaker. The infants' F1-F2 patterns show a vowel distinctiveness in the expected directions of acoustic contrast (e.g., relatively high F2 frequency for vowel /i/), but the overall differences in the F1 and F2 frequencies are very conservative compared to the formant frequency values reported for spontaneous productions in Kent and Murray (1982).
Figure 18.
Comparison of acoustic space of young infants from 2 studies KM (Kent & Murray, 1982) and KMe (Kuhl & Meltzoff 1996) with different methodologies at ages .25 (3 months), .42 (5 months) and .50 (6 months). KM used free vocalizations, KMe used imitation. The average F1-F2 for the infant cry from Gardosik, Ross, and Singh (1980), Colton and Steinschneider (1980) and Robb and Cacace (1995) is also plotted for comparison.
The birth cry is another vocalization type that has been studied fairly extensively. This vocalization typically marks the beginning of a lifetime of vocal behavior. In a study of 55 male and 53 female newborns, Gardosik, Ross, and Singh (1980) determined that the birth cry has an average f0 of about 460 Hz, first-formant frequency of about 1550 Hz, and second-formant frequency of 3100 Hz. Similarly, in a study of the cries of 35 male and 31 female newborns, Colton and Steinschneider (1980) reported a mean f0 of about 510 Hz, a mean F1 frequency of about 1620 Hz, a mean F2 frequency of about 3250 Hz, and a mean F3 frequency of about 5350 Hz. Robb and Cacace (1995) compared three different methods of formant estimation (sound spectrography, linear predictive coding, and power spectrum in the analysis of cries from 20 term infants. Estimates of F1, F2, and F3 differed somewhat with method of analysis. Means calculated from the three different methods are: F1 = 1196 Hz, F2 = 2634 Hz, F3 =4217 Hz. The average f0 was 512 Hz. In Figure 18, the average F1 (1455 Hz) and F2 (2995 Hz) values of the infant cry from those three studies is plotted, to allow comparison with the formant patterns described earlier for vowel imitations and spontaneous vowel productions. When compared with the F1-F2 and F1-F3 plots in this article, these values are relatively high and are therefore consistent with a very short vocal tract in the neonate.
IV. Acoustic Correlates of Velopharyngeal Anatomy
A. Anatomic-physiologic Considerations
A major allophonic variation of vowels in English is nasalization, which typically occurs when a vowel is adjacent to a nasal consonant. The capability for nasal versus nonnasal vowel production emerges in infancy, and anatomy of the velopharyngeal complex is one factor that accounts for developmental changes in nasalization. During development, infants transition from almost exclusively nasalized vocalizations to vocalizations with an increasing degree of oral resonance. The velopharynx is open for the birth cry (Bosma, Truby, & Lind,, 1965) but is closed for oral sounds by the age of 3 years (Leeper, Tissington, & Munhall, 1998; Thompson & Hixon, 1979). Although only limited data have been published for the interval between birth and 3 years, it appears that velopharyngeal closure for speech-like utterances is still developing at 6 months of age (Thom, Hoit, Hixon, & Smith, 2005), which just precedes the typical onset of canonical babbling at 7 to 10 months (Oller, 2000). Anatomic changes occurring around this period include a separation of the epiglottis and velum that accompanies the descent of the laryngeal framework (Sasaki, Levine, Laitman, & Crelin, 1977). This epiglottal descent continues into adolescence (Schwartz & Keller, 1997). Using MRI data, Vorperian et al. (2005, p. 342) report data on the continuous descent of the larynx and the hyoid bone between the ages birth to 7 years, with the rate of descent being faster during the first two years of life.
Around the age of 3 to 5 years, another anatomic change may cause adjustments in velopharyngeal function. At about this time, hypertrophy of the nasopharyngeal tonsil (adenoid) is common. In a MRI study, Jaw, Sheu, Liu, and Lin (1999) reported that adenoids could be identified in only 18% of infants under the age of 3 months, 75% of infants aged 4 months, and 100% of infants older than 5 months. After rapid development in infancy, adenoids reached a plateau between 2 and 14 years of age when they had a thickness ranging from 10.7 to 12.2 mm. After the age of 15 years, the adenoids regressed rapidly. Similar data were reported by Vogler, Ii, and Pilgram (2000) who studied 189 subjects using MRI. Their data show that the adenoid pad achieved its maximum thickness (14.6 mm) during the age interval of 7 to 10 years. By comparison, the thickness was only about 5 mm by the age of 60 years. Vilella, Vilella, and Koch (2006) reported that adenoid sagittal thickness reached its maximum at the age of 4 to 5 years and progressively decreased after that age except for a slight increase at 10 to 11 years. Although the data from these reports are not completely congruent with respect to the age of maximum thickness of the adenoid pad, they are consistent with a lymphatic growth pattern that reaches its maximum during childhood and then follows an atrophic decline into adulthood.
In contrast to the adenoid, growth of the velopharyngeal tissues continues through adolescence. Akguner (1999) determined that growth of the hard palate ceases by the age of 15 years, but that the soft palate continues to grow. Age-related anatomic changes in the velopharyngeal system may require adjustments in motor control as a child tries to maintain speech of adequate intelligibility and good quality. It has been reported that a majority of normally speaking children change their patterns of velopharyngeal valving between prepuberty and postpuberty (Siegel-Sadewitz & Shprintzen, 1986).
B. Acoustic Considerations
This section addresses two fundamental questions concerning nasality (a perceptual attribute) or nasalization (an acoustic property). The first is whether nasality or nasalization changes with development, and the second is whether speaker sex differences occur in the degree of nasality or nasalization at any age. With respect to the first question, the evidence is mixed, with some acoustic studies showing a developmental effect (Awan, 2001) but others not (Van Doorn & Purcell, 1998). When a developmental effect is observed, the degree of nasality is greater in adults than in young children. This age difference is consistent with the relatively larger lymphatic tissue in the velopharynx of children compared to adults (see preceding section and the review by Kent & Vorperian, 1995). It has been reported that nasality and duration distinguish early syllabic vs. vocalic utterances with syllabic vocalizations being longer and less nasal than vocalic ones (Bloom, 1988; Bloom et al., 1987). Further, Masataka and Bloom (1994) reported that adults prefer infant vocalizations that are less nasal and suggested that this preference is cross-linguistically universal. Judging from the physiologic data considered earlier, it is likely that the capability for reliable velopharyngeal closure during vocalization is developed by 7 to 9 months, when repetitive or canonical babbling usually begins. Sexual dimorphism is indicated by Bloom, Moore-Schoenmakers, and Masataka (1999) who report on sex differences in the nasality of early vocalizations. Their study shows that adults rated the vocalizations of 3-month-old boys as more socially favorable (pleasant, friendly, fun, likeable, cuddly, cute) than those of girls producing similar syllabic sounds. Acoustic analyses indicated that only the feature of nasality appeared to distinguish the boys' and girls' vocalizations. They concluded that the adult's favorability ratings related to sex of the infants reflected by the less nasal acoustic quality of the boys' voices.
Whether sex-related differences in nasality extend beyond infancy is not easily answered because published studies do not present a consistent picture. Generally, acoustic studies of older children and adults have not shown sex-related differences in nasalization (Litzaw & Dalston, 1992; Mra, Sussman, & Fenwick, 1998; Prathanee, Thanaviratananich, Pongjunyakul, & Rengpatanakij, 2003; Sweeney, Sell, & O'Regan, 2004; Van Doorn & Purcell, 1998). However, in some studies, women were reported to be more nasal, or have greater nasalance, than men (Bloom, Zajac, & Titus, 1999; Seaver, Dalston, Leeper, & Adams, 1991; van Lierde, Wuyts, De Brodt, & Cauwenberge, 2001). Nasality is of interest for technical, biological, and cultural reasons. Technically, nasality can interfere with acoustic estimates of vowel formant frequencies, because nasal resonance can be considered as a distortion added to the oral resonance pattern. If nasalization is suspected, particular care should be exercised in using LPC analyses, most of which are based on an all-pole model and neglect zeroes that arise with bifurcation of the resonator. Biologically, nasality that differs between males and females could reflect sexual dimorphism in velopharyngeal anatomy and physiology. Culturally, nasality differences between males and females could be the result of learned differences in velopharyngeal function, even if the anatomy of this system is not sexually dimorphic. To our knowledge, anatomic differences in the velopharyngeal system have not been demonstrated for children as young as 3 months. Unless the aforementioned differences in nasality between boys and girls are based on functional differences in the control of the velopharyngeal system, the most reasonable hypothesis is that undiscovered differences in velopharyngeal anatomy account for the nasality differences between infant boys and girls. It has been shown that men and women have different patterns of velopharyngeal closure (McKerns & Bzoch, 1970), but the age of appearance of this difference is not known.
V. General Discussion
To summarize findings, acoustic data from the studies reviewed in this paper indicate that vowel development is expressed as: (i) establishment of a language-appropriate acoustic representation (e.g., the F1-F2 quadrilateral or a F1-F2-F3 space) with the F1-F3 patterns having a greater developmental dispersion than the F1-F2 patterns particularly for males, and thus F1-F3 analyses may be more sensitive to changes due to age and possibly gender, (ii) gradual reduction in formant frequencies with age accompanied by a decrease in F1-F2 area, (iii) reduction in formant-frequency variability, possibly with an earlier stability for F1 than F2, (iv) emergence of male-female differences in formant frequency by the age of 4 years, with the differences becoming more apparent by 8 years and most discrete by age 16, (v) nonlinear change in formant frequencies with age, with jumps in formant frequency at ages corresponding to anatomic growth spurts in all or part of the vocal tract, (vi) a decline of f0 after the first year of life, with the decline being more rapid during early childhood (birth to 3 years) and adolescence, particularly for males whereby distinct male-female differences in f0 emerge after age 12; the f0 seems to be relatively stable over the age range of about 3 to 12 years, (vii) maturation of velopharyngeal function by about 1 year of age, which enables nonnasal vowel production, and (viii) identification of speaker sex related difference before age 12 is mostly due to differences in the resonator but not the length of the vocal tract. The data summarized here provide a developmental perspective on one of the most frequently reported acoustic measures of speech production. These data, though limited between the ages birth to 3, are a useful referent for studies of phonetic development, speaker normalization, sex differences, and other aspects of speech production.
In efforts to document vowel mastery acoustically, both the chronological age and the sex of the child should be noted. In addition, other indexes of growth such as head circumference, neck diameter, weight, and height and percentile growth should also be secured since height has been closely correlated to vocal tract length (Fitch, 2000). Ideally acoustic documentation of vowel mastery should include most of the vowels present in a particular language with special attention given to include the extreme corner vowels in the F1-F2-F3 acoustic space. The acoustic analysis also should take into account changes beyond the first two formant frequencies, should document fundamental frequency measures per vowel, and should consider formant bandwidths, and assessment of nasalization. Repetition of vowel tokens secured should also be included to help assess/delineate variability versus developmental change. Progress in the acoustic analysis of children's speech is giving a more complete picture of factors in speech development. In particular, the data help to define the overall pattern of growth and development of the speech production system, and how this pattern differs between males and females. Advancement of developmental articulatory models, such as Menard et al. 2004, that are also sex specific would also be helpful. Sexual dimorphism of the speech production system may begin in some respects in infancy and then unfolds over several years, with anatomic and physiologic differences appearing at different times in the velopharyngeal system, vocal tract length, and the laryngeal system. Different conclusions have been published regarding the onset of sexual dimorphism of the speech production system, probably because different studies have focused on different aspects and parts of the system. It appears that a complex chronology of emerging sexual dimorphism is the most accurate picture. With the further accumulation of acoustic and anatomic data, it should be possible to construct a more accurate picture of sex differences. Another challenge is to relate formant-frequency data on vowels with imaging data on the vocal tract. As discussed in this paper, the data on formant frequencies, especially for F1 and F2 alone, do not always match with conclusions derived from anatomic studies using imaging methods such as MRI. More comprehensive acoustic studies are needed, preferably including data on at least the first three formants (frequencies and bandwidths). It is also desirable to obtain more accurate information on the vocal tract, including 3-dimensional shape and characteristics of the piriform sinuses (Baer, Gore, Gracco, & Nye, 1991; Clement et al., in press; Dang & Honda, 1997; Story, Titze, & Hoffman, 1998).
Consideration of these data in some kind of perceptually-motivated transformation is a logical next step. The current effort assembled the data in keeping with the data collection standard, which is the linear frequency scale. To be sure, various transformations would reduce to some degree the variation in formant frequencies across different age-sex groups. Selection of the ideal transform for normalization purposes is beyond the scope of this paper. Several issues arise in selecting the ideal transform, including whether the procedure should be vowel-intrinsic or vowel-extrinsic (Adank, Smits, & van Hout, 2004), nature of the vowel system (Disner, 1980), and transformation algorithm (Hermansky, 1990; Hillenbrand & Houde, 2003; Miller, Engebretson, & Vemula, 1980; Syrdal & Gopal, 1986; Zahorian & Jagharghi, 1991).
The data summarized here are one step in the acoustic description of speech development, and they can be considered as a framework for the eventual acoustic description of consonants and prosodic features, and for the specification of the acoustic correlates of speech disorders in children. Generalization to other languages should be done cautiously, given evidence that vowels that are considered to be phonetically equivalent in two different languages may have distinctive formant-frequency patterns (Kent & Read, 2002). It should be reiterated that dialectal influences in these data cannot be identified with certainty, but such influences likely exist. Above all, the point to be made is that research over 5 decades since the publication of the seminal paper by Peterson and Barney (1952) has given a sharper, more detailed picture of the ways in which age and sex determine the formant-frequency patterns for the vowels of English. This 50-year retrospective is accompanied by the recent availability of high-quality images of the vocal tract through the methods of MRI and CT.
ACKNOWLEDGEMENTS
This work was supported in part by NIH Research Grants R03 DC4362 (Anatomic Development of the Vocal Tract: MRI Procedures), R01 DC6282 (MRI and CT Studies of the Developing Vocal Tract), and R01 DC00319 (Intelligibility Studies of Dysarthria) from the National Institute of Deafness and other Communicative Disorders (NIDCD). Also, by a core grant P-30 HD03352 to the Waisman Center from the National Institute of Child Health and Human Development (NICHHD). We thank Mary Lindstrom for preparation of Figures 2-7; Hetal Pathak, Mike Schimek, Andrea Kettler, Allison Carolan and Reid Durtschi for assistance with the preparation of the remaining figures; also, special thanks to Hetal Pathak and Andrea Kettler for assistance with preparation of summary acoustic spreadsheet from the various papers. Finally, we sincerely thank two anonymous reviewers for their very meticulous and critical review. The feedback and suggestions we received were invaluable in our revisions.
References
- Adank P, Smits R, van Hout R. A comparison of vowel normalization procedures for language variation research. Journal of the Acoustical Society of America. 2004;116:3099–3107. doi: 10.1121/1.1795335. [DOI] [PubMed] [Google Scholar]
- Akguner M. Velopharyngeal anthropometric analysis with MRI in normal subjects. Annals of Plastic Surgery. 1999;43:142–147. [PubMed] [Google Scholar]
- Arens R, McDonough JM, Corbin AM, Hernandez ME, Maislin G, Schwab RJ, Pack AI. Linear dimensions of the upper airway structure during development: Assessment by magnetic resonance imaging. American Journal of Respiratory and Critical Care Medicine. 2002;165:117–122. doi: 10.1164/ajrccm.165.1.2107140. [DOI] [PubMed] [Google Scholar]
- Awan SN. Age and gender effects on measures of RMS nasalance. Clinical Linguistics and Phonetics. 2001;15:117–122. doi: 10.3109/02699200109167642. [DOI] [PubMed] [Google Scholar]
- Baer T, Gore JC, Gracco LC, Nye PW. Analysis of vocal tract shape and dimensions using magnetic resonance imaging: vowels. Journal of the Acoustical Society of America. 1991;90:799–828. doi: 10.1121/1.401949. [DOI] [PubMed] [Google Scholar]
- Bennet S. Vowel formant frequency characteristics of preadolescent males and females. Journal of the Acoustical Society of America. 1981;69:231–238. doi: 10.1121/1.385343. [DOI] [PubMed] [Google Scholar]
- Bloom K. Quality of adult vocalizations affects the quality of infant vocalizations. Journal of Child Language. 1988;15:469–480. doi: 10.1017/s0305000900012502. [DOI] [PubMed] [Google Scholar]
- Bloom K, Moore-Schoenmakers K, Masataka N. Nasality of infant vocalizations determines gender bias in adult favorability. Journal of Nonverbal Behavior. 1999;23:219–236. [Google Scholar]
- Bloom K, Russell A, Wassenberg K. Turn taking affects the quality of infant vocalizations. Journal of Child Language. 1987;14:211–227. doi: 10.1017/s0305000900012897. [DOI] [PubMed] [Google Scholar]
- Bloom K, Zajac DJ, Titus J. The influence of nasality of voice on sex-stereotyped perceptions. Journal of Nonverbal Behavior. 1999;23:271–281. [Google Scholar]
- Bosma JF, Truby HM, Lind J. Cry motions of the newborn infant [Monograph] Acta Paediatrica Scandinavica. 1965;163:63–91. [Google Scholar]
- Buhr RD. The emergence of vowels in an infant. Journal of Speech and Hearing Research. 1980;23:73–94. doi: 10.1044/jshr.2301.73. [DOI] [PubMed] [Google Scholar]
- Busby PA, Plant GL. Formant frequency values of vowels produced by preadolescent boys and girls. Journal of the Acoustical Society of America. 1995;97:2603–2606. doi: 10.1121/1.412975. [DOI] [PubMed] [Google Scholar]
- Casal C, Dominnguez C, Fernandez A. Spectrographic measures of the speech of young children with cleft lip and cleft palate. Folia Phoniatrica et Logopaedica. 2002;54:247–57. doi: 10.1159/000065197. [DOI] [PubMed] [Google Scholar]
- Childers DG, Wu K. Gender recognition from speech. Part II: Fine analysis. The Journal of the Acoustical Society of America. 1991;90:1841–56. doi: 10.1121/1.401664. [DOI] [PubMed] [Google Scholar]
- Clement P, Hans S, Hartl DM, Maeda S, Vaissiere J, Brasnu D. Vocal tract area function for vowels using three-dimensional magnetic resonance imaging. A preliminary study. Journal of Voice. doi: 10.1016/j.jvoice.2006.01.005. in press. [DOI] [PubMed] [Google Scholar]
- Clopper CG, Pisoni DB, de Jong K. Acoustic characteristics of the vowel systems of six regional varieties of American English. Journal of the Acoustical Society of America. 2005;118:1661–1676. doi: 10.1121/1.2000774. [DOI] [PMC free article] [PubMed] [Google Scholar]
- Crelin ES. Functional anatomy of the newborn. Yale University Press; New Haven, NJ: 1973. [Google Scholar]
- Colton RH, Steinschneider A. Acoustic relationships of infant cries to the Sudden Infant Death Syndrome. In: Murry T, Murry J, editors. Infant communication: cry and early speech. College-Hill Press; Houston: 1980. pp. 183–208. [Google Scholar]
- Dang J, Honda K. Acoustic characteristics of the piriform fossa in models and humans. Journal of the Acoustical Society of America. 1997;101:456–465. doi: 10.1121/1.417990. [DOI] [PubMed] [Google Scholar]
- De Wet F, Weber K, Boves L, Cranen B, Bengio S, Burlard H. Evaluation of formant-like features in an automatic vowel classification task. Journal of the Acoustical Society of America. 2004;116:1781–1792. doi: 10.1121/1.1781620. [DOI] [PubMed] [Google Scholar]
- Disner SF. Evaluation of vowel normalization procedures. Journal of the Acoustical Society of America. 1980;67:253–261. doi: 10.1121/1.383734. [DOI] [PubMed] [Google Scholar]
- Donegan P. Normal vowel development. In: Ball MJ, Gibbon F, editors. Vowel disorders. Butterworth/Heinemann; Boston: 2002. pp. 1–35. [Google Scholar]
- Eckel HE, Koebke J, Sittel C, Sprinzl GM, Potoschnig C, Stennert E. Morphology of the human larynx during the first five years of life studied on whole organ serial sections. Annals of Otology, Rhinology & Laryngology. 1999;108:232–238. doi: 10.1177/000348949910800303. [DOI] [PubMed] [Google Scholar]
- Eckel HE, Sprinzl GM, Sittel C, Koebke J, Damm M, Stennert E. Anatomy of the vocal folds and subglottic airway in children. [German] HNO. 2000;48:501–507. doi: 10.1007/s001060050606. [DOI] [PubMed] [Google Scholar]
- Eguchi S, Hirsh IJ. Development of speech sounds in children. Acta Otolaryngologica. 1969;(suppl 257) [PubMed] [Google Scholar]
- Endres W, Bambach W, Flosser G. Voice spectrograms as a function of age voice disguise, and voice imitation. Journal of the Acoustical Society of America. 1971;49:1842–1848. doi: 10.1121/1.1912589. [DOI] [PubMed] [Google Scholar]
- Epps J, Dowd A, Smith J, Wolfe J. Real time measurements of the vocal tract resonances during speech. In ESCA (European Speech Communication Association, Eurospeech97; Rhodes, Greece: 1997. pp. 721–724. [Google Scholar]
- Fant G. A note on vocal tract size factors and non-uniform F-pattern scalings. Speech Transmission Laboratory Quarterly Progress & Status Reports (Royal Institute of Technology, Stockholm) 1975;4:22–30. [Google Scholar]
- Ferguson CA, Farwell CB. Words and sounds in early language acquisition. Language. 1975;51:419–439. [Google Scholar]
- Fitch WT. The evolution of speech: a comparative review. Trends in Cognitive Sciences. 2000;4:258–267. doi: 10.1016/s1364-6613(00)01494-7. [DOI] [PubMed] [Google Scholar]
- Fitch T, Giedd J. Morphology and development of the human vocal tract: A study using magnetic resonance imaging. Journal of the Acoustical Society of America. 1999;106:1511–1522. doi: 10.1121/1.427148. [DOI] [PubMed] [Google Scholar]
- Fort A, Manfredi C. Acoustic analysis of newborn infant cry signals. Medical Engineering & Physics. 1998;20:432–442. doi: 10.1016/s1350-4533(98)00045-9. [DOI] [PubMed] [Google Scholar]
- Gardosik TA, Ross PJ, Singh S. In: Infant communication: cry and early speech. Murry T, Murry J, editors. College-Hill Press; Houston: 1980. pp. 106–123. [Google Scholar]
- Gilbert HR, Robb MP, Chen Y. Formant frequency development — 15 to 36 months. Journal of Voice. 1997;11:260–266. doi: 10.1016/s0892-1997(97)80003-3. [DOI] [PubMed] [Google Scholar]
- Green JR, Moore CA, Reilly KU. The sequential development of jaw and lip control in speech. Journal of Speech, Language, & Hearing Research. 2002;45:66–79. doi: 10.1044/1092-4388(2002/005). [DOI] [PMC free article] [PubMed] [Google Scholar]
- Hacki T, Heitmuller S. Development of the child's voice: premutation, mutation. International Journal of Pediatric Otorhinolaryngology. 1999;49(Suppl 1):S141–S144. doi: 10.1016/s0165-5876(99)00150-0. [DOI] [PubMed] [Google Scholar]
- Hagiwara RE. Dialect variation and formant frequency: the American English vowels revisited. Journal of the Acoustical Society of America. 1997;102:655–658. [Google Scholar]
- Hammond TH, Gray SD, Butler J. Age- and gender-related collagen distribution in human vocal folds. Annals of Otology, Rhinology, & Laryngology. 2000;109:913–920. doi: 10.1177/000348940010901004. [DOI] [PubMed] [Google Scholar]
- Hammond TH, Gray SD, Butler J, Zhou R, Hammond E. Age- and gender-related elastin distribution changes in human vocal folds. Otolaryngology-Head & Neck Surgery. 1998;119:314–322. doi: 10.1016/S0194-5998(98)70071-3. [DOI] [PubMed] [Google Scholar]
- Hermansky H. Perceptual linear predictive (PLP) analysis of speech. Journal of the Acoustical Society of America. 1990;87:1738–1752. doi: 10.1121/1.399423. [DOI] [PubMed] [Google Scholar]
- Higgins CM, Hodge MM. F2/F1 vowel quadrilateral area in young children with and without dysarthria. Canadian Acoustics. 2001;29:66–68. [Google Scholar]
- Hillenbrand JM, Getty LA, Clark MJ, Wheeler K. Acoustic characteristics of American English vowels. The Journal of the Acoustical Society of America. 1995;97:3099–111. doi: 10.1121/1.411872. [DOI] [PubMed] [Google Scholar]
- Hillenbrand JM, Houde RA. A narrow band pattern-matching model of vowel perception. Journal of the Acoustical Society of America. 2003;113:1044–1055. doi: 10.1121/1.1513647. [DOI] [PubMed] [Google Scholar]
- Hirano M, Kurita S, Nakashima T. Growth, development and aging of human vocal folds. In: Bless DM, Abbs JH, editors. Vocal fold physiology. College-Hill Press; 1983. [Google Scholar]
- Hodge M. Ph. D. dissertation. Univeristy of Wisconsin-Madison; 1989. A Comparison of Spectral-Temporal Measures Across Speaker Age:Implications for an Acoustic Characterization of Speech Maturation. [Google Scholar]
- Hollien H, Green R, Massey K. Longitudinal research on adolescent voice change in males. Journal of the Acoustical Society of America. 1994;96:2646–2654. doi: 10.1121/1.411275. [DOI] [PubMed] [Google Scholar]
- Irwin JV, Wong SP. Phonological development in children 18 to 72 months. Southern Illinois University Press; Carbondale, IL: 1983. [Google Scholar]
- Israel H. Continuing growth in the human cranial skeleton. Archives of Oral Biology. 1968;13:133–137. doi: 10.1016/0003-9969(68)90044-7. [DOI] [PubMed] [Google Scholar]
- Israel H. Age factor and the pattern of change in craniofacial structures. American Journal of Physical Anthropology. 1973;39:111–128. doi: 10.1002/ajpa.1330390112. [DOI] [PubMed] [Google Scholar]
- Ives DT, Smith DR, Patterson RD. Discrimination of speaker size from syllable phrases. Journal of the Acoustical Society of America. 2005;118:3816–3822. doi: 10.1121/1.2118427. [DOI] [PMC free article] [PubMed] [Google Scholar]
- Jaw TS, Sheu RS, Liu GC, Lin WC. Development of adenoids: a study by measurement with MR images. Kaohsiung Journal of Medical Sciences. 1999;15:12–18. [PubMed] [Google Scholar]
- Kazarian AG, Sarkissian LS, Isaakian DG. Length of the human vocal cords by age. Zhurnal Eksperimentalnoi I Klinicheskoi Meditsiny. 1978;18:105–109. [Note: the spelling of the author's names is consistent with the listing in MEDLINE; the original paper give the spelling as Ghazarian, Sargissian, & Isahakian.] [PubMed] [Google Scholar]
- Kent RD. Anatomical and neuromuscular maturation of the speech mechanism: Evidence from acoustic studies. Journal of Speech and Hearing Research. 1976;19:421–447. doi: 10.1044/jshr.1903.421. [DOI] [PubMed] [Google Scholar]
- Kent RD, Netsell R, Osberger MJ, Hustedde CG. Phonetic development in twins who differ in auditory function. Journal of Speech and Hearing Disorders. 1987;52:64–75. doi: 10.1044/jshd.5201.64. [DOI] [PubMed] [Google Scholar]
- Kent RD, Read C. The acoustic analysis of speech. 2nd ed. Singular/Thomson Learning; Albany, NY: 2002. [Google Scholar]
- Kent RD, Murray AD. Acoustic features of infant vocalic utterances. Journal of the Acoustical Society of America. 1982;72:353–365. doi: 10.1121/1.388089. [DOI] [PubMed] [Google Scholar]
- Kent RD, Vorperian HK. Anatomic development of the craniofacial-oral-laryngeal systems: A review. Journal of Medical Speech-Language Pathology. 1995;3:145–90. (Also published as a monograph (1995) San Diego: Singular Publishing Group, Inc.) [Google Scholar]
- Kuhl PK, Meltzoff A,N. Infant vocalizations in response to speech: vocal imitation and developmental change. Journal of the Acoustical Society of America. 1996;100:2425–2438. doi: 10.1121/1.417951. [DOI] [PMC free article] [PubMed] [Google Scholar]
- Lee S, Potamianos A, Narayanan S. Acoustics of children's speech: developmental changes of temporal and spectral parameters. Journal of the Acoustical Society of America. 1999;105:1455–1468. doi: 10.1121/1.426686. [DOI] [PubMed] [Google Scholar]
- Leeper HA, Tissington ML, Munhall KG. Temporal aspects of velopharyngeal function in children. Cleft Palate-Craniofacial Journal. 1998;35:215–221. doi: 10.1597/1545-1569_1998_035_0215_tcovfi_2.3.co_2. [DOI] [PubMed] [Google Scholar]
- Lieberman DE, McCarthy RC, Hiiemae KM, Palmer JB. Ontogeny of postnatal hyoid and larynx descent in humans. Archives of Oral Biology. 2001;46:117–128. doi: 10.1016/s0003-9969(00)00108-4. [DOI] [PubMed] [Google Scholar]
- Linville SE, Rens J. Vocal tract resonance analysis of aging voice using long-term average spectra. Journal of Voice. 2001;15:323–330. doi: 10.1016/S0892-1997(01)00034-0. [DOI] [PubMed] [Google Scholar]
- Litzaw LL, Dalston RM. The effect of gender upon nasalance scores among normal adult speakers. Journal of Communication Disorders. 1992;25:55–64. doi: 10.1016/0021-9924(92)90014-n. [DOI] [PubMed] [Google Scholar]
- Liu HM, Tsao FM, Kuhl PK. The effect of reduced vowel working space on speech intelligibility in Mandarin-speaking young adults with cerebral palsy. Journal of the Acoustical Society of America. 2005;117:3879–3889. doi: 10.1121/1.1898623. [DOI] [PubMed] [Google Scholar]
- Maeda S. An articulatory model of the tongue based on a statistical analysis. Journal of the Acoustical Society of America. 1979;65:S22. [Google Scholar]
- Maeda S. Compensatory articulation during speech: Evidence from the analysis and synthesis of vocal-tract shapes using an articulatory model. In: Hardcastle WL, Marchal A, editors. Speech production and speech modeling. Kluwer Academic; Dodrecht, The Netherlands: 1990. pp. 131–149. [Google Scholar]
- Martland P, Whiteside SP, Beet SW, Baghai-Ravary L. Estimating child and adolescent formant frequency values from adult data; Proceedings of the Applied Science and Engineering Laboratories Conference ICSLP'96; Philadelphia. October 1996.1996. pp. 622–625. [Google Scholar]
- Masataka N, Bloom K. Acoustic properties that determine adults' preferences to 3-month-old infant vocalizations. Infant Behavior and Development. 1994;17:461–464. [Google Scholar]
- McKerns D, Bzoch K. Variations in velopharyngeal valving: the factor of sex. Cleft Palate Journal. 1970;7:652–662. [PubMed] [Google Scholar]
- Menard L, Schwartz J-L, Boe L-J. Role of vocal tract morphology in speech development: Perceptual targets and sensorimoto maps for synthesized French vowels from birth to adulthood. Journal of Speech, Language, and Hearing Research. 2004;47:1059–1080. doi: 10.1044/1092-4388(2004/079). [DOI] [PubMed] [Google Scholar]
- Miller JD, Engebretson AM, Vemula NR. Vowel normalization: Differences between vowels spoken by children, women, and men. Journal of the Acoustical Society of America. 1980;68(Issue S1):S33. [Google Scholar]
- Molis MR. Evaluating models of vowel perception. Journal of the Acoustical Society of America. 2005;118:1062–1071. doi: 10.1121/1.1943907. [DOI] [PubMed] [Google Scholar]
- Moura CP, Cunha LM, Vilarinho H, Cunha MJ, Freitas D, Palha M, Pueschel SM, Pais-Clemente M. Voice parameters in children with Down syndrome. Journal of Voice. doi: 10.1016/j.jvoice.2006.08.011. in press. [DOI] [PubMed] [Google Scholar]
- Mra Z, Sussman JE, Fenwick J. HONC measures in 4- to 6-year-old children. Cleft Palate-Craniofacial Journal. 1998;35:408–414. doi: 10.1597/1545-1569_1998_035_0408_hmityo_2.3.co_2. [DOI] [PubMed] [Google Scholar]
- Munson B, Pearl Solomon N. The effect of phonological neighborhood density on vowel articulation. Journal of Speech, Language, and Hearing Research. 2004;47:1048–1058. doi: 10.1044/1092-4388(2004/078). [DOI] [PMC free article] [PubMed] [Google Scholar]
- Nijland L, Maassen B, Van der Meulen S, Gabreels F, Kraaimaat FW, Schreuder R. Coarticulation patterns in children with developmental apraxia of speech. Clinical Linguistics and Phonetics. 2002;16:461–83. doi: 10.1080/02699200210159103. [DOI] [PubMed] [Google Scholar]
- Nishimura T. Comparative morphology of the hyo-laryngeal complex in anthropoids: two steps in the evolution of the descent of the larynx. Primates. 2003;44:41–49. doi: 10.1007/s10329-002-0005-9. [DOI] [PubMed] [Google Scholar]
- Nishimura T, Mikami A, Suzuki J, Matsuzawa T. Descent of the hyoid in chimpanzees: evolution of face flattening and speech. Journal of Human Evolution. doi: 10.1016/j.jhevol.2006.03.005. in press. [DOI] [PubMed] [Google Scholar]
- Nittrouer S. The emergence of mature gestural patterns is not uniform: evidence from an acoustic study. Journal of Speech and Hearing Research. 1993;36:959–972. doi: 10.1044/jshr.3605.959. [DOI] [PubMed] [Google Scholar]
- Oller DK. The emergence of the speech capacity. Lawrence Erlbaum Associates; Mahwah, NJ: 2000. [Google Scholar]
- Pentz A, Gilbert H. Comparison of formants in preadolescent children's vowel productions; a poster session at 1983 Annual Convenrtion fo the American Speech-Language-Hearing Association; 1983. Paper presented in. In Kent, R. D. (1994) Reference manual for communicative sciences and disorders: Speech and language. San Antoniao, TX: Pro-Ed. p.73. [Google Scholar]
- Peterson GE, Barney HL. Control methods used in a study of the vowels. The Journal of the Acoustical Society of America. 1952;24:585–594. [Google Scholar]
- Perry TL, Ohde RN, Ashmead DH. The acoustic bases for gender identification from children's voices. Journal of the Acoustical Society of America. 2001;109:2988–2998. doi: 10.1121/1.1370525. [DOI] [PubMed] [Google Scholar]
- Prathanee B, Thanaviratananich S, Pongjunyakul A, Rengpatanakij K. Nasalance scores for speech in normal Thai children. Scandinavian Journal of Plastic & Reconstructive Surgery & Hand Surgery. 2003;37:351–355. doi: 10.1080/02844310310005892. [DOI] [PubMed] [Google Scholar]
- Rastatter MP, McGuire RA, Kalinowski J, Stuart A. Formant frequency characteristics of elderly speakers in contextual speech. Folia Phoniatrica et Logopaedica. 1997;49:1–8. doi: 10.1159/000266431. [DOI] [PubMed] [Google Scholar]
- Robb MP, Cacace AT. Estimation of formant frequencies in infant cry. International Journal of Pediatric Otorhinolaryngology. 1995;32:57–67. doi: 10.1016/0165-5876(94)01112-b. [DOI] [PubMed] [Google Scholar]
- Robb MP, Chen Y, Gilbert HR. Developmental aspects of formant frequency and bandwidth in infants and toddlers. Folia Phoniatrica et Logopaedica. 1997;49:88–95. doi: 10.1159/000266442. [DOI] [PubMed] [Google Scholar]
- Rvachew S, Slawinski EB, Williams M, Green CL. Formant frequencies of vowels produced by infants with and without early onset otitis media. Canadian Acoustics/Acoustique Canadienne. 1996;24:19–28. [Google Scholar]
- Sasaki CT, Levine PA, Laitman JT, Crelin ES., Jr. Postnatal descent of the epiglottis in man. A preliminary report. Archives of Otolaryngology. 1977;103:169–171. doi: 10.1001/archotol.1977.00780200095011. [DOI] [PubMed] [Google Scholar]
- Sato K, Hirano M, Nakashima T. Fine structure of the human newborn and infant vocal fold mucosae. Annals of Otology, Rhinology, & Laryngology. 2001;110:417–424. doi: 10.1177/000348940111000505. [DOI] [PubMed] [Google Scholar]
- Schenk BS, Baumgartner WD, Hamzavi JS. Changes in vowel quality after cochlear implantation. ORL Journal of Otorhinolaryngology Related Specialties. 2003;65:184–188. doi: 10.1159/000072257. [DOI] [PubMed] [Google Scholar]
- Scukanec GP, Petrosino L, Squibb K. Formant frequency characteristics of children, young adult, and aged female speakers. Perceptual & Motor Skills. 1991;73:203–208. doi: 10.2466/pms.1991.73.1.203. [DOI] [PubMed] [Google Scholar]
- Schwartz DS, Keller MS. Maturational descent of the epiglottis. Archives of Otolaryngology, Head and Neck Surgery. 1997;123:627–628. doi: 10.1001/archotol.1997.01900060069012. [DOI] [PubMed] [Google Scholar]
- Seaver EJ, Dalston RM, Leeper HA, Adams LE. A study of nasometric values for normal nasal resonance. Journal of Speech, Language, & Hearing Research. 1991;34:715–721. doi: 10.1044/jshr.3404.715. [DOI] [PubMed] [Google Scholar]
- Siegel-Sadewitz VL, Shprintzen RJ. Changes in velopharyngeal valving with age. International Journal of Pediatric Otorhinolaryngology. 1986;11:171–182. doi: 10.1016/s0165-5876(86)80011-8. [DOI] [PubMed] [Google Scholar]
- Smith A, Goffman L. Interaction of motor and language factors in the development of speech. In: Maassen B, Kent R, Peters H, van Lieshout P, Hulstijn W, editors. Speech motor control in normal and disordered speech. Oxford University Press; Oxford, England: 2004. pp. 227–252. [Google Scholar]
- Smith DR, Patterson RD, Turner, Kawahara H, Irino T. The processing and perception of size information in speech sounds. Journal of the Acoustical Society of America. 2005;117:305–318. doi: 10.1121/1.1828637. [DOI] [PMC free article] [PubMed] [Google Scholar]
- Story BH, Titze IR, Hoffman EA. Vocal tract area functions for an adult female speaker based on volumetric imaging. Journal of the Acoustical Society of America. 1998;104:471–487. doi: 10.1121/1.423298. [DOI] [PubMed] [Google Scholar]
- Sweeney T, Sell D, O'Regan M. Nasalance scores for normal-speaking Irish children. Cleft Palate & Craniofacial Journal. 2004;41:168–174. doi: 10.1597/02-094. [DOI] [PubMed] [Google Scholar]
- Syrdal AK, Gopal HS. A perceptual model of vowel recognition based on the auditory representation of American English vowels. Journal of the Acoustical Society of America. 1986;79:1086–1100. doi: 10.1121/1.393381. [DOI] [PubMed] [Google Scholar]
- Templin MC. Certain language skills in children: Their development and interrelationships. University of Minnesota Press; Minneapolis, MN: 1957. [Google Scholar]
- Thom S, Hoit J, Hixon T, Smith A. Velopharyngeal function during vocalization in infants. The Cleft Palate-Craniofacial Journal. 2005 doi: 10.1597/05-113. [published online 15 November 2005; doi: 10.1597/05-113] [DOI] [PubMed] [Google Scholar]
- Thompson AE, Hixon TJ. Nasal air flow during normal speech production. Cleft Palate Journal. 1979;16:412–420. [PubMed] [Google Scholar]
- Traunmuller H, Eriksson A. A method for measuring formant frequencies at high fundamental frequencies; Proceedings of EuroSpeech '97.1997. pp. 470–480. [Google Scholar]
- Van Doorn J, Purcell A. Nasalance levels in the speech of normal Australian children. Cleft Palate-Craniofacial Journal. 1998;35:287–292. doi: 10.1597/1545-1569_1998_035_0287_nlitso_2.3.co_2. [DOI] [PubMed] [Google Scholar]
- Van Lierde KM, Wuyts FL, De Brodt M, Van Cauwenberge P. Nasometric values for normal nasal resonance in the speech of young Flemish adults. Cl;eft Palate and Craniofacial Journal. 2001;38:112–118. doi: 10.1597/1545-1569_2001_038_0112_nvfnnr_2.0.co_2. [DOI] [PubMed] [Google Scholar]
- Vilella BD, Vilella OD, Koch HA. Growth of the nasopharynx and adenoidal development in Brazilian subjects. Pesquisa Odontologica Brasileira. 2006;20:70–75. doi: 10.1590/s1806-83242006000100013. [DOI] [PubMed] [Google Scholar]
- Vogler RC, Ii FJ, Pilgram TK. Age-specific size of the normal adenoid pad on magnetic resonance imaging. Clinics in Otolaryngology and Allied Sciences. 2000;25:392–395. doi: 10.1046/j.1365-2273.2000.00381.x. [DOI] [PubMed] [Google Scholar]
- Vorperian HK. Ph.D. dissertation. University of Wisconsin-Madison; 2000. Anatomic Development of the Vocal Tract Structures as Visualized by MRI. [Google Scholar]
- Vorperian HK, Kent RD, Gentry LR, Yandell BS. MRI procedures to study the concurrent anatomic development of the vocal tract structures: Preliminary results. International Journal of Pediatric Otorhinolaryngology. 1999;49:197–206. doi: 10.1016/s0165-5876(99)00208-6. [DOI] [PubMed] [Google Scholar]
- Vorperian HK, Kent RD, Lindstrom MJ, Kalina CM, Gentry LR, Yandell BS. Development of vocal tract length during childhood: A Magnetic Resonance Imaging Study. Journal of the Acoustical Society of America. 2005;117:338–350. doi: 10.1121/1.1835958. [DOI] [PubMed] [Google Scholar]
- Walsh B, Smith A. Articulatory movements in adolescents: evidence for protracted development of speech motor control processes. Journal of Speech, Language, & Hearing Research. 2002;45:1119–1133. doi: 10.1044/1092-4388(2002/090). [DOI] [PubMed] [Google Scholar]
- Wermke K, Mende W, Manfredi C, Bruscaglioni P. Developmental aspects of infant's cry melody and formants. Medical Engineering & Physics. 2002;24:501–514. doi: 10.1016/s1350-4533(02)00061-9. [DOI] [PubMed] [Google Scholar]
- White P. Formant frequency analysis of children's spoken and sung vowels using sweeping fundamental frequency production. Journal of Voice. 1999;13:570–582. doi: 10.1016/s0892-1997(99)80011-3. [DOI] [PubMed] [Google Scholar]
- Whiteside SP. Sex-specific fundamental and formant frequency patterns in a cross-sectional study. Journal of the Acoustical Society of America. 2001;110:464–478. doi: 10.1121/1.1379087. [DOI] [PubMed] [Google Scholar]
- Whiteside SP, Hodgson C. Speech patterns of children and adults elicited via a picture-naming task: An acoustic study. Speech Communication. 2000;32:267–285. [Google Scholar]
- Xue SA, Y Hao JG. Changes in the human vocal tract due to aging and the acoustic correlates of speech production: a pilot study. Journal of Speech, Language, and Hearing Research. 2003;46:689–701. doi: 10.1044/1092-4388(2003/054). [DOI] [PubMed] [Google Scholar]
- Xue SA, Hao JG. Normative standards for vocal tract dimensions by race as measured by acoustic pharyngotomy. Journal of Voice. doi: 10.1016/j.jvoice.2005.05.001. in press. Corrected Proof, Available online 21 October 2005. [DOI] [PubMed] [Google Scholar]
- Yamashita K. [Age-related development of the arrangement of connective tissue fibers in the lamina propria of the human vocal folds--scanning electron microscope examination with digestion method]. [Japanese] Nippon Jibiinkoka Gakkai Kaiho [Journal of the Oto-Rhino-Laryngological Society of Japan] 1997;100:495–511. doi: 10.3950/jibiinkoka.100.499. [DOI] [PubMed] [Google Scholar]
- Yang B. A comparative study of American English and Korean vowels produced by male and female speakers. Journal of Phonetics. 1996;24:245–261. [Google Scholar]
- Zahorian SA, Jagharghi AJ. Speaker normalization of static and dynamic vowel spectral features. Journal of the Acoustical Society of America. 1991;90:67–75. doi: 10.1121/1.402350. [DOI] [PubMed] [Google Scholar]
- Zahorian SA, Jagharghi AJ. Spectral-shape features versus formants as acoustic correlates for vowels. Journal of the Acoustical Society of America. 1993;94:1966–1982. doi: 10.1121/1.407520. [DOI] [PubMed] [Google Scholar]


